R E S E A R C H
Open Access
Differential gene expression analysis tools
exhibit substandard performance for long
non-coding RNA-sequencing data
Alemu Takele Assefa
1*†, Katrijn De Paepe
4, Celine Everaert
3, Pieter Mestdagh
3, Olivier Thas
1,2†and Jo Vandesompele
3†Abstract
Background:Long non-coding RNAs (lncRNAs) are typically expressed at low levels and are inherently highly variable. This is a fundamental challenge for differential expression (DE) analysis. In this study, the performance of 25 pipelines for testing DE in RNA-seq data is comprehensively evaluated, with a particular focus on lncRNAs and low-abundance mRNAs. Fifteen performance metrics are used to evaluate DE tools and normalization methods using simulations and analyses of six diverse RNA-seq datasets.
Results:Gene expression data are simulated using non-parametric procedures in such a way that realistic levels of expression and variability are preserved in the simulated data. Throughout the assessment, results for mRNA and lncRNA were tracked separately. All the pipelines exhibit inferior performance for lncRNAs compared to mRNAs across all simulated scenarios and benchmark RNA-seq datasets. The substandard performance of DE tools for lncRNAs applies also to low-abundance mRNAs. No single tool uniformly outperformed the others. Variability, number of samples, and fraction of DE genes markedly influenced DE tool performance.
Conclusions:Overall, linear modeling with empirical Bayes moderation (limma) and a non-parametric approach
(SAMSeq) showed good control of the false discovery rate and reasonable sensitivity. Of note, for achieving a sensitivity of at least 50%, more than 80 samples are required when studying expression levels in realistic settings such as in clinical cancer research. About half of the methods showed a substantial excess of false discoveries, making these methods unreliable for DE analysis and jeopardizing reproducible science. The detailed results of our study can be consulted through a user-friendly web application, giving guidance on selection of the optimal DE tool (http://statapps.ugent.be/tools/AppDGE/).
Keywords:RNA-seq, mRNA, lncRNA, Differential gene expression
Background
Messenger RNA (mRNA) has been the primary target of transcriptome studies. However, RNA sequencing tech-nology has revealed that the human genome is pervasively transcribed, resulting in thousands of novel non-coding RNA genes. Hence, attention is expanding to one of the most poorly understood, yet most common RNA species: long non-coding RNAs (lncRNAs) [1,2]. These lncRNAs
form a large and diverse class of transcribed RNA mole-cules, constituting up to 70% of the transcriptome with a defined length of 200 nucleotides. While they do not encode proteins, lncRNAs are strong regulators of gene expression [3]. The discovery and study of lncRNAs are of major relevance to human health and disease because they represent an extensive, largely unexplored, and functional component of the genome [3–5]. In contrast to mRNAs, lncRNAs are generally expressed in low amounts, typically an order of magnitude lower than mRNA expression levels [2,6,7]. Furthermore, several studies [7–9] demon-strated that lncRNA expression levels are very noisy, * Correspondence:[email protected]
†Alemu Takele Assefa, Olivier Thas and Jo Vandesompele contributed equally
to this work.
1Department of Data Analysis and Mathematical Modeling, Ghent University,
Ghent, Belgium
Full list of author information is available at the end of the article
which is a characteristic shared with low count data from massively parallel RNA sequencing.
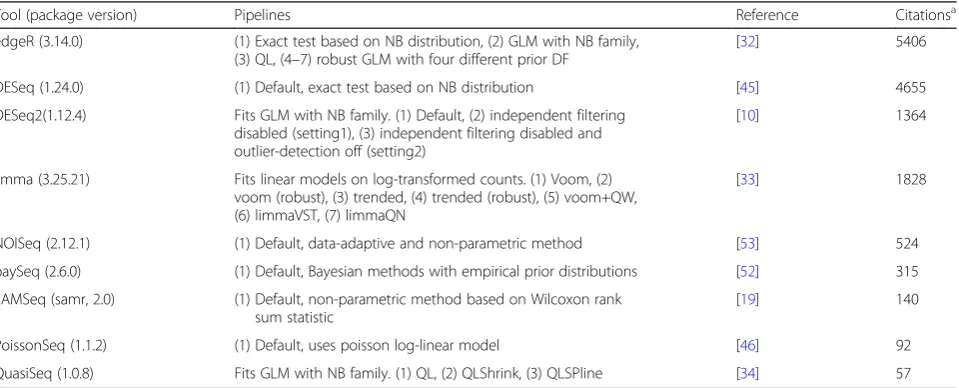
Following the advent of RNA-sequencing (RNA-seq) technologies, several statistical tools for differential gene expression (DGE) analysis have been introduced. However, low and noisy read counts, such as those com-ing from lncRNAs, are potentially challengcom-ing for the tools [10, 11]. For example, it is commonly observed that low count genes show large variability of the fold-change esti-mates and thus exhibit inherently noisier inferential behavior. The majority of the methods suggest removal of low expressed genes before the start of data analysis, but this procedure essentially blocks researchers from studying lncRNAs. In our study, no such severe filtering was applied, leaving almost all lncRNAs in the dataset. To our knowledge, no statistical method has been specifically developed for the analysis of lncRNA-seq data and there-fore transcriptome studies make use of statistical methods that assume sufficient expression levels. In this paper, we evaluated and compared the performance of many popu-lar statistical methods (Table1) developed for testing DGE of RNA-seq data (hereafter referred to as“DE tools”), with special emphasis on lncRNAs and low-abundance mRNAs. All tools considered in this study are popular (in terms of number of citations), available as R software packages [12], and use gene or transcript level read counts as input. Our conclusions are based on six RNA-seq data-sets and many realistic simulations, representing various typical gene expression experiments.
Previous comparative studies of DE tools [11, 13–18] focused on mRNA and some of these concluded that DE tools show inferior performance for genes or transcripts with low counts. We extend previous studies by including
lncRNAs and low expressed mRNAs separately. Further, our results are based on diverse types of RNA-seq datasets that vary with respect to their biological and technical features, such as species (human, mouse, rat), experimen-tal design (control versus treatment, diseased versus non-diseased, and tissue comparisons), and level of biological variability. We assess the degree of concordance among results returned from the DE tools, and we study important statistical properties of DE tools, such as their ability to control the false discovery rate (FDR) and their sensitivity for the detection of DE. The latter are empiric-ally investigated using a non-parametric resampling-based simulation procedure. The simulation method essentially resamples data from a real RNA-seq dataset to create realistic gene expression scenarios. Consequently, our re-sults reflect the genuine behaviour of the DE tools under study, in contrast to simulation studies based on paramet-ric assumptions. Note that the evaluation of a method that relies on a parametric assumption (e.g., edgeR, DESeq, and DESeq2 assume a negative binomial distribution) by means of simulated counts using the same distribution as used in [14] will give too optimistic results. Moreover, these results do not reflect a realistic setting because the distributional assumption cannot be expected to hold in general [19]. By starting from a variety of real and representative RNA-seq datasets, the scope of our findings is wide. To our knowledge, our study is the largest empirical evaluation conducted so far in terms of the number of real datasets used, the number of performance metrics evaluated, and the number of DE pipelines included (Additional file1: Figure S1).
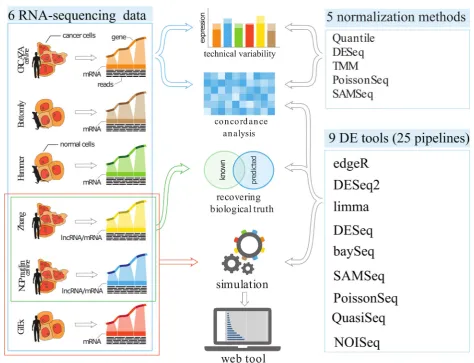
[image:2.595.60.540.512.706.2]Our study consists of four parts: first we evaluated various normalization procedures; second we compared
Table 1List of DE tools and pipelines along with their reference and number of citations
Tool (package version) Pipelines Reference Citationsa
edgeR (3.14.0) (1) Exact test based on NB distribution, (2) GLM with NB family, (3) QL, (4–7) robust GLM with four different prior DF
[32] 5406
DESeq (1.24.0) (1) Default, exact test based on NB distribution [45] 4655
DESeq2(1.12.4) Fits GLM with NB family. (1) Default, (2) independent filtering disabled (setting1), (3) independent filtering disabled and outlier-detection off (setting2)
[10] 1364
limma (3.25.21) Fits linear models on log-transformed counts. (1) Voom, (2) voom (robust), (3) trended, (4) trended (robust), (5) voom+QW, (6) limmaVST, (7) limmaQN
[33] 1828
NOISeq (2.12.1) (1) Default, data-adaptive and non-parametric method [53] 524
baySeq (2.6.0) (1) Default, Bayesian methods with empirical prior distributions [52] 315
SAMSeq (samr, 2.0) (1) Default, non-parametric method based on Wilcoxon rank sum statistic
[19] 140
PoissonSeq (1.1.2) (1) Default, uses poisson log-linear model [46] 92
QuasiSeq (1.0.8) Fits GLM with NB family. (1) QL, (2) QLShrink, (3) QLSPline [34] 57
a
As reported by Web of Science (http://www.webofknowledge.com/; April 25, 2018). Further description about the pipelines can be found in the“Methods”section.
the level of agreement among DE pipelines using various publicly available RNA-seq datasets; third we explored the ability of the DE pipelines to recover known evidence of differential expression; and fourth we used simulation procedures to evaluate and compare the performance of the tools under a variety of gene expression experiment scenarios (Fig.1), such as variability, sample size, and frac-tion of DE genes.
Results and discussion
RNA-seq datasets
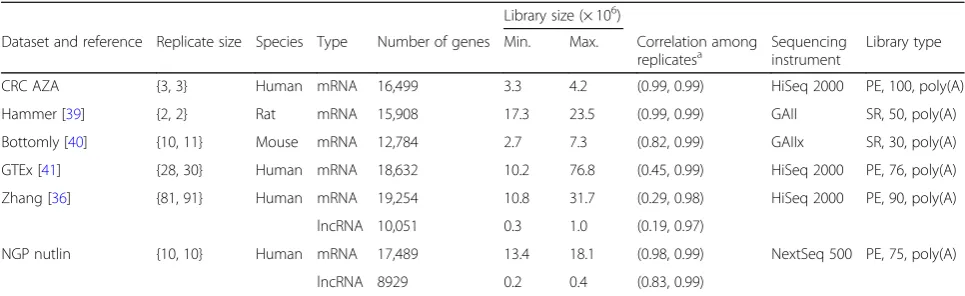
Six publicly available benchmark RNA-seq datasets were used for the concordance analysis. Three of them were used as source datasets for generating non-parametric simulated data. The description of the datasets can be
found in the“Methods”section; a summary is presented in Table2.
The degree of homogeneity among samples, as measured by Pearson’s correlation coefficient, was lowest for the Zhang dataset followed by GTEx (see also the es-timated biological coefficients of variation in Additional file 1: Figure S2). As expected, the other datasets had replicates that are more homogeneous because they were obtained from inbred animals or cultured cell lines, in contrast to the GTEx or Zhang datasets containing tissues for different human individuals. For the Zhang and NGP nutlin datasets, lncRNAs showed relatively higher heterogeneity across samples than mRNAs. In addition, lncRNAs showed, on average, lower expression than mRNAs (Additional file1: Figure S3).
[image:3.595.60.535.290.653.2]Comparison of normalization methods
Comparing DE tools requires careful attention to the normalization methods. Previous studies [13, 16, 20, 21] have pointed out that the normalization procedure can affect DE results. The aim of our study is not to perform a comprehensive comparison of all normalization methods. Instead, we compared five normalization methods that are used in conjunction with the DE methods evaluated in this study. This will allow us to better understand the general behavior of the DE tools as evaluated in the subse-quent sections. The normalization methods were compared using the metrics from Dillies et al. [20], such as their capability to reduce technical variability and to eliminate bias due to library size differences, and their ef-fect on DGE analysis.
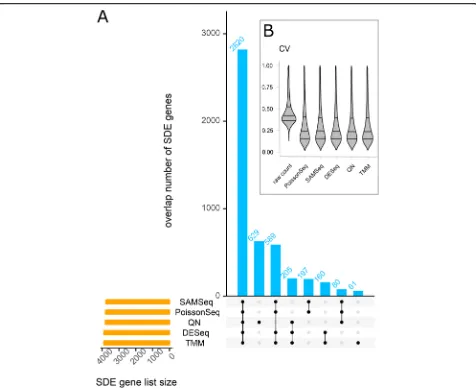
Box plots of the relative log expressions show that for all six datasets all normalization methods succeed in aligning the sample-specific distributions and hence no library size effects were noticeable after normalization (Additional file 2: Section 2.2). Furthermore, the condition-specific gene-wise coefficient of variation (CV), which is a proxy for intra-group variability, was lower for all datasets upon normalization (Fig. 2b and Additional file 2: Section 2.3). Nearly equal levels of biological variability across methods were observed, even with quantile normalization that was found to result in high CV in other studies [20, 22]. The overlap of DE genes with different normalization methods was high (Fig. 2a and Additional file 2: Section 2.4). Ignoring quantile normalization (QN), on average (across the six dataset) a minimum of 86% similarity was observed. QN-based DE analysis gives deviating results, particularly for designs with small numbers of replicates (< 5); the average minimum proportion of similarity was 70.1% (average minimums are calculated across datasets). Over-all, the results suggest that all normalization methods perform almost equally, except QN. Nevertheless, for the
concordance analysis of the DE tools (see next section) we include a limma pipeline that uses QN (named limmaQN) to further investigate its effect on other performance met-rics of DE tools.
Concordance analysis
Twenty-five DE pipelines were run on six RNA-seq datasets, and (dis)similarities among the results were ex-amined. The concordance analysis focused on five quanti-tative and one qualiquanti-tative metric: (1) number of genes identified as significantly differentially expressed (SDE); (2) similarity in terms of the set of SDE genes; (3) the degree of agreement on gene ranking; (4) similarity of fold-change estimates; (5) handling of genes with special characteristics (lncRNAs, genes with low counts, genes with outliers); and (6) computation time. The results for individual datasets are presented in Additional file3.
Results show that the pipelines show substantial vari-ability in the numbers of SDE genes. The marginal sum-mary across all datasets indicates that DESeq, NOISeq, baySeq, and limmaQN detected the smallest number of SDE genes, whereas QuasiSeq and SAMSeq returned the largest numbers (Fig. 3). The variability among DE pipelines with respect to the number of SDE genes seems to be related to the biological variability in the dataset. For the Zhang and GTEx RNA-seq datasets, characterized by the largest intra-group biological variability, the numbers of SDE genes were quite different among the DE pipelines. In contrast, the numbers of SDE genes from the NGP nutlin and CRC AZA datasets, all displaying low biological variability, were relatively similar among pipelines. lncRNAs and low-abundance genes in general were under-represented among the SDE genes (Additional file3). For example, 25% of the SDE genes were lncRNAs, whereas the data contain 40% lncRNAs.
[image:4.595.56.539.98.246.2]Many of the DE pipelines showed agreement to each other in terms of the set of SDE genes (Fig. 3). On
Table 2Summary of datasets
Library size (× 106)
Dataset and reference Replicate size Species Type Number of genes Min. Max. Correlation among
replicatesa Sequencinginstrument Library type
CRC AZA {3, 3} Human mRNA 16,499 3.3 4.2 (0.99, 0.99) HiSeq 2000 PE, 100, poly(A)
Hammer [39] {2, 2} Rat mRNA 15,908 17.3 23.5 (0.99, 0.99) GAII SR, 50, poly(A)
Bottomly [40] {10, 11} Mouse mRNA 12,784 2.7 7.3 (0.82, 0.99) GAIIx SR, 30, poly(A)
GTEx [41] {28, 30} Human mRNA 18,632 10.2 76.8 (0.45, 0.99) HiSeq 2000 PE, 76, poly(A)
Zhang [36] {81, 91} Human mRNA 19,254 10.8 31.7 (0.29, 0.98) HiSeq 2000 PE, 90, poly(A)
lncRNA 10,051 0.3 1.0 (0.19, 0.97)
NGP nutlin {10, 10} Human mRNA 17,489 13.4 18.1 (0.98, 0.99) NextSeq 500 PE, 75, poly(A)
lncRNA 8929 0.2 0.4 (0.83, 0.99)
a
Pearson’s correlation is calculated among replicates within conditions based on read counts
average, NOISeq, limmaQN, DESeq, baySeq, and SAM-Seq showed the smallest concordance with all other tested pipelines. It was also observed that the overlap of SDE is smaller for lncRNAs than for mRNAs (Additional file1: Figure S4). In the Zhang dataset, there is less than 70 and 60% SDE overlap across all DE tools for mRNAs and lncRNAs, respectively.
Accurate gene ranking is an essential step for down-stream analysis such as gene set enrichment analysis (GSEA) [23]. The degree of agreement among the 25 DE pipelines’ gene ranking is studied using the rank of π scores; taking into account both the significance and magnitude of differential expression [24]. Summarized results across datasets (Fig. 3) indicate that all pipelines strongly agree, except for baySeq, NOISeq, SAMSeq,
and limmaQN. Apart from baySeq, this is somewhat in contrast to the findings in Soneson and Delorenzi [14]. This might be due to the difference in the score used to rank genes, as onlypvalues were used to rank genes in Soneson and Delorenzi [14]. Except for limmaQN, gene ranking agreement among all pipelines was nearly the same for lncRNAs and mRNAs from analyzing the NGP nutlin data. A slightly lower agreement for lncRNAs was observed when the most variable dataset (Zhang) was used (Additional file1: Figure S4).
[image:5.595.60.536.85.474.2]relatively stronger for the datasets with higher numbers of samples per group. In addition, the correlations for lncRNAs were lower than for mRNAs (Additional file1: Figure S4 and Additional file3: Sections 5.4 and 6.4).
In addition, we qualitatively examined the handling of genes with outlier expression (Additional file 1: Section 3.1). A set of genes with outlier count in only one of the samples (from the Zhang data) was chosen (Additional file 1: Figure S5). The adjustedpvalues for these outlier genes shows that edgeR exact, edgeR GLM, edgeR QL, Poisson-Seq, QuasiSeq (both settings), and baySeq declared most of them SDE at 5% nominal FDR (Additional file1: Table S2), suggesting that they can be affected by outlier expression.
To come to an overall conclusion, the results were combined in a hierarchical clustering analysis of the DE pipelines, resulting in 4 clusters (Fig. 3). DESeq, baySeq,
[image:6.595.57.539.87.414.2]freedom), limmaVoom+QW, PoissonSeq, and SAMSeq. They detect the most SDE genes and show a modest proportion of overlap, gene ranking agreement, and LFC similarity.
Moreover, with respect to identifying DE genes among genes that are detected only in one group of samples, DESeq, baySeq, and PoissonSeq fail to estimate a mean-ingful fold change. On the other hand, edgeR exact test, DESeq, and SAMSeq return no pvalue for such genes with a low signal-to-noise (STN) ratio (Additional file1: Section 3.2). STN is defined as the ratio of the mean to the standard deviation of normalized counts in the group with detected gene expression [13]. In general, and not unexpectedly, all the pipelines assign significant p values for such genes with a high STN ratio (Additional file 1: Figure S6). This suggests that re-searchers need to be cautious when interpreting the DE results, particularly when the 0 read counts in one of the groups is likely caused by technical artefacts. Moreover, for lncRNAs (also for low-abundance mRNAs), the STN ratio is typically low, and hence all the DE pipelines fail to detect true DE among such genes. However, from the relationship between the STN and adjustedpvalues, one can learn that limma and QuasiSeq tools (and edgeR ro-bust and DESeq2 to a lesser extent) detect such genes as SDE even at low STN (Additional file1: Figure S6).
Results obtained with the three settings of DESeq2 were not markedly different, except that the independent filtering excluded more lncRNAs (29% from the Zhang data) than mRNAs (Additional file1: Figure S7). Among the seven limma pipelines, voom and trended (with and without robust estimate of the prior degrees of freedom) showed relatively better concordance. In addition, voom with sample quality weight (limmaVoom+QW) tend to identify more SDE genes. Similarly, edgeR pipelines attained similar concordance except that edgeR robust detects slightly more SDE genes than the average. Al-though the three QuasiSeq pipelines cluster together, the quasi-likelihood (QL) method with an independent esti-mate of the gene-wise QL dispersion showed worse agreement in terms of the set of SDE genes.
The computation time to run DGE analysis presented in Additional file 1: Figure S8 shows that baySeq and DESeq require the longest time, whereas limma tools and PoissonSeq run fast. For RNA-seq data with ten replicates per group and 19,150 mRNAs, the slowest tools, baySeq and DESeq, were approximately 8000 and 2000 times slower than the fastest pipeline, limmaQN, respectively.
Recovering biological truth
In addition to the concordance analysis, we also assessed the capability of the DE tools to recover genes with known biological evidence of DE in the benchmark
datasets. To this purpose, results from three published studies were used to define the truth: genes with gender-biased expression [25], MYCN regulated genes [26], and TP53 pathway genes [27] (see “Methods” for description). The ability to recover the truth is evaluated using four metrics: number of recovered genes, similar-ity among DE pipelines in terms of the set of recovered genes, gene classification agreement with the truth, and GSEA. Detailed results can be found in Additional file4. Despite the challenge of defining biological truth, several pipelines show relatively good performance in re-covering the known truth, definitely when considering that the experimental conditions are not identical in the benchmark studies and the truth studies. However, in terms of the number of recovered genes and the degree of similarity to each other, the pipelines show substantial variation. In line with the concordance analysis, conser-vative tools (DESeq, baySeq, and NOISeq) recovered a relatively lower number of genes with low similarity to other tools (Additional file 4: Figure S8). In contrast, tools such as SAMSeq and PoissonSeq that were cate-gorized as liberal (highest number of SDE genes) according to the concordance analysis now ranked generally low in recovering the biological truth across the three control studies and exhibited the least agreement with other pipelines. Across the four metrics assessing biological truth, DESeq2 (both set-tings), edgeR (robust), and limma (voom+QW, voom, and trended) outperformed all other tools, whereas PoissonSeq, SAMSeq, NOISeq, DESeq, and QuasiSeq (both settings) showed inferior capability.
Simulation results
Gene expressions were simulated under a wide range of scenarios that may affect the performance of DE tools: different numbers of replicates ranging from 2 to 40, different proportions of true DE genes (0 to 30%), two gene biotypes (mRNA and lncRNA), and different levels of intra-group biological variability (as present in the three source datasets). From the simulation results, the actual FDR, true positive rate (TPR), and false positive rate (FPR) were computed for each DE pipeline. The comparison between the two gene biotypes was done in two ways: simulating lncRNA data only or simulating lncRNA and mRNA jointly, but analyzing separately.
False discovery rate and true positive rate
FDR refers to the average proportion of incorrect discov-eries among SDE genes (genes identified as DE at a par-ticular nominal FDR threshold). A good DE tool has actual FDR close to the nominal level, and has high TPR. The TPR, also known as sensitivity, is the average propor-tion of SDE genes among the true DE genes. The TPR should be sufficiently large, otherwise one cannot expect to find many of the true DE genes. Therefore, it is custom-ary to look for a DE pipeline that has the highest TPR among those that control FDR (i.e., actual FDR is close to nominal FDR). The FDR versus TPR curve is used to com-pare the performance of DE pipelines at various nominal FDR threshold (ranging from 0 to 100%).
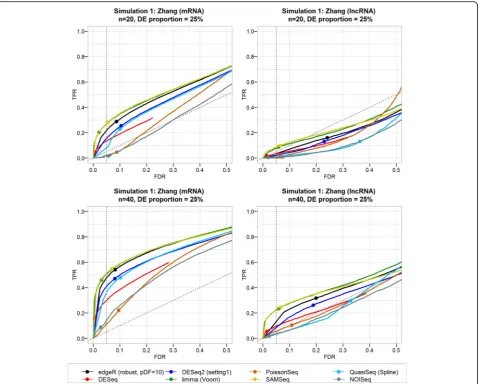
Results from the first simulation (starting from the Zhang data) generally indicate that the FDR is not controlled well by many DE pipelines (Fig. 4). Among the pipelines that control the FDR relatively well, many have a small TPR. Besides the gene biotype (mRNA ver-sus lncRNA), the performance is correlated with the level of the intra-group variability, the number of repli-cate samples, and the fraction of DE genes. Many DE tools show severe FDR inflation and slightly lower TPR when only a small fraction of genes is DE (Additional file1: Figures S9 and S10). The actual FDR may even ex-ceed 50%, which means that more than half of the called SDE genes may be false discoveries. For most DE tools, better FDR control and higher sensitivity were attained with increasing number of replicates (Fig. 4 and Additional file 1: Figures S11 and S12). Performance of all DE pipelines is considerably poorer for lncRNAs than for mRNAs (Figs.4and5). However, very similar results (poor performance in terms of FDR control and TPR) were obtained for low-abundance mRNAs based on a simulation starting from the GTEx data (Additional file 1: Figure S13).
For the simulation that started from the (homoge-neous) NGP nutlin data, the results were better (Fig.5), with good FDR control and high TPR for all DE tools, even for small numbers of replicates. Only for simula-tions with 5% of true DE genes was the FDR control lost
(Additional file 1: Figure S10). The difference in per-formance between the Zhang and NGP nutlin simulations can be explained by their intra-group variability (Table2 and Additional file 1: Figure S2): the NGP nutlin data come from cell line replicates that are characterized by low biological variability. For the simulations starting from the GTEx dataset, which has intermediate biological vari-ability, the performance of the DE tools is somewhere in between those for the Zhang and NGP nutlin datasets (Additional file1: Figure S14).
Because of the trade-off between FDR and TPR, a high TPR is expected for DE tools with a high actual FDR. This was observed for edgeR, DESeq2, and QuasiSeq pipelines, particularly for small numbers of replicates (Fig.4). limma and SAMSeq showed better FDR control, while retaining a high TPR. Their better performance is true for both biotypes with at least ten and four samples per group for the Zhang and NGP nutlin simulations, respectively (Additional file 1: Figures S11 and S12). DESeq, PoissonSeq, and NOISeq showed better FDR control, but at a cost of severe TPR loss.
Among the seven edgeR pipelines, edgeR robust showed generally better performance for the Zhang data simulations (Additional file 1: Figure S15). However, only a small difference was observed in the simulation that starts with the less variable NGP nutlin data. edgeR robust with data-specific prior degrees of freedom seems more beneficial in maximizing the TPR. Only small performance variation was observed among the limma pipelines, except limmaQN, which deviated substan-tially (lower performance) in the second simulation (Additional file 1: Figure S16). This deviation may be due to the number of replicates, as only five samples were used in each group. Among all limma pipelines except limmaQN, voom with sample quality weight (limmaVoom+QW) lost control of FDR. Similarly, minor differences were observed among the DESeq2 pipelines (Additional file 1: Figure S17). However, as indicated in the concordance analysis, the independ-ent filtering should be used carefully for lncRNAs. Similarly, among the QuasiSeq pipelines, the one with QL dispersion estimated independently for each gene, appeared to have worse performance (Additional file 1: Figure S18).
principal component analysis [10,32]. This is confirmed by an extra simulation that starts from the Zhang data whereby the most distant (outlying) samples were excluded beforehand (Additional file 1: Section 4.2.3). The results generally indicate that DE tools perform better with respect to FDR control and sensitivity if outlying samples are ex-cluded (Additional file1: Figures S19 and S20).
Methods for controlling the FDR, for example, Benja-min and Hochberg (BH) [31], rely on the assumption that the rawpvalues have a flat distribution nearp= 1. This assumption, however, might not always hold, espe-cially for low-abundance genes such as lncRNAs and for
[image:9.595.60.539.87.471.2]distribution looks as expected (Additional file 1: Figures S21–S27 and Additional file 2). When the number of replicates is small, a slightly conservative p value distri-bution (a spike near p = 1) is noticeable for lncRNAs, and to a lesser extent for mRNAs. The underlining cause may be the high variability of lncRNAs. This may result in loss of power to detect true DE lncRNAs, as con-firmed by our simulation study. Correct calibration ofp values under the null hypothesis and a large sample size can overcome this issue. Overall, QuasiSeq, DESeq, edgeR (exact test), and limma tools (for small numbers of replicates) returnpvalues that do not well satisfy the assumption ofpvalue uniformity.
False positive rate
The FPR refers to the probability of calling a gene SDE in a scenario with no DE genes at all. FPR of DE tools was eval-uated using a simulated RNAseq data with 0% DE genes (also known as mock comparison). Results shown in Add-itional file1: Figure S28 demonstrate that all DE pipelines resulted in a FPR of less than 1%. The results were similar for both gene biotypes (mRNAs and lncRNAs), except for a slightly higher FPR for lncRNAs than for mRNAs. The FPR was generally larger for methods relying on the negative bi-nomial distribution. This finding is in line with conclusions from a previous comparative study [13] in which it was concluded that the number of false predictions of differen-tial expression from DE tools (most of these DE tools are also the part of our study) is sufficiently low even for genes with low counts (the lowest 25% expressed genes).
Simulation of lncRNA expression data only
Results presented up to this point came from simulating, normalizing, and analyzing lncRNAs and mRNAs to-gether. Of note, joint analysis of the two gene biotypes may affect results. For example, estimates of gene-specific dispersion parameters for negative binomial models are often done by sharing information across all genes using empirical Bays strategy [32–34], and hence the results for lncRNAs depend on mRNA read counts and vice versa. In addition, adjusted pvalues aimed at controlling FDR are calculated taking into account the total number of genes included in the analysis [31]. Therefore, we also evaluated the performance of the DE tools with only lncRNA data, using the same simulation procedures. Our con-clusions remain the same. The results are shown in Additional file 1: Figure S29. The FDR control is gen-erally worse when analyzing lncRNA separately, par-ticularly for small replicate sizes. Only a small reduction in TPR is observed.
Web application
All simulation results can be consulted and visualized with a web application [35].
Conclusions
[image:10.595.58.541.88.283.2]of lncRNAs is characterized by low abundance [2,7,9], high noise [8], and tissue-specific expression [7]. These characteristics are very challenging for DE tools and may potentially negatively affect tool performance [10, 11]. Our study evaluated the performance of widely used statistical tools for testing DGE in RNA-seq data, with separate analysis of mRNA and lncRNA.
Under the assumption that there is no batch effect, all considered normalization methods perform equally well with respect to correcting the library size differences and reducing technical variability. However, QN tends to substantially deviate in terms of its effect on DGE analysis. This result was also confirmed by the poor per-formance of the limma DE pipeline that uses QN. Therefore, it is fair to suggest not to use QN to normalize RNA-seq data. Concordance analysis based on six diverse types of RNA-seq datasets demonstrated that the DE pipelines lack strong consensus on identify-ing a set of significantly differentially expressed genes, gene ranking, and fold-change estimates. For datasets with a small number of replicates and/or heterogeneous replicates, the disagreement is even worse. Lower concordance was observed generally for lncRNAs than for mRNAs. In particular, limmaQN, NOISeq, baySeq, and DESeq (also PoissonSeq and SAMSeq to a smaller extent) showed lower concordance with other DE tools. In contrast, edgeR, DESeq2, and limma (except lim-maQN) tools showed better agreement with other DE tools and consistent characteristics across datasets. In terms of recovering known evidence of a biological truth, DESeq2 (both settings), edgeR (robust), and limma (voom+QW, voom, and trended) showed better capabil-ity than all other tools, whereas PoissonSeq, SAMSeq, NOISeq, DESeq, and QuasiSeq (both settings) showed inferior capability.
Results of the non-parametric simulation study re-vealed that there are substantial differences between methods with respect to FDR control and sensitivity. The DE tool performance is strongly affected by the sample size and biological variability. FDR control at the nominal level is good for all methods for datasets with small biological variability, even with only five biological replicates per condition. On the other hand, for datasets that are more variable, the FDR control is only guaran-teed for larger sample sizes, and only with the following methods: PoissonSeq, limma tools, SAMSeq, and DESeq. All other DE methods result in actual FDR levels far above the nominal level, up to an FDR exceeding 50% for lncRNAs even when studying 40 replicates per con-dition. Differences between the tools in terms of sensi-tivity are not very large, except for PoissonSeq, NOISeq, DESeq, and limmaQN to a smaller extent, which showed the lowest sensitivities among all pipelines. For highly variable data, a maximum sensitivity of 50% for mRNAs
is obtained with at least 40 replicates per condition. For homogeneous samples, this level of sensitivity is reached with four to five replicates per condition. In addition, we have demonstrated that the performance of DE tools can be improved by filtering aberrant samples that substan-tially contribute to the intra-group variability.
In the light of promoting reproducible science, it is es-sential to select a DE tool that succeeds in controlling the FDR level under a large range of conditions. Among these DE tools, one can select one with a high sensitiv-ity. If a DE tool has an actual FDR far larger than the nominal level, many of the claimed discoveries will be false discoveries. If one accepts a large proportion of false discoveries, it is generally better still to use a DE tool with good FDR control, but to apply the method at a larger nominal FDR level. In this way, the researcher still controls the error rate. This reasoning implies that the selection of a DE tool may never rely purely on the sensitivity. High sensitivities may be expected from methods with a large actual FDR (and hence poor FDR control). These high sensitivities are illusive in the light of the large proportion of false discoveries.
Combining all results, we conclude that limma (with variance stabilizing transformation; voom with or with-out quality weighting; trend) and SAMSeq control the actual FDR reasonably well, while not sacrificing sensitivity. However, desirable performance is guaran-teed only for a reasonably large number of replicates and for samples with low variability. Our results also indicate that accurate differential expression inference of lncRNAs requires more samples than that of mRNAs. Although we concluded that DE tools exhibit substandard performance for lncRNAs, the substand-ard performance of DE tools also applies to low-abundance mRNAs.
Methods
RNA-seq datasets
to study concordance analysis of the DE tools, whereas all samples were considered for the simulation study.
Second, the NGP nutlin-3 dataset (GEO accession num-ber GSE104756) contains ten biological replicates of NGP neuroblastoma cells grown in six-well culture flasks treated with either nutlin-3 (8M racemic mixture) or ve-hicle (ethanol). RNA was extracted using the RNeasy mini kit (Qiagen), quantified using Nanodrop-100, and quality controlled using FragmentAnalyzer (High Sensitivity RNA Analysis Kit, DNF-472-0500, Advanced Analytical). Total RNA (100 ng) was used for TruSeq stranded mRNA li-brary prep (Illumina), followed by paired-end sequencing (2 × 75 nucleotides) on a NextSeq 500 instrument (Illu-mina). On average, 20 million read pairs per sample were generated. Raw fastq files were processed with Kallisto2 v0.42.4 (index build with GRCh38-Ensembl v85).
From the Gene Expression Omnibus (GEO) repository of analysis-ready RNA-seq dataset [38], we accessed two datasets: Hammer (GEO accession number GSE20895) and Bottomly mRNA-seq datasets (GEO accession num-ber GSE26024). The Hammer mRNA-seq dataset con-tains the results of a study on the L4 dorsal root ganglion (DRG) of rats with chronic neuropathic pain induced by spinal nerve ligation (SNL) of the neighbour-ing (L5) spinal nerve (two controls and two with L5-SNL induced chronic neuropathic pain) [39]. The study in-cludes RNA-seq samples of each treatment at two differ-ent time points, and in our study we only used samples from the first time point. The Bottomly mRNA-seq data are an expression set obtained from the brain striatum tissues of two mice strains (it includes ten biological replicates of the C57BL/6J (B6) strain and 11 biological replicates of the DBA/2J (D2) strain) [40]. Details about library preparation and features of these datasets can be obtained from the original papers cited above.
We also used a subset of the RNA-seq dataset from the GTEx (Genotype-Tissue Expression) project [41], which provides a large database of human gene expres-sion data with more than 3000 RNA-seq samples from 54 different tissues. For our study, we selected all biological replicates of hippocampus (n2= 28) and hypo-thalamus (n1 = 30) mRNA-seq counts. All information about this dataset can be obtained from the GTEx pro-ject database. Twenty samples randomly selected from each tissue were used for concordance analysis of the DE tools and all samples were considered for the third simulation study.
The colorectal cancer (CRC AZA) RNA-seq dataset contains three biological replicates of HCT-116 cells grown in six-well culture flasks treated with either azaci-tidine (1 μM) or vehicle (DMSO). RNA was extracted using the RNeasy mini kit (Qiagen), quantified using Picogreen, and quality controlled using Bioanalyser Frag-mentAnalyzer. Total RNA (500 ng) was used for TruSeq
stranded mRNA library prep (Illumina), followed by paired-end sequencing (2 × 100 nucleotides) on a HiSeq instrument (Illumina). On average, 40 million read pairs per sample were generated. Raw fastq files were processed with Bowtie2/Cufflinks (index build with GRCh37-Ensembl v75). The count data can be accessed in Additional file 6 [42].
DE tools and normalization methods
Five normalization methods were evaluated in this study: quantile normalization (QN) [43] implemented in limma (limmaQN), Trimmed Mean of M-values (TMM) [44] implemented in edgeR, limma (limmaVoom, limma-Voom+QW, and limmaTrended), baySeq, NOISeq, and QuasiSeq, Medians of ratios [45] implemented in DESeq, DESeq2, and limma (limmaVst), the goodness-of-fit sta-tistics [46] approach in PoissonSeq, and the Poisson re-sampling technique [19] implemented in SAMSeq. To examine the effect of normalization on DGE analysis, we applied moderatedt-test of the limma package in com-bination to each of the five normalization methods. After-wards, the extent of dissimilarity of results was used as an indicator of normalization effect on DGE analysis.
Nine DE tools were evaluated through a total of 25 pipelines (various settings of the DE tools). Seven edgeR pipelines were evaluated: (1) exact test based on negative binomial distribution (edgeR exact, also known as edgeR classic) [47], (2) generalized linear model for multi-factor design (edgeR GLM) [48], (3–6) robust GLM [49], and (7) quasi-likelihood method (edgeR QL) [50]. edgeR ro-bust was run with four different prior degrees of free-dom (pDF) to estimate robust gene-wise dispersions: pDF = 10 (the default), 5, 20, and estimated pDF ob-tained using thegetPriorN()function of the edgeR pack-age. The latter is referred to us “pDF=auto”. The pDF determines the degree of shrinkage of gene-wise disper-sions towards the common estimate. The shrinkage in-fluences the precision of the DE inference, and it is indicated to consider various pDF for different data, de-pending on the number of samples and complexity of the design [11,32].
DESeq2 [10] was applied with three different settings. The default DESeq2 pipeline applies independent filter-ing of low-abundance genes prior to calculatfilter-ing the FDR. It also flags outliers using Cook’s distance. It re-places flagged observations by imputed values if the number of samples is larger than 6, or excludes other-wise. Therefore, besides the default setting, two pipelines were considered: the first setting disables independent filtering (setting 1); the second disables both independ-ent filtering and outlier detection (setting 2).
Bayes moderation. Both voom and trended limma pipe-lines were also applied with a robust estimation of pDF and variance as separate pipelines (3 and 4). (5) limma voom was also applied in conjunction with sample qual-ity weights (limmaVoom+QW) to down-weight low quality samples [30]. Other limma pipelines are (6) limma with QN (limmaQN) [13] and (7) limma with variance stabilizing transformation using DESeq tool (limmaVst) [14].
QuasiSeq [34] applies quasi-likelihood inference to test DE with three different proposed pipelines to estimate gene-specific dispersion (referred to as quasi-dispersion): (1) independent estimates (QL), (2) shrinkage towards a common estimate (QLShrink), and (3) spline-smoothing (QLSpline). DESeq [45], baySeq [52], PoissonSeq [46], SAMSeq [19], and NOISeq (particularly NOISeqBIO) [53] were applied with their default settings. For PoissonSeq the filtration cut-point for the sum and aver-age counts of genes across samples were set to 1 and 0.01, respectively.
All computations were performed in R version 3.3.2 [12]. baySeq was not included in the simulation study due to its slow computation time. The reader can also access the R scripts in Additional file 6 [42].
Concordance analysis
The numbers of SDE genes detected for each dataset were compared among the 25 DE pipelines. For the Zhang and NGP nutlin datasets, we explored the pro-portion of mRNAs and lncRNAs within the set of SDE genes. For the other datasets, we explored the propor-tion of low and high expressed mRNAs among the set of SDE mRNAs. In particular, we divided the genes into four equally large groups based on the quartiles of their average normalized read counts across samples (DESeq normalization). To study the concordance in SDE calling between any two DE pipelines, we calculated the extent of overlap as the proportion of SDE genes commonly de-tected by the two tools. To rank genes in the order of significance of differential expression, taking into ac-count the biological importance of the significance, we calculated theπscore [24]:
πi¼−log10piφi
where φi is the absolute value of the estimated LFC for
the ith gene and pi is the raw p value, except for
SAMSeq, for which pi is replaced by wi−1, where w is
the Wilcoxon statistic [19]. For baySeq, pi is the
esti-mated Bayesian false discovery rate (BFDR) [52]. For
NOISeq, pi is replaced by an equivalent measure of the
significance as proposed by the authors (1−the
probabil-ity of DE) [53]. Afterwards, we used Spearman’s rank
correlation to evaluate the degree of agreement among DE pipelines with respect to gene ranking.
Recovering biological truth
Results from three published studies were used to define the truth. (1) A list of 54 genes with sex-biased expres-sion evidence using microarray data in at least one central nervous system region (passing FDR 1%) were obtained from Trabzuni et al. [25]. The ability of the DE tools to recover these genes was examined by comparing two groups of neuroblastoma samples of the Zhang data: girls (n1= 44) versus boys (n2= 48). (2) MYCN is a bona fide oncogenic transcription factor, activated in high-risk neuroblastoma through high-level gene amplification. A set of 157 MYCN pathway genes was obtained from a microarray study on primary tumors and shRNA model systems [26]. By comparing MYCN amplified (n1 = 20) and MYCN not-amplified neuroblastoma (n2= 20) sam-ples from the Zhang RNA-seq data, the ability of the DE pipelines to recover the 157 MYCN pathway genes was examined. (3) TP53 is the most frequently mutated and best studied gene in cancer. The protein itself is a tran-scription factor regulating a set of genes involved in cell-cycle control and programmed cell death. The consensus between SDE genes (identified by the 25 DE pipelines from analysing the NGP nutlin data at 1% FDR) and the TP53 pathway was examined using a set of 116 TP53 pathway genes obtained from a meta-ana-lysis consensus list [27]. Nutlin-3a liberates TP53 from MDM2-mediated inhibition and hence activates the TP53 transcriptional response pathway.
To come to an overall conclusion, consensus rank-ing of the 25 DE pipelines was established usrank-ing Con-sRank (version 2.0.1) R software package [54]. A detailed description of methods and results is avail-able in Additional file 4.
Non-parametric simulation methods
SimSeq [28] simulates a matrix of RNA-seq read counts by sub-sampling samples from a source RNA-seq data-set. It creates a set of DE genes based on prior informa-tion from analyzing the source dataset (which has a larger number of replicates than the simulated expres-sion data). Details about the method are given in Benidt and Nettleton [28] and in Additional file1: Section 4.1.
that start from the Zhang, NGP nutlin, and GTEx data-sets, respectively). For joint simulation of mRNAs and lncRNAs (for Zhang- and NGP nutlin-based simula-tions), each simulated count matrix includes a number of lncRNAs and mRNAs in the set of true DE genes and non-DE genes, proportional to their numbers in the source dataset (for the Zhang data 70% mRNA and for NGP nutlin data 65% mRNA). We ran 100 independent simulations for each scenario. On each simulated dataset, we applied the 24 DE pipelines and calculatedp values, adjustedpvalues, LFC, and other relevant statis-tics. These statistics were subsequently used for comput-ing the comparative performance metrics.
For a given fraction of true DE genes, the SimSeq method generates data for which it is known which genes are truly DE. To each simulated dataset all DE tools are applied and genes are called SDE if their FDR-adjusted p values are smaller than the nominal FDR level (nominal FDR∈[0, 1]). For a single simulated dataset the observed false discovery proportion (FDP) is calculated asFDP=FP/(FP+TP), whereFPandTPare the numbers of incorrect (false) and correct (true) rejec-tion of the null hypothesis, respectively. The actual false discovery rate (FDR) is then computed as the average of the FDPs over all simulations. When the FDR is com-puted for a scenario with no DE genes at all, it is gener-ally known as the false positive rate (FPR). For this scenario, the SimSeq procedure simply samples repli-cates from only one group of the source dataset and ran-domly assigns the samples to one of two arbitrary mock groups. The actual true positive rate (TPR), which is also called sensitivity, is defined as the average of the true positive proportions (TPP) across independent simula-tions,TPP=TP/(TP+FN), where FNis the number of incorrect decisions to fail rejecting the null hypothesis.
To demonstrate the importance of pre-processing of samples in reducing the intra-group variability (and hence improve the performance of DE tools), we ran an extra simulation that starts from the Zhang data (which contains the most variable samples) by filtering a set of outlying samples beforehand. We particularly used prin-cipal component analysis to identify such samples. After excluding the top 10% most extreme samples (in a two-dimensional space formed by the first two principal components) we applied the non-parametric simulation procedure on the remaining samples. Details can be found in Additional file1: Section 4.2.3.
The quality of simulated data was examined using the quality metrics proposed by Soneson and Robinson [29] as implemented by their countsimQC R package (ver-sion 0.5.2). The metrics evaluate the average expres(ver-sions of genes, variability, mean-variance relationship, correla-tions among replicates, correlacorrela-tions among genes, and fraction of zero counts. The quality assessments were
positive in all aspects, and the reports generated by the countsimQC R package can be found in Additional file 5A. In addition, the representativeness of the simulated mRNA and lncRNA expression data is further explored using similar quality metrics (see Additional file5B).
Web application
A web application has been developed using the R Shiny package (version 1.0.5) [55]. This user interface allows the user to consult and visualize all detailed results from the simulation studies. It can be accessed at [35].
Additional files
Additional file 1:Supplementary figures and methods. Figures and tables that are directly referenced in the main report. Review of previous comparative studies and additional descriptions of results and methods. (PDF 2971 kb)
Additional file 2:Supplementary data. Detailed results of comparisons of normalization methods. (HTML 2067 kb)
Additional file 3:Supplementary data. Detailed results of concordance analysis of DE tools. (HTML 15901 kb)
Additional file 4:Supplementary data. Detailed results from the study of DE tools’recovering ability of biological truth. (HTML 2102 kb)
Additional file 5:Supplementary data (A and B). Results of simulation quality assessment. (ZIP 8405 kb)
Abbreviations
AZA:Azacitidine; BCV: Biological coefficient of variation; CRC: Colorectal cancer; DGE: Differential gene expression; DE: Differential expression; EB: Empirical Bayes; FDR: False discovery rate; FDP: False discovery proportion; FPR: False positive rate; GEO: Gene Expression Omnibus; GLM: Generalized linear modeling; GTEx: Genotype-Tissue Expression; LFC: Log fold change; lncRNA: Long non-coding RNA; mRNA: Messenger RNA; NB: Negative binomial; QL: Quasi-likelihood; QN: Quantile normalization; QW: Quality weight; RNA: Ribonucleic acid; SDE: Significantly differentially expressed; STN: Signal-to-noise; TMM: Trimmed means of M values; TPR: True positive rate; VST: Variance stabilizing transformation
Acknowledgements
We are grateful to Janssen Pharmaceutica (Belgium) for providing the cell line CRC AZA RNA-seq data. We are also grateful to Matthias Fischer for providing the raw Zhang data, Steve Lefever for creating Fig.1(the general work-flow of this study).
Funding
This study was sponsored by a UGent Special Research Fund Concerted Research Actions (GOA grant number BOF16-GOA-023).
Availability of data and materials
The RNA-seq data sets used in this study can be accessed from GEO repository [38] with accession numbers GSE49711 (for Zhang data [36]), GSE104756 (for NGP nutlin-3 data), GSE20895 (for the Hammer data [39]), and GSE26024 (for the Bottomly data [40]). The GTEx data can be accessed from the GTEx project repository [41]. The processed data and sample annotation of the CRC AZA data can be accessed in Additional file 6 [42]. Source codes used for data analysis are located on GitHub ( https://github.com/CenterForStatistics-UGent/Additional-File-6.git) and zenodo (https://doi.org/10.5281/zenodo.1283157) [42].
Authors’contributions
Ethics approval This is not applicable.
Competing interests
The authors declare that they have no competing interests.
Publisher’s Note
Springer Nature remains neutral with regard to jurisdictional claims in published maps and institutional affiliations.
Author details
1
Department of Data Analysis and Mathematical Modeling, Ghent University, Ghent, Belgium.2National Institute for Applied Statistics Research, University
of Wollongong, Wollongong, Australia.3Department of Pediatrics and
Medical Genetics, Ghent University, Ghent, Belgium.4Global Advanced
Analytics Group, Bain & Company Belgium, Inc., Brussels, Belgium.
Received: 13 November 2017 Accepted: 19 June 2018
References
1. Derrien T, Johnson R, Bussotti G, Tanzer A, Djebali S, Tilgner H, Guernec G, Martin D, Merkel A, Knowles DG, et al. The GENCODE v7 catalog of human long non-coding RNAs: analysis of their gene structure, evolution, and expression. Genome Res. 2012;22(9):1775–89.
2. Volders PJ, Helsens K, Wang X, Menten B, Martens L, Gevaert K,
Vandesompele J, Mestdagh P. LNCipedia: a database for annotated human lncRNA transcript sequences and structures. Nucleic Acids Res. 2013;41(D1): 246–51.
3. Maass PG, Luft FC, Bähring S. Long non-coding RNA in health and disease. J Mol Med. 2014;92(4):337–46.https://doi.org/10.1007/s00109-014-1131-8 4. Wallaert A, Durinck K, Van Loocke W, Van de Walle I, Matthijssens F, Volders
PJ, Avila Cobos F, Rombaut D, Rondou P, Mestdagh P, et al. Long noncoding RNA signatures define oncogenic subtypes in T-cell acute lymphoblastic leukemia. Leukemia. 2016;30(9):1927.
5. Gutschner T, Diederichs S. The hallmarks of cancer: a long non-coding RNA point of view. RNA Biol. 2012;9(6):703–19.
6. Wang Z, Gerstein M, Snyder M. RNA-seq: a revolutionary tool for transcriptomics. Nat Rev Genet. 2009;10(1):57–63.
7. Tsoi LC, Iyer MK, Stuart PE, Swindell WR, Gudjonsson JE, Tejasvi T, Sarkar MK, Li B, Ding J, Voorhees JJ, et al. Analysis of long non-coding RNAs highlights tissue-specific expression patterns and epigenetic profiles in normal and psoriatic skin. Genome Biol. 2015;16(1):1.
8. Kornienko AE, Dotter CP, Guenzl PM, Gisslinger H, Gisslinger B, Cleary C, Kralovics R, Pauler FM, Barlow DP. Long non-coding RNAs display higher natural expression variation than protein-coding genes in healthy humans. Genome Biol. 2016;17(1):14.
9. Ren H, Wang G, Chen L, Jiang J, Liu L, Li N, Zhao J, Sun X, Zhou P. Genome-wide analysis of long non-coding RNAs at early stage of skin pigmentation in goats (Capra hircus). BMC Genomics. 2016;17(1):1.
10. Love MI, Huber W, Anders S. Moderated estimation of fold change and dispersion for RNA-seq data with DESeq2. Genome Biol. 2014;15(550) https://doi.org/10.1186/s13059-014-0550-8
11. Raithel S, Johnson L, Galliart M, Brown S, Shelton J, Herndon N, Bello NM. Inferential considerations for low-count RNA-seq transcripts: a case study on the dominant prairie grass andropogon gerardii. BMC Genomics. 2016;17(1):140. 12. R Development Core Team. R: a language and environment for statistical
computing. Vienna: R Foundation for Statistical Computing; 2008. ISBN 3-900051-07-0.http://www.R-project.org
13. Rapaport F, Khanin R, Liang Y, Pirun M, Krek A, Zumbo P, Mason CE, Socci ND, Betel D. Comprehensive evaluation of differential gene expression analysis methods for RNA-seq data. Genome Biol. 2013;14(9):1. 14. Soneson C, Delorenzi M. A comparison of methods for differential
expression analysis of RNA-seq data. BMC Bioinformatics. 2013;14(1):1. 15. Schurch NJ, Schofield P, Gierliński M, et al. How many biological replicates
are needed in an RNA-seq experiment and which differential expression tool should you use? RNA. 2016;22(6):839-51.https://doi.org/10.1261/rna. 053959.115.
16. Bullard JH, Purdom E, Hansen KD, Dudoit S. Evaluation of statistical methods for normalization and differential expression in mRNA-seq experiments. BMC Bioinformatics. 2010;11(1):94.
17. Seyednasrollah F, Laiho A, Elo LL. Comparison of software packages for detecting differential expression in RNA-seq studies. Brief Bioinform. 2015;16(1):59–70. 18. Sahraeian SM, Mohiyuddin M, Sebra R, Tilgner H, Afshar PT, Au KF, Asadi NB,
Gerstein MB, Wong WH, Snyder MP, Schadt E. Gaining comprehensive biological insight into the transcriptome by performing a broad-spectrum RNA-seq analysis. Nat Commun. 2017;8(1):59.
19. Li J, Tibshirani R. Finding consistent patterns: a nonparametric approach for identifying differential expression in RNA-seq data. Stat Methods Med Res. 2013;22(5):519–36.
20. Dillies MA, Rau A, Aubert J, Hennequet-Antier C, Jeanmougin M, Servant N, Keime C, Marot G, Castel D, Estelle J, et al. A comprehensive evaluation of normalization methods for illumina high-throughput RNA sequencing data analysis. Brief Bioinform. 2013;14(6):671–83.
21. Zyprych-Walczak J, Szabelska A, Handschuh L, Górczak K, Klamecka K, Figlerowicz M, et al. The impact of normalization methods on RNA-seq data analysis. BioMed Res Int. 2015;2015:1–10.https://doi.org/10.1155/2015/ 621690.
22. Lin Y, Golovnina K, Chen ZX, Lee HN, Negron YLS, Sultana H, Oliver B, Harbison ST. Comparison of normalization and differential expression analyses using RNA-seq data from 726 individual Drosophila melanogaster. BMC Genomics. 2016;17(1):1.
23. Subramanian A, Tamayo P, Mootha VK, Mukherjee S, Ebert BL, Gillette MA, Paulovich A, Pomeroy SL, Golub TR, Lander ES, et al. Gene set enrichment analysis: a knowledge-based approach for interpreting genome-wide expression profiles. Proc Natl Acad Sci U S A. 2005;102(43):15545–50. 24. Xiao Y, Hsiao TH, Suresh U, Chen HI, Wu X, Wolf SE, Chen Y. A novel significance
score for gene selection and ranking. Bioinformatics. 2012;30(6):801–7. 25. Trabzuni D, Ramasamy A, Imran S, Walker R, Smith C, Weale ME, Hardy J, Ryten
M, Consortium NABE, et al. Widespread sex differences in gene expression and splicing in the adult human brain. Nat Commun. 2013;4:2771.
26. Valentijn LJ, Koster J, Haneveld F, Aissa RA, van Sluis P, Broekmans ME, Molenaar JJ, van Nes J, Versteeg R. Functional MYCN signature predicts outcome of neuroblastoma irrespective of MYCN amplification. Proc Natl Acad Sci U S A. 2012;109(47):19190–5.
27. Fischer M. Census and evaluation of p53 target genes. Oncogene. 2017; 36(28):3943.
28. Benidt S, Nettleton D. SimSeq: a nonparametric approach to simulation of RNA-sequence datasets. Bioinformatics. 2015;31(13):2131–40.
29. Soneson C, Robinson MD. Towards unified quality verification of synthetic count data with countsimQC. Bioinformatics. 2017;34(4):691–92.https://doi. org/10.1093/bioinformatics/btx631.
30. Liu R, Holik AZ, Su S, Jansz N, Chen K, San Leong H, Blewitt ME, Asselin-Labat ML, Smyth GK, Ritchie ME. Why weight? Modelling sample and observational level variability improves power in RNA-seq analyses. Nucleic Acids Res. 2015;43(15):97.
31. Benjamini Y, Hochberg Y. Controlling the false discovery rate: a practical and powerful approach to multiple testing. J R Stat Soc Ser B Methodol. 1995:289–300.http://www.jstor.org/stable/2346101.
32. Robinson MD, McCarthy DJ, Smyth GK. edgeR: a Bioconductor package for differential expression analysis of digital gene expression data.
Bioinformatics. 2010;26(1):139–40.
33. Ritchie ME, Phipson B, Wu D, Hu Y, Law CW, Shi W, Smyth GK. limma powers differential expression analyses for RNA-sequencing and microarray studies. Nucleic Acids Res. 2015;43(7):47.
34. Lund SP, Nettleton D, McCarthy DJ, Smyth GK, et al. Detecting differential expression in RNA-sequence data using quasi-likelihood with shrunken dispersion estimates. Stat Appl Genet Mol Biol. 2012;11(5):8.
35. Interactive Shiny Application for Comprehensive Exploration of Simulation Results.http://statapps.ugent.be/tools/AppDGE/.
36. Zhang W, Yu Y, Hertwig F, Thierry-Mieg J, Zhang W, Thierry-Mieg D, Wang J, Furlanello C, Devanarayan V, Cheng J, et al. Comparison of RNA-seq and microarray-based models for clinical endpoint prediction. Genome Biol. 2015;16(133)https://doi.org/10.1186/s13059-015-0694-1
37. Bray N, Pimentel H, Melsted P, Pachter L. Near-optimal probabilistic RNA-seq quantification. Nat Biotechnol. 2016;34:525–7.
38. Edgar R, Domrachev M, Lash AE. Gene Expression Omnibus: NCBI gene expression and hybridization array data repository. Nucleic Acids Res. 2002; 30(1):207–10.
Genome Res. 2010;20:847–60.https://doi.org/10.1101/gr.101204.109.http:// genome.cshlp.org/content/20/6/847.abstract
40. Bottomly D, Walter NA, Hunter JE, Darakjian P, Kawane S, Buck KJ, Searles RP, Mooney M, McWeeney SK, Hitzemann R. Evaluating gene expression in C57BL/ 6J and DBA/2J mouse striatum using RNA-Seq and microarrays. Public Library of Science. 2011;https://doi.org/10.1371/journal.pone.0017820.
41. Consortium G. The Genotype-Tissue Expression (GTEx) project. 2013. https:// www.gtexportal.org/home/. Accessed 09 Jan 2015. http://dx.doi.org/10. 1038/ng.2653
42. Assefa AT. CenterForStatistics-UGent/Additional file 6: source code. 2018. https://doi.org/10.5281/zenodo.1283157.
43. Bolstad BM, Irizarry RA, Åstrand M, Speed TP. A comparison of normalization methods for high density oligonucleotide array data based on variance and bias. Bioinformatics. 2003;19(2):185–93.
44. Robinson MD, Oshlack A. A scaling normalization method for differential expression analysis of RNA-seq data. Genome Biol. 2010;11(3):1.
45. Anders S, Huber W. Differential expression analysis for sequence count data. Genome Biol. 2010;11:106.https://doi.org/10.1186/gb-2010-11-10-r106 46. Li J, Witten DM, Johnstone IM, Tibshirani R. Normalization, testing, and false
discovery rate estimation for RNA-sequencing data. Biostatistics. 2012;13(3): 523–38.
47. Robinson MD, Smyth GK. Small-sample estimation of negative binomial dispersion, with applications to SAGE data. Biostatistics. 2008;9(2):321–32. 48. McCarthy DJ, Chen Y, Smyth GK. Differential expression analysis of
multifactor RNA-seq experiments with respect to biological variation. Nucleic Acids Res. 2012;40(10):4288–97.https://doi.org/10.1093/nar/gks042. 49. Zhou X, Lindsay H, Robinson MD. Robustly detecting differential expression
in RNA sequencing data using observation weights. Nucleic Acids Res. 2014; 42 (11):91–1.
50. Lun AT, Chen Y, Smyth GK. It’s DE-licious: a recipe for differential expression analyses of RNA-seq experiments using quasi-likelihood methods in edger. In Statistical Genomics. New York: Humana Press; 2016. pp. 391–416. 51. Law CW, Chen Y, Shi W, Smyth GK. Voom: precision weights unlock linear
model analysis tools for RNA-seq read counts. Genome Biol. 2014;15(2):29. 52. Hardcastle TJ, Kelly KA. baySeq: empirical bayesian methods for identifying
differential expression in sequence count data. BMC Bioinformatics. 2010;11(1):422. 53. Tarazona S, Furió-Tar P, Turrà D, Pietro AD, Nueda MJ, Ferrer A, Conesa A.
Data quality aware analysis of differential expression in rna-seq with noiseq r/bioc package. Nucleic Acids Res. 2015;43(21):140.
54. Chermak E, Petta A, Serra L, Vangone A, Scarano V, Cavallo L, Oliva R. CONSRANK: a server for the analysis, comparison and ranking of docking models based on inter-residue contacts. Bioinformatics. 2014;31(9):1481–3. 55. Chang W, Cheng J, Allaire J, Xie Y, McPherson J. Shiny: Web Application