Copyright © 2004, American Society for Microbiology. All Rights Reserved.
Verification of an Assay for Quantification of Hepatitis C Virus RNA
by Use of an Analyte-Specific Reagent and Two Different
Extraction Methods
Michael S. Forman and Alexandra Valsamakis*
The Johns Hopkins Medical Institutions, Division of Microbiology, Baltimore, Maryland
Received 25 March 2004/Returned for modification 4 May 2004/Accepted 11 May 2004
Protocols were designed for quantification and detection of hepatitis C virus (HCV) RNA by the use of an analyte-specific reagent (ASR) (Roche COBAS TaqMan48 [CTM48] HCV) after manual and automated RNA extraction. The purposes were to determine (i) assay performance characteristics using manual and automated RNA extraction methods, (ii) whether measurable range and limit of detection (LOD) of the ASR assay were influenced by genotype, and (iii) correlation of quantification by CTM48 HCV ASR and COBAS Monitor HCV v. 2.0. For HCV genotype 1 (Gt1), the lower limits of quantification after manual extraction were slightly lower
than those for automated extraction (1.0 versus 1.5 log10 IU/ml). Results were linear up to the highest
concentration tested after extraction by both methods (manual, 6.1 log10; automated, 6.4 log10). Similar results
were obtained for Gt2 (1.8 to 6.8 log10IU/ml) and Gt3 (1.6 to 6.8 log10IU/ml) after automated extraction. The
LOD of Gt1 virus was 10 IU/ml after manual extraction and between 25 and 37.5 IU/ml after automated extraction. Results with Gt2 and Gt3 viruses were similar after automated extraction (Gt2, between 25 and 50 IU/ml; Gt3, 25 IU/ml). Variability (intrarun and interrun, at concentrations throughout the range of
quanti-fication) was<13% for both extraction methods. Clinical specimens tested by Monitor were quantified using
the CTM48 HCV ASR assay. Characteristics of the regression line included a slope of 0.98 andyintercept of
ⴚ0.23. Quantification by the two methods was correlated (rⴝ0.97). CTM48 HCV ASR assay values were on
average twofold lower than those for Monitor HCV v. 2.0. These data suggest that our assay combines the characteristics of qualitative and quantitative PCR platforms into a single test.
Hepatitis C Virus (HCV) was identified by molecular meth-ods in 1989, and culture assays for detection are still not avail-able. Diagnosis of chronic HCV infection and monitoring for efficacy of therapy are performed with molecular assays for detection and quantification of HCV RNA. Qualitative and quantitative assays have been developed, and each test format has a different utility. The low limit of detection (LOD) of qualitative assays makes these tests suitable for diagnosis of chronic or acute infection and assessment of virus clearance after treatment. Viral load determination with quantitative assays is used prior to treatment to establish a baseline level of viremia and can be used (in combination with genotype) to predict likelihood of response (2, 3, 5). During treatment, viral load testing is useful in predicting the outcome of continued therapy (2).
Most laboratorians have become familiar with qualitative and quantitative molecular assays for HCV. However, health care practitioners often request these tests inappropriately and fail to interpret results correctly, in part due to an incomplete understanding of the performance characteristics and the util-ity of different assay formats. The potential for mismanage-ment of patients exists in this setting.
In response, many laboratories have implemented diagnostic and therapeutic algorithms. In a typical diagnostic algorithm, a qualitative assay is performed to ascertain a diagnosis of
chronic HCV infection. If the result is positive, the specimen is then tested by a quantitative assay to determine baseline viral load. In therapeutic algorithms, a quantitative test is per-formed to assess viral load during treatment. If no HCV RNA is detected, a qualitative assay is performed to assess whether viral clearance has occurred.
Algorithms have been effective for clinicians, but they are cumbersome for laboratories that must also offer individual tests. Laboratories that offer algorithms must implement a system for storage and tracking of specimens and results to ensure that the correct tests are performed in a timely manner. However, the potential for errors exists, even with an optimally designed system.
The development of a single test platform that combines the performance characteristics of qualitative and quantitative as-says would greatly simplify HCV diagnostics for health care practitioners and clinical laboratories. The advent of quantita-tive PCRs in which amplification and detection occurs simul-taneously (real-time PCR) offers a potential solution. The broad measurable range and increased sensitivity of real-time PCR make it an ideal platform for the consolidation of HCV molecular assay platforms.
We have investigated the performance of the Roche CO-BAS TaqMan48 (CTM48) HCV analyte-specific reagent (ASR) for the detection and quantification of HCV RNA in plasma. These reagents utilize TaqMan chemistry to amplify and detect sequences in the 5⬘ untranslated region (UTR) of HCV. The aim of this study was (i) to determine the measur-able range, LOD, and precision of quantification of HCV Gt1 after extraction by manual column and automated
instrumen-* Corresponding author. Mailing address: Division of Microbiology, The Johns Hopkins Medical Institutions, Meyer B1-193, 600 North Wolfe St., Baltimore, MD 21287-7093. Phone: (410) 955-5077. Fax: (410) 614-8087. E-mail: [email protected].
3581
on May 15, 2020 by guest
http://jcm.asm.org/
tation, (ii) to determine whether genotype bias occurred by comparing the LOD and measurable range of quantification of Gt1, -2, and -3 viruses after RNA extraction by automated instrumentation, and (iii) to determine the correlation of quan-tification by Monitor HCV v. 2.0 and our CTM48 HCV ASR assay using patient specimens.
MATERIALS AND METHODS
Viruses and clinical specimens.Viruses for instrument calibration and ana-lytical performance studies (measurable range, LOD, and precision) were ob-tained from AcroMetrix (Benicia, Calif.) and Teragenix (Ft. Lauderdale, Fla.), respectively. Six virus preparations of a Gt1 virus were used to calibrate the assay (6.7, 5.7, 4.7, 3.7, 2.7, and 1.7 log10IU/ml). The calibration panel members were
manufactured by serially diluting (10-fold) the panel member with the highest concentration.
Accuracy of HCV quantification can vary widely due to a number of reasons, including variability in testing proficiency by individual laboratories and the lack of a “gold standard” method for quantification. Therefore, viruses were requan-tified using the method employed by the manufacturer to verify the stated concentrations (Monitor HCV v. 2.0 for quantifiable calibrators and Teragenix Gt3 virus; COBAS Taqman HCV ASR for Teragenix Gt1 and Gt2 viruses). New values were assigned if the concentration observed after requantification differed from the expected value by a factor of 1.5-fold or greater. Viruses were diluted in defibrinated human plasma (Boston Biomedica, Inc., West Bridgewater, Mass.) for measurable range and LOD experiments. For LOD determinations, viruses were diluted to 100 IU/ml (in 10-fold increments) and then further diluted to 50, 37.5 (for Gt1 automated extraction only), 25, 10, and 5 IU/ml. A sufficient volume of each dilution was prepared to allow extraction of 20 repli-cates per extraction method.
Plasma samples that had been previously tested by Monitor HCV v. 2.0 were extracted and tested with the CTM48 HCV ASR assay. Specimens with concen-trations greater than Monitor’s upper limit of quantification (5.7 log10IU/ml)
were diluted 100-fold and retested by Monitor HCV v. 2.0. Samples were not tested simultaneously on both platforms but were frozen at⫺70°C until CTM48 HCV ASR testing. These studies were performed following guidelines for human subject experimentation. Approval was received from the Johns Hopkins Med-icine Institutional Review Board to conduct these experiments.
RNA extraction methods.HCV RNA was extracted by an automated method (MagAttract viral RNA M48 reagents on a BioRobot M48 instrument; QIA-GEN, Valencia, Calif.) and a manual method (QIAamp MinElute virus vacuum kit; QIAGEN). Plasma input and elution volumes for the automated method were 300 and 65l, respectively, as per the manufacturer’s recommendations.
For manual extraction, the manufacturer’s protocol was followed with two exceptions: the protease was rehydrated in distilled water instead of the supplied protease resuspension buffer, and carrier RNA was reconstituted in AVE buffer to which quantitative standard reagent (QS) was added. Plasma input and elution volumes were 500 and 60l, respectively. For each extraction method, QS was added to each sample such that the final concentration after elution was approx-imately 1,100 copies in 50l of eluate.
QS contains a synthetic virus (“armored RNA”) comprised of MS2 bacterio-phage bearing RNA sequences complementary to the primers used to amplify HCV and an intervening unique sequence that is used to detect QS during the real-time PCR. QS is used to correct for the presence of reaction inhibitors and other variables that can affect the efficiency of real-time reverse transcription-PCRs. QS was added to the lysis buffer to prevent degradation of the armored RNA.
HCV RNA amplification and detection.The Monitor HCV v. 2.0 test was performed according to the manufacturer’s instructions. For the CTM48 HCV assay, working Master Mix was prepared by combining manganese (170l) and ASR Master Mix reagents (1.4 ml). Master Mix contains deoxynucleoside triphosphates, oligonucleotide primers (upstream and downstream) containing sequences from the HCV 5⬘UTR, fluorescent-labeled probes (complementary to 5⬘UTR and QS-specific sequences), Z05 polymerase (thermostable polymerase with reverse transcriptase activity), and uracil-N-glycosylase (to prevent ampli-fication of contaminants from previous reactions). The working Master Mix (50 l) was added to each K-tube in the K-Carrier, followed by 50l of test sample. The K-Carrier was placed in the CTM48 instrument for reverse transcription, amplification, and detection. The HCV PCR profile used for amplification is shown in Table 1. Results from the six virus preparations used for calibration (1.7 to 6.7 log10IU/ml in 10-fold increments, four to six replicates per concentration)
were imported into ASR external calibration software v. 2.1 to derive the three
coefficients that defined the calibration curve for each ASR lot. Data from a minimum of three replicates at each concentration were used to derive the three calibration coefficients. Calibrator data that caused the standard deviation of the QS crossing threshold to exceed 0.5 were excluded from the coefficient calcula-tion. Quantification was performed in subsequent runs by loading the calibration coefficients into the CTM48 instrument software (AmpliLink v. 3.0.1). The cal-ibration coefficients are specific to each ASR lot, therefore the calcal-ibration pro-tocol was repeated and new coefficients were calculated for each new lot of ASR reagents.
Design of analytical performance and correlation experiments. (i) Measurable range.The measurable range of quantification using the CTM48 ASR reagents was determined by testing undiluted viruses (representing maximum concentra-tions) and serial dilutions of virus stocks. In experiments using automated RNA extraction, the starting concentrations of viruses were 6.7 (Gt1), 6.8 (Gt2), and 6.2 (Gt3) log10IU/ml. The number of replicates tested at each concentration was
10 for Gt1 and 5 for Gt2 and -3. In manual extraction experiments, the starting concentration of virus (Gt1) was 6.1 log10IU/ml, and 10 replicates were tested at
each dilution. The criteria of linearity and acceptable variability (standard devi-ation,ⱕ0.4) were used to define the upper and lower limits of quantification.
(ii) LOD.To determine the LOD, viruses were serially diluted to concentra-tions ranging from 50 to 5 IU/ml. Twenty replicates were tested at each concen-tration, except for Gt1 at 5 IU/ml extracted by the automated method (n⫽10) and Gt3 at 50 IU/ml (n⫽5). The LOD was defined as the concentration at which 95% of replicates were detected (7).
(iii) Precision.Precision of the CTM48 ASR assay after automated and man-ual extraction was assessed using a Gt1 virus at 2.0, 4.0, and 6.0 log10IU/ml. For
intra-assay precision, 20 replicates were tested at each concentration. To calcu-late interassay precision, 10 additional replicates were tested on two additional runs performed on two separate days, and the data were combined with the initial run of 20 replicates.
(iv) Correlation between quantification using COBAS Monitor v. 2.0 and CTM48 HCV ASR.To assess whether quantification by the real-time PCR ASR and quantitative conventional PCR methods correlated, 106 specimens that had been quantified by COBAS Monitor HCV v. 2.0 were quantified using the CTM48 HCV ASR assay. Specimens throughout the range of quantification were chosen for analysis. Data were logarithmically transformed prior to analysis. The distribution of genotypes was as follows: Gt1,n⫽76; Gt2,n⫽8; Gt3,n⫽6; Gt4, n⫽1. Genotypes were determined by direct sequencing of core-E1 sequences (1) or Versant HCV genotyping assay (LiPA; Bayer, Tarrytown, N.Y.). Genotype could not be determined for 15 specimens.
Statistical Methods.Regression lines and their characteristics were deter-mined using Microsoft Excel (Microsoft Office 2001; Microsoft Corp., Redmond, Wash.).
RESULTS
Measurable range using CTM48 HCV ASR.The measurable
[image:2.603.302.542.79.219.2]range of the CTM48 HCV ASR assay after automated extrac-tion was determined for the three HCV genotypes (Gt1, -2, and -3) that are most prevalent in our patient population. Measurable ranges, as log10(IU/ml), were 1.5 toⱖ6.4 for Gt1
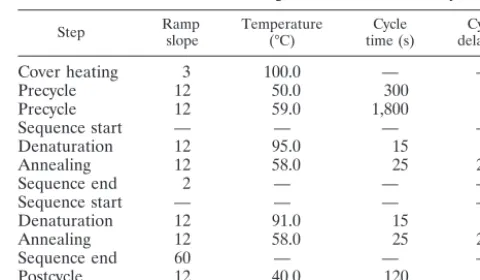
TABLE 1. Instrument settings for CTM48 ASR assaya
Step Rampslope Temperature(°C) time (s)Cycle delay (s)Cycle
Cover heating 3 100.0 — —
Precycle 12 50.0 300 0
Precycle 12 59.0 1,800 0
Sequence start — — — —
Denaturation 12 95.0 15 0
Annealing 12 58.0 25 25
Sequence end 2 — — —
Sequence start — — — —
Denaturation 12 91.0 15 0
Annealing 12 58.0 25 25
Sequence end 60 — — —
Postcycle 12 40.0 120 0
a—, program step with no required parameter.
3582 FORMAN AND VALSAMAKIS J. CLIN. MICROBIOL.
on May 15, 2020 by guest
http://jcm.asm.org/
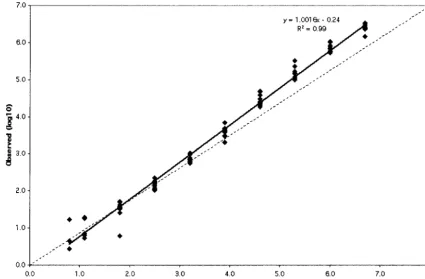
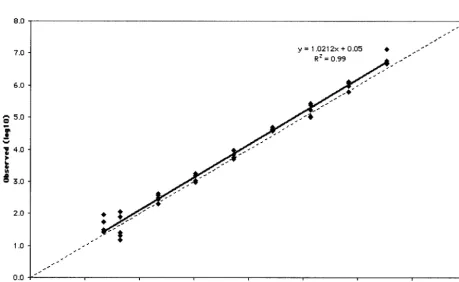
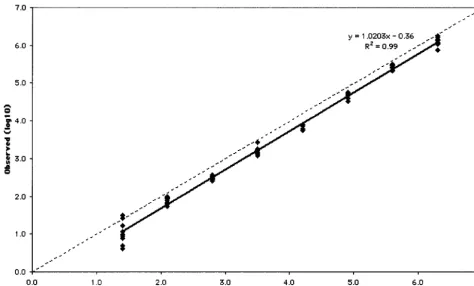
(Fig. 1), 1.8 toⱖ6.8 for Gt2 (Fig. 2), and 1.6 toⱖ6.8 for Gt3 (Fig. 3). Some replicates were not detected at the lowest con-centrations of Gt1 (0.8 and 1.1 log10IU/ml), Gt2 (0.9 and 1.2
log10 IU/ml), and Gt3 (1.3 log10IU/ml). As a result, these
concentrations failed to meet the criterion of acceptable vari-ability used to define the limits of quantification. The lower limit of quantification after manual extraction of Gt1 (1.0 log10
IU/ml) was less than that observed after automated extraction (1.5 log10IU/ml), and quantification was linear up to the
high-est concentration of virus thigh-ested (6.1 log10IU/ml; Fig. 4).
LODs for HCV Gt1, -2, and -3 using CTM48 ASR.For all
three genotypes, 100% of replicates were detected at 50 IU/ml (Table 2). For Gt1, after automated extraction all replicates were detected at 37.5 IU/ml and 90% of replicates were de-tected at 25 IU/ml, suggesting that the LOD was between 25 and 37.5 IU/ml. For Gt2, 80% of replicates were detected at 25 IU/ml and 100% of replicates were detected at 50 IU/ml, suggesting that the LOD was between 25 and 50 IU/ml (Table 2). For Gt3, 95% of replicates were detected at 25 IU/ml. After manual extraction, the LOD of Gt1 was 10 IU/ml, compared to 25 to 37.5 IU/ml for the automated platform (Table 2).
Precision of the CTM48 HCV ASR assay.Precision with the
automated and manual extraction methods was determined (Table 3). The data demonstrate that interassay and intra-assay precision after extraction by both methods were similar, although at 2.0 log10IU/ml, interrun variability was greater
than intrarun variability after extraction by automated instru-ment (7 versus 13%; Table 3). Variability was greatest at 2.0 log10IU/ml after extraction by both methods.
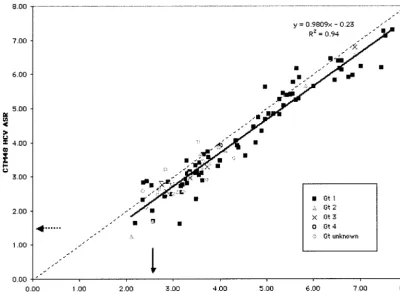
Correlation between quantification using COBAS Monitor
v. 2.0 and CTM48 HCV ASR. The data obtained by the two
assays were linearly related (slope⫽0.98) and correlated (r⫽ 0.97) but not identical (Fig. 5). Values obtained with the CTM48 HCV ASR assay were usually lower than those for Monitor HCV v. 2.0 (slope approaching 1.0, y intercept ⫽ ⫺0.23). Most specimens contained Gt1 HCV. Twelve of the 15 specimens containing viruses other than Gt1 had viral loads ⬍5.0 log10IU/ml by Monitor HCV v. 2.0. An analysis of the
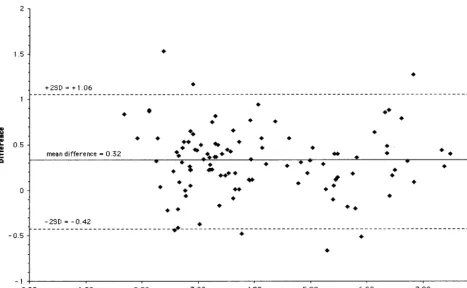
difference between Monitor HCV v. 2.0 and CTM48 HCV ASR assay results (Monitor HCV v. 2.0 log10 IU/ml minus
CTM49 HCV ASR log10IU/ml) demonstrated that almost all
(100 of 106) results fell within two standard deviations from the mean difference (Fig. 6). No bias in relation to concentra-tion was observed.
DISCUSSION
[image:3.603.80.506.71.350.2]One of the major differences between Monitor HCV v. 2.0 and the CTM48 HCV ASR assay is that the latter employs external calibrators rather than an internal quantitative refer-ence standard to measure viral loads. Calibration is performed once, when a new reagent lot is first used. Calibration reagents are therefore critical to the performance of the CTM48 HCV ASR assay. We chose to use calibrators obtained from a com-mercial source because they were well characterized and large supplies were available. Despite their advantages, care should be taken to ascertain that stated viral loads of commercially obtained calibrators are correct.
FIG. 1. Measurable range (IU/ml) of Gt1 quantification after automated RNA extraction. The dashed line indicates theoretical trend line of complete agreement between expected and observed measurements.
on May 15, 2020 by guest
http://jcm.asm.org/
FIG. 2. Measurable range (IU/ml) of Gt2 quantification after automated RNA extraction. The dashed line indicates theoretical trend line of complete agreement between expected and observed measurements.
FIG. 3. Measurable range (IU/ml) of Gt3 quantification after automated RNA extraction. The dashed line indicates theoretical trend line of complete agreement between expected and observed measurements.
3584 FORMAN AND VALSAMAKIS J. CLIN. MICROBIOL.
on May 15, 2020 by guest
http://jcm.asm.org/
[image:4.603.63.523.421.703.2]User-defined calibrators are an alternative to commercial reagents. These are typically residual plasma (typically 2 to 3 ml) or a large-volume specimen from a patient with a high viral load. Each of these two approaches has disadvantages. Name-ly, new calibrators must be extensively recharacterized when residual plasma volumes have been depleted and consent from an institutional human subject review board may be required in order to perform large-volume phlebotomy.
The use of external calibrators raises additional issues. One question is whether it can be assumed that assays performed after calibration meet the same performance standard achieved during calibration. This may not be true, and laboratories should consider quality assurance measures such as tracking crossing thresholds (or elbow values, as designated for the
CTM48 HCV ASR assay) of controls and analyzing individual controls within a run.
A second question is whether quantification is accurate at concentrations greater and less than the assay calibrators. At the low concentrations, our data suggest that quantification is accurate at concentrations two- to fivefold less than the lowest calibrator (50 IU/ml). We could not assess whether the upper limit of quantification exceeded the concentration of the high-est calibrator because the concentrations of virus reagents were equivalent to calibrators. We observed high viral loads in patient specimens (see Fig. 5, with the caveat that these may not be accurate measurements), suggesting the need for accu-rate measurement in this range.
[image:5.603.55.529.69.355.2]Our data demonstrate that our CTM48 ASR assay has a measurable range of at least 5 orders of magnitude, at least
[image:5.603.43.288.586.709.2]FIG. 4. Measurable range (IU/ml) of Gt1 quantification after manual extraction. The dashed line indicates theoretical trend line of complete agreement between expected and observed measurements.
TABLE 2. LODs of CTM48 HCV ASR
Concentration (IU/ml)
% Replicates detected (no. positive/total no. of replicates) with:
Gt1
Gt2b Gt3b
Automated
extraction extractionManual
50 100 (20/20) 100 (20/20) 100 (20/20) 100 (5/5)
37.5 100 (20/20) ND ND ND
25 90 (18/20) 100 (20/20) 80 (16/20) 95 (19/20)
12 NDa ND ND 65 (13/20)
10 60 (12/20) 95 (19/20) ND ND
5 40 (4/10) 80 (16/20) ND ND
aND, not done.
bOnly automated extraction values given for Gt2 and Gt3.
TABLE 3. Precision of CTM48 HCV ASR
Variability (log10) Mean (log10IU/ml)a SDa CV (%)a,b
Intrarun
2.0 1.8/1.8 0.1/0.1 7.0/8.1
4.0 3.7/3.8 0.1/0.1 3.0/2.2
6.0 5.8/6.0 0.1/0.1 2.0/1.5
Interrun
2.0 1.8/1.8 0.2/0.1 13.0/8.1
4.0 3.7/3.9 0.2/0.1 4.0/2.1
6.0 5.8/6.0 0.1/0.1 1.0/1.5
aValues given for automated extraction/manual extraction. bCV, coefficient of variation.
on May 15, 2020 by guest
http://jcm.asm.org/
[image:5.603.303.541.604.706.2]10-fold greater than that of Monitor HCV v. 2.0 (4). An accu-rate determination of the upper limit of quantification will require the use of calibrators with viral loads greater than 7.0 log10IU/ml. Users will need to define such reagents since they
are not currently available commercially.
The potential for genotype-dependent bias in quantification exists, as demonstrated by the decreased efficiency of quanti-fication of non-1 genotypes observed with the first version of HCV Monitor (6). This bias was corrected in Monitor v. 2.0 (4), and we did not observe any evidence of its occurrence in our assay with the CTM48 ASR reagents. The measurable range also appeared to be independent of extraction method, since linearity observed with manual and automated RNA preparation was largely similar.
QS is provided with the CTM48 ASR. In this assay, the QS is used to assess amplification inhibition in individual speci-mens. We found that addition of QS to the lysis buffer during extraction was critical for assay performance. Although the QS is an armored RNA product, it may be subject to nuclease attack in native specimens.
The LODs of our CTM48 HCV ASR assay were lower than those for Monitor HCV v. 2.0 (600 IU/ml) and comparable to those of the conventional qualitative PCR platform COBAS Amplicor HCV v. 2.0 (4). No significant genotype bias was observed after automated HCV RNA extraction. The LOD after manual extraction with the MinElute vacuum manifold protocol was lower than after automated extraction with the BioRobot M48. One explanation for this might be the greater
effective concentration of plasma after manual versus auto-mated extraction (a 1.8-fold increase in concentration after manual compared to automated extraction). It is also possible that the inclusion of protease K in the lysis buffer of the MinElute reagents (not included in MagAttract viral RNA reagent) improves the efficiency of HCV RNA extraction.
Precision throughout the range of quantification was within an acceptable range for a real-time PCR method. Variability in quantification was greatest at low concentrations as expected for a PCR-based amplification method. We expected that pre-cision using an automated extraction instrument would be bet-ter than a manual method, but our data demonstrate that reproducibility was comparable between the two methods.
The major benefit of manual extraction using the MinElute reagents and vacuum manifold setup was an apparent increase in sensitivity and a decrease in the lower limit of quantification of our CTM48 HCV ASR assay. Automated extraction could be implemented for routine testing, given the comparable per-formance characteristics and obvious labor savings. However, extraction with MinElute could be incorporated selectively, to provide an ultrasensitive assay for HCV RNA detection.
[image:6.603.92.493.70.362.2]We chose to determine the correlation between Monitor HCV v. 2.0 and CTM48 HCV ASR using the automated RNA extraction method because we planned to use the latter assay to replace Monitor in routine diagnostic testing. We charac-terized the correlation throughout the range of quantification because many clinicians are now requesting viral load mea-surement (rather than testing with a qualitative HCV RNA
FIG. 5. Correlation between quantification with CTM48 HCV ASR assay and Monitor HCV v. 2.0. Solid arrow, lower limit of quantification for Monitor HCV v. 2.0; dashed arrow, lower limit of quantification for CTM48 HCV ASR. The dashed line indicates the theoretical trend line of complete agreement in quantification between the two assays.
3586 FORMAN AND VALSAMAKIS J. CLIN. MICROBIOL.
on May 15, 2020 by guest
http://jcm.asm.org/
detection assay) for patients receiving therapy. Consequently, viral loads in the range of 2.0 to 4.0 log10 IU/ml are now
commonly observed. Our data demonstrated excellent corre-lation throughout the range of concentrations tested.
Interestingly, CTM48 HCV ASR yielded values (⬃0.2 log10
IU/ml) for Gt1 lower than those with Monitor HCV v. 2.0, as demonstrated by regression analysis results of Gt1 measurable range and quantification correlation of clinical specimens (pri-marily Gt1). Similar bias for Gt2 and -3 was not observed in measurable range experiments. The existence of bias in quan-tification of Gt2 and -3 in clinical samples could not be deter-mined because of the small number of non-1 genotype speci-mens.
The potential sources of variation that could account for quantification differences between the two assays include ex-traction method and assay format (real-time PCR with exter-nal calibrator versus conventioexter-nal PCR with interexter-nal QS). It was recently noted that HCV Monitor v. 2.0 overestimated an international (Gt1) standard concentration by approximately 0.5 log10IU/ml (8). The authors hypothesized that the
discrep-ancy was due to a potential flaw in QS conversion from copies to international units per milliliter, lending support to the possibility that assay format might explain quantification dif-ferences between the two tests. If Monitor v. 2.0 truly overes-timates HCV Gt1 viral load, our data suggest that quantifica-tion by CTM48 HCV ASR may be more accurate.
The advantages of the CTM48 HCV ASR assay include increased throughput (48 positions per CTM versus 24 posi-tions per COBAS instrument) and decreased turnaround time
(⬃3 versus 6 h) compared to COBAS Monitor HCV v. 2.0. In addition, the incorporation of automated RNA extraction should result in substantial labor savings due to decreased hands-on time.
The disadvantages of our CTM48 HCV ASR assay include calibrators, the need to provide our own assay controls (man-ufacturers cannot provide positive and negative controls for ASRs, in accordance with United States Food and Drug Ad-ministration regulation 21 CFR 809.10[e][1][x]), and the need to perform extensive in-house verification. Another potential disadvantage is the need to perform additional quality assur-ance steps (on each run, as described above). One compara-tively smaller concern is that the volume of extracted material is sufficient for only a single round of testing.
Our data suggest that our CTM48 HCV ASR assay has the combined performance characteristics of qualitative and quan-titative platforms. Laboratories that wish to consolidate testing into a single platform must weigh the benefits of streamlining with the added burden of providing quality control and rigor-ously performing quality assurance.
ACKNOWLEDGMENTS
We give many thanks to our colleagues in the Division of Microbi-ology, especially John Ticehurst and Bill Merz, for their suggestions and comments on this work.
ASR materials were provided by Roche Diagnostics Corporation.
REFERENCES
[image:7.603.58.526.68.356.2]1.Corbet, S., J. Bukh, A. Heinsen, and A. Fomsgaard.2003. Hepatitis C virus subtyping by a core-envelope 1-based reverse transcriptase PCR assay with
FIG. 6. Difference in quantification between CTM48 HCV ASR and Monitor HCV v. 2.0 (CTM48 HCV ASR log10IU/ml minus Monitor HCV v. 2.0 log10IU/ml) throughout the range of quantification. Mean, average of CTM48 HCV ASR and Monitor HCV v. 2.0 log10values; SD, standard deviation (0.37).
on May 15, 2020 by guest
http://jcm.asm.org/
sequencing and its use in determining subtype distribution among Danish patients. J. Clin. Microbiol.41:1091–1100.
2.Fried, M. W., M. L. Shiffman, K. R. Reddy, C. Smith, G. Marinos, F. L. Goncales, Jr., D. Haussinger, M. Diago, G. Carosi, D. Dhumeaux, A. Craxi, A. Lin, J. Hoffman, and J. Yu.2002. Peginterferon alfa-2a plus ribavirin for chronic hepatitis C virus infection. N. Engl. J. Med.347:975–982. 3.Hadziyannis, S. J., H. Sette, Jr., T. R. Morgan, V. Balan, M. Diago, P.
Marcellin, G. Ramadori, H. Bodenheimer, Jr., D. Bernstein, M. Rizzetto, S. Zeuzem, P. J. Pockros, A. Lin, and A. M. Ackrill.2004. Peginterferon-alpha2a and ribavirin combination therapy in chronic hepatitis C: a randomized study of treatment duration and ribavirin dose. Ann. Intern. Med.140:346– 355.
4.Lee, S. C., A. Antony, N. Lee, J. Leibow, J. Q. Yang, S. Soviero, K. Gutekunst, and M. Rosenstraus.2000. Improved version 2.0 qualitative and quantitative AMPLICOR reverse transcription-PCR tests for hepatitis C virus RNA:
cal-ibration to international units, enhanced genotype reactivity, and perfor-mance characteristics. J. Clin. Microbiol.38:4171–4179.
5.Manns, M. P., J. G. McHutchison, S. C. Gordon, V. K. Rustgi, M. Shiffman, R. Reindollar, Z. D. Goodman, K. Koury, M. Ling, and J. K. Albrecht.2001. Peginterferon alfa-2b plus ribavirin compared with interferon alfa-2b plus ribavirin for initial treatment of chronic hepatitis C: a randomised trial. Lancet358:958–965.
6.Mellor, J., A. Hawkins, and P. Simmonds.1999. Genotype dependence of hepatitis C virus load measurement in commercially available quantitative assays. J. Clin. Microbiol.37:2525–2532.
7.NCCLS.2003. Quantitative molecular methods for infectious diseases. Ap-proved guideline. NCCLS document MM6-A. NCCLS, Wayne, Pa. 8.Pisani, G., K. Cristiano, M. Wirz, G. M. Bisso, and G. Gentili.2002.
Over-estimation of the hepatitis C virus RNA content of reference preparations by the AMPLICOR HCV monitor test, version 2.0. J. Clin. Microbiol.40:4765– 4767.
3588 FORMAN AND VALSAMAKIS J. CLIN. MICROBIOL.