Copyright © 2003, American Society for Microbiology. All Rights Reserved.
Detection and Identification of
Mycobacterium
Species Isolates
by DNA Microarray
Masao Fukushima,
1,2Kenichi Kakinuma,
1,2Hiroshi Hayashi,
1Hiroko Nagai,
3Kunihiko Ito,
4and Ryuji Kawaguchi
1*
Genomics Research Institute,1Center for Molecular Biology and Cytogenetics,2and Laboratory of Infection and Immunology,3SRL, Inc., 5-6-50 Shinmachi, Hino-shi, Tokyo 191-0002, and Clinical Research Division,
Research Institute of Tuberculosis, Department of Respiratory Disease, Fukujuji Hospital, Japan Anti-Tuberculosis Association, 3-1-24 Matsuyama, Kiyose-shi, Tokyo 204-8533,4Japan
Received 12 July 2002/Returned for modification 3 October 2002/Accepted 13 February 2003
Rapid identification ofMycobacterium species isolates is necessary for the effective management of
tuber-culosis. Recently, analysis of DNA gyrase B subunit (gyrB) genes has been identified as a suitable means for
the identification of bacterial species. We describe a microarray assay based ongyrBgene sequences that can
be used for the identification ofMycobacteriaspecies. Primers specific for agyrBgene region common to all
mycobacteria were synthesized and used for PCR amplification of DNA purified from clinical samples. A set
of oligonucleotide probes for specificgyrBgene regions was developed for the identification of 14Mycobacterium
species. Each probe was spotted onto a silylated glass slide with an arrayer and used for hybridization with fluorescently labeled RNA derived from amplified sample DNA to yield a pattern of positive spots. This microarray produced unique hybridization patterns for each species of mycobacteria and could differentiate closely related bacterial species. Moreover, the results corresponded well with those obtained by the
conven-tional culture method for the detection of mycobacteria. We conclude that agyrB-based microarray can rapidly
detect and identify closely related mycobacterial species and may be useful in the diagnosis and effective management of tuberculosis.
Tuberculosis is a disease with worldwide significance (7). Effective treatment of tuberculosis requires the rapid detection
and identification ofMycobacterium tuberculosis. Culture of the
isolates is the traditional method used to confirm a diagnosis of
tuberculosis, but culture is time-consuming becauseM.
tuber-culosis isolates can take 4 to 8 weeks to grow in culture. A diagnosis can also be made by biochemical or immunological testing, but this can take even longer. Direct staining and microscopic examination of clinical specimens can produce results more quickly, but this methodology lacks sensitivity and specificity.
On the other hand, the AccuProbe system (Gen-Probe, San Diego, Calif.) has been the “gold standard” among the com-mercial systems that identify mycobacteria by means of DNA probes. However, hybridization with the AccuProbe system that was commercially available at that time was found to fail with a number of strains displaying the phenotypic features of
the speciesMycobacterium kansasii(34, 41).
PCR, which permits the amplification of specific DNA se-quences and multiplies even a single copy of a given DNA
sequence by a factor of 1012(31), has been applied to various
fields of diagnosis and has proved to be a most useful tool for the rapid diagnosis of infectious diseases (13, 20, 28). PCR has been used to analyze various mycobacterial genes for diagnos-tic purposes, including 16S and 23S rRNA genes, genus- and species-specific fragments in the chromosome (8, 11, 16, 26), genes coding for the 65-kDa heat shock protein (2, 15, 24) and
the 38-kDa protein B antigen (38), the dnaJ gene (39), and
insertion sequences such as IS6110 (9, 14, 30, 37, 40). 16S
rRNA has been reported to be a suitable target for use in PCR
amplification assays for the detection ofMycobacteriumspp. in
a variety of clinical samples (21) and has frequently been used to identify various specific microorganisms because 16S rRNA genes show species-specific polymorphisms (5, 18, 22, 25). However, because of the extremely slow speed of the molecu-lar evolution of 16S rRNA, the number of substituted bases between the 16S rRNA genes of closely related bacterial
strains, such as those belonging to theM. tuberculosiscomplex,
is either nonexistent or too small to differentiate between these species.
As an alternative to 16S rRNA analysis, Yamamoto and Harayama (44, 45, 46) designed a set of PCR primers that
allowed both the amplification of thegyrBgene, which encodes
the subunit B protein of DNA gyrase (topoisomerase type II),
and the rapid nucleotide sequencing of the amplified gyrB
fragments from a wide variety of bacteria. They used thesegyrB
genes in the taxonomic classification of Pseudomonas putida
andAcinetobacterstrains. We have reported that such closely
related bacteria, for example, Shigella and Escherichia coli,
might be classified bygyrBanalysis (12). The rate of molecular
evolution inferred fromgyrBgene sequences is faster than that
inferred from 16S rRNA gene sequences. For detection of Mycobacteriumspecies, Kasai et al. (19) have determined the
gyrBgene sequences of 43 slowly growing strains belonging to
15 species in the genusMycobacteriumand developed a
meth-od of PCR and PCR-restriction fragment length polymorphism analysis to differentiate these species.
The identification of bacteria by molecular genetics can be advanced further by DNA microarray technology (23, 27, 35). * Corresponding author. Mailing address: Genomics Research
In-stitute, SRL, Inc., 5-6-50 Shinmachi, Hino-shi, Tokyo 191-0002, Japan. Phone: 81-426-48-3873. Fax: 81-426-48-4054. E-mail: [email protected] -inc.co.jp.
2605
on May 15, 2020 by guest
http://jcm.asm.org/
The DNA microarray or DNA chip generally comprises a glass surface on which multiple DNA probes with known identities are fixed for molecular hybridization with DNA samples, which allows the examination of parallel gene expression or genotyp-ing. This method allows the simultaneous analysis of thousands of genes in a short assay time and so is useful for phylogenetic analysis and species identification. For the identification of bacteria, this method may involve the labeling of in vitro RNA transcribed from a target gene from bacteria in specimens, subsequent hybridization of the labeled in vitro transcribed RNA to species-specific oligonucleotide probes on a micro-array, and detection of the label, usually by fluorescence. For example, the Affymetrix Genechip, which uses large sets of oligonucleotides that are synthesized rather than spotted onto a glass substrate, has been successfully applied by using 16S
rRNA genes as a target for the identification ofMycobacterium
species isolates (42).
In the present study, we have investigated the use of a
microarray technology with gyrB-derived DNA probes to
dif-ferentiate Mycobacterium isolates at the species level. Using
the nucleotide sequence data in GenBank (Bethesda, Md.), we
designed specific probes for the identification of the
Myco-bacterium species M. tuberculosis, M. bovis, M. africanum, M. avium,M. intracellulare, M. kansasii, M. gordonae,M. asi-aticum,M. gastri,M. malmoense,M. marinum,M. scrofulaceum, M. simiae, and M. szulgai. We show that species-specific hy-bridization patterns on a microarray containing these probes can differentiate and identify these mycobacteria to the species level.
MATERIALS AND METHODS
Sample preparation for bacterial strain identification.The strains used in this study originated from reference collections (the American Type Culture Collec-tion) or were clinical isolates. One or two freshly grown colonies of bacteria were scraped into a 1.5-ml Eppendorf tube and resuspended in 500l of sterile water. The bacterial suspension was then boiled (at 100°C for 10 min) to release the DNA.
Sample preparation for clinical application.Clinical sputum samples were obtained from the Japan Anti-Tuberculosis Association in Fukujuji Hospital. Some standard strains were obtained from the American Type Culture Collec-tion and used as control bacteria. They were processed by theN-acetyl-L-cysteine (NALC)–NaOH method (29) and used for direct identification assays with the microarray or by the AMPLICOR MTB-PCR (Roche Diagnostics, Inc., Tokyo, Japan). An equal volume of the NALC-NaOH solution (2% NaOH, 1.45% sodium citrate, 0.5% NALC) was mixed with the processed samples, and the mixture was incubated at room temperature for 20 min. Phosphate buffer (67 mM; pH 6.8) was added, and the mixture was centrifuged (3,500⫻g) for 25 min. The excess fluid was poured off, and the sediment was resuspended in 1.0 ml of phosphate buffer; 0.8 ml of this suspension was used for culture by standard methods (29), and 0.2 ml was used to isolate chromosomal DNA, as follows. The cells (0.2 ml) were added to 2⫻TES buffer (Tris-HCl [pH 8.5], 20 mM; EDTA, 2 mM; NaCl, 300 mM) containing 100g of proteinase K (Roche Diagnostics, Basel, Switzerland) and 10% sodium dodecyl sulfate (SDS; final concentration, 1%), and the mixture was heated at 65°C for 1 h. The lysates were extracted with an equal volume of phenol-chloroform and precipitated with ethanol. The pellet was resuspended in 10l of TE buffer (10 mM Tris-HCl [pH 7.5], 1 mM EDTA). Human control DNA was also extracted from peripheral blood leukocytes from healthy volunteers by standard techniques (33).
Preparation of DNA microarray.The oligonucleotides used to prepare the DNA microarray were synthesized at Sawady Technology Co., Ltd. (Tokyo, Japan). Each 10l of the 14- to 15-mer oligonucleotides at a concentration of 200M was dispensed into a 96-well microplate with 10l of 2⫻ArrayIt Micro-Spotting solution (TeleChem International, Inc., Sunnyvale, Calif.) per well. The amino acid-modified DNA was printed onto silylated microscope slides with an arrayer (SPBIO 2000; Hitachi Software, Tokyo, Japan). Following print-ing of the slides, the slides were left at 65°C for 18 h to permit thorough dryprint-ing
of the DNA onto the surface of the silylated slides. After the slides had dried, they were washed in 0.2% SDS at 25°C for 5 min each, twice in distilled H2O (dH2O) at 25°C for 2 min each time, and once in dH2O at 95°C for 2 min; cooled to 25°C for 5 min; washed once in sodium borohydride solution (1.3 g of Na2BH4 dissolved in 375 ml of phosphate-buffered saline and 125 ml of pure ethanol) at 25°C for 5 min, twice in 0.2% SDS for 3 min each time, and twice in dH2O at 25°C for 2 min each time; and then left to air dry.
PCR and in vitro RNA transcription.ThegyrBregion was amplified by PCR withMycobacteriumgenus-specific primers (nucleotide positions 794 to 818 and 894 to 910 in the referenceM. tuberculosissequence in GenBank [accession number AB014241]; theM. tuberculosisamplicon size is 184 bp). The Mycobac-teriumspecies-specific primers were derived from regions of thegyrBgene that are conserved among all mycobacterial species. The primers that we designed were F119 (5⬘-TGGGCAACACCGAAGTGAAGTCGTT-3⬘) and R184T7 (5⬘ -GTAATACGACTCACTATAGGGCCGCACCARYTCWCGYGCYTT-3⬘), which contained a bacteriophage T7 promoter sequence at the 5⬘ends. Chro-mosomal DNAs were amplified by PCR in a thermocycler 480 (Perkin-Elmer Co., Norwalk, Conn.). PCR was performed in a total volume of 100l with 5 U ofTaqDNA polymerase (AmpliTaq; Perkin-Elmer Co.), 50 mM KCl, 10 mM Tris-HCl (pH 8.3), 1.5 mM MgCl2, 0.001% (wt/vol) gelatin, 200 mM each de-oxynucleoside triphosphate (dATP, dCTP, dGTP, and dTTP), 10M primer F119, and 10M primer R184T7. A 5-l bacterial sample was added to the PCR solution, which underwent an initial denaturation step of 95°C for 5 min before 30 cycles of 96°C for 1 min, 63°C for 1 min, and 72°C 1 min and then a final step of 72°C for 7 min for the last cycle. The PCR products were analyzed by electrophoresis on a 3% agarose gel. The promoter-tagged PCR amplicons were used to generate fluorescently labeled single-stranded RNA targets by in vitro transcription. Each 50-l reaction mixture contained approximately 50 ng of PCR product; 20 U of T7 RNA polymerase (Promega, Madison, Wis.); 40 mM Tris-HCl (pH 8.1); 6 mM MgCl2; 2 mM spermidine; 10 mM NaCl; 10 mM dithiothreitol; 2 mM (each) ATP, CTP, and GTP; 0.04 mM UTP; and 0.2 mM Fluoorlink cyanine 5 (Cy-5)–UTP (Amersham Pharmacia Biotech, Piscataway, N.J.). The reaction was carried out at 37°C for 1 h, and then the template DNA was removed by adding 3l of DNase I (GIBCO BRL, Grand Island, N.Y.) at 37°C for 15 min. The RNA transcribed in vitro was fragmented by incubation with 30 mM MgCl2at 94°C for 30 min (42).
Hybridization control.A hybridization probe (5⬘-GATCAGACACTTCAAG GTCTAG-3⬘) was printed onto silylated microscope slides with an arrayer. A DNA probe (5⬘-CTAGACCTTGAAGTGTCTGATC-3⬘) labeled with Fluoorlink Cy-5–CTP (Amersham Pharmacia Biotech), together with labeled sample DNA, was allowed to hybridize to the microarray. The control probe and the complementary target were made such that, ideally, they had similar melting temperatures and did not have consensus sequences that were the same as the sequence of the other probe. The hybridization signals for the control probes were used as hybridization controls.
Hybridization and analysis.The fluorescently labeled RNA was resuspended in 2.0 l of sterile water and then in 8.0l of prewarmed 1.25⫻UniHyb hybridization solution (TeleChem International, Inc.). The microarray was in-cubated in the presence of the fragmented labeled RNA solution for 30 min at 30°C and then washed in 2⫻SSC (0.3 M NaCl plus 30 mM sodium citrate)– 0.02% SDS at 25°C for 3 min and in 0.2⫻SSC at 25°C for 30 s. The fluorescent signal emitted by a target bound to the microarray was detected at a pixel resolution of 10m by using the ScanArray Lite instrument (GSI Lumomics, Northville, Mass.). Sixteen-bit TIFF images of 10-m resolution were imported into QuantArray software (GSI Lumomics). After subtraction of the background intensity (by a fixed circle-based quantification method), the mean intensities of the individual spots were used to calculate match-to-mismatch signal intensity ratios for pairs of spots corresponding to different alleles.
Effect of target sequence on signal intensity.To determine whether the oli-gonucleotide DNA targets arrayed retained their expected hybridization prop-erties, we first tested the hybridization signal intensities on the microarray by comparing the differences in fluorescence intensities between spots encoding homologous targets and those encoding nonhomologous targets. A perfectly matched oligonucleotide probe (M1-1 [5⬘-ACCGACGCGAAAGT-3⬘]) and a mismatched oligonucleotide probe (M1-2 [5⬘-ACCGACTCGAAAGT-3⬘) (where the underscores indicate the mismatched nucleotide]) were printed onto silylated microscope slides (n⫽5) with an arrayer. The Fluoorlink Cy-5–CTP (Amersham Pharmacia Biotech)-labeled DNA probe (5⬘-ACTTTCGCGTCGGT-3⬘) was al-lowed to hybridize to the microarray, and then the hybridization signals were analyzed.
DirectM. tuberculosisamplification tests.PCRs forM. tuberculosis amplifica-tion (MTB-PCR; AMPLICOR) were performed according to the instrucamplifica-tions of the manufacturer (1).
on May 15, 2020 by guest
http://jcm.asm.org/
Nucleotide sequence accession numbers.The nucleotide sequence data re-ported in this paper appear in the GenBank nucleotide sequence database under the following accession numbers: AB014192, AB014206, AB014189, AB014184, AB014294, AB014191, AB014188, AB014302, AB014187, AB014203, AB014205, AB014027, AB014182, AB014185, and AB014242.
RESULTS
Amplification of mycobacterial species. The DNAs of the
mycobacterial species from clinical specimens were amplified and analyzed by 3% agarose gel electrophoresis to confirm that
the primers were specific for thegyrBgenes of all
Mycobacte-rium species. A representative example of the mycobacterial
DNA amplification efficiencies is shown in Fig. 1. We obtained specific amplification of a 184-bp DNA fragment by PCR with primers F119 and R184T7. No amplification products were observed from human genomic DNA (Fig. 1, lane 10), indicat-ing that there is no similar or homologous region in human DNA. These results show that only a single band was amplified from the clinical specimens and that the primers used were
appropriate for amplification of thegyrBregion of
mycobacte-ria at the genus level.
Effect of target sequence on signal intensity.A DNA probe
(5⬘-ACTTTCGCGTCGGT-3⬘) labeled with Fluoorlink Cy-5– CTP (Amersham Pharmacia Biotech) was allowed to hybridize to the microarray, and then the hybridization signals were analyzed. Figure 2 shows that the signal intensities varied from 85,000 to 200 fluorescence units. Quantification of the fluores-cence signals showed that the relative intensity ratio of the homologous target to the nonhomologous target was about 8.0 for three different concentrations. These data show that these probes can differentiate between signal intensities arising from homologous and nonhomologous targets.
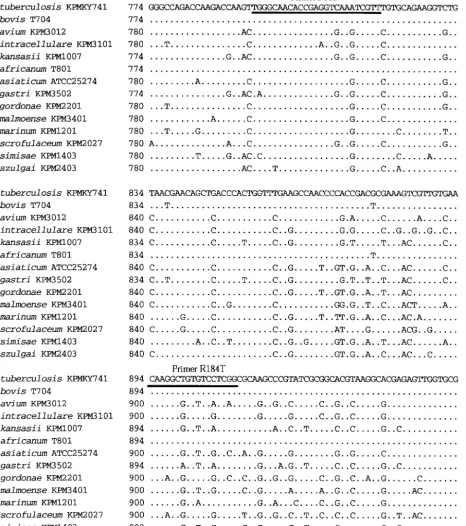
Design of species-specific oligonucleotides for microarray
analysis.The sequence alignment in Fig. 3 was used to identify
regions that were both unique to one particular mycobacterial species and sufficiently different from all other species to avoid cross-hybridization (17, 32). In addition, we designed each probe of 15 bases in such a way that the species-specific base sequence was located in the center of the probe. The probes FIG. 1. Amplification of mycobacterial DNAs with primers F119
and R184T7. Lanes: 1 to 8, amplification of gyrB fragments from clinical samples; 1,M. scrofulaceum; 2,M. tuberculosis; 3,M. kansaii; 4,
[image:3.603.51.539.424.668.2]M. intracelluare; 5,M. gordonae; 6,M. avium; 7,M. bovis; 8,M. simiai; 9, positive control withM. tuberculosis(GenBank accession number AB014241); 10, human genomic DNA; 11, negative control; M, mo-lecular size markers (X174-digestedHindIII). The arrow indicates the position of the expected amplification product.
FIG. 2. Quantification for the hybridization signals. (a) Perfectly matched oligo-probe (PM) (M1-1; 5⬘ ACCGACGCGAAAGT 3⬘) and mismatched oligo-probe (MM) (M1-2; 5⬘ACCGACTCGAAAGT 3⬘) were printed onto silylated microscope slides (n⫽5) by an arrayer. These probes in serial 10-fold dilutions were 4 to 6 log10 units (10⫺4M, 10⫺5M, and 10⫺6M). Fluoorlink Cy-5-CTP (Amersham Pharmacia Biotech., N.J.)-labeled DNA probe (M [5⬘ACTTTCGCGTCGGT 3⬘]) was allowed to hybridize to the microarray. (b) Hybridization signals were analyzed. The fluorescent signal emitted by a target bound to the microarray was detected at a pixel resolution of 10m by using ScanArray Lite. Sixteen-bit TIFF images of 10m resolution were imported into QuantArray software.
on May 15, 2020 by guest
http://jcm.asm.org/
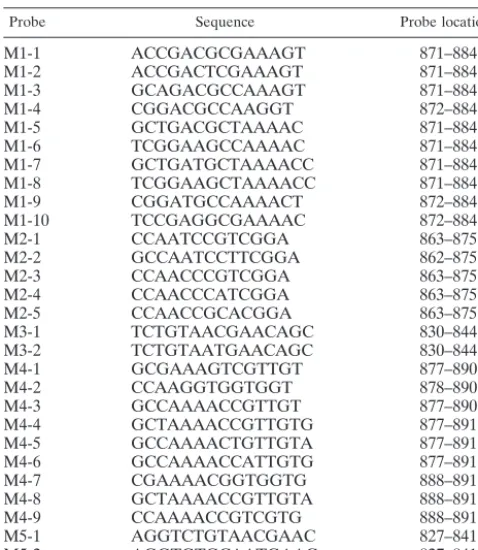
chosen for each mycobacterial species sequenced are shown in Table 1.
Because most Mycobacterium species cannot be identified
with a single probe, we used a combination of probes to iden-tify individual species. Figure 4 indicates how a set of 28 probes
can be used to differentiate 14 Mycobacteriumspecies. Each
Mycobacteriumspecies was expected to show a unique pattern
of reactivity to this set of probes. For example, whereas a
sample with M. tuberculosisis expected to hybridize with the
M1-1, M3-1, M4-1, and M5-1 probes, no otherMycobacterium
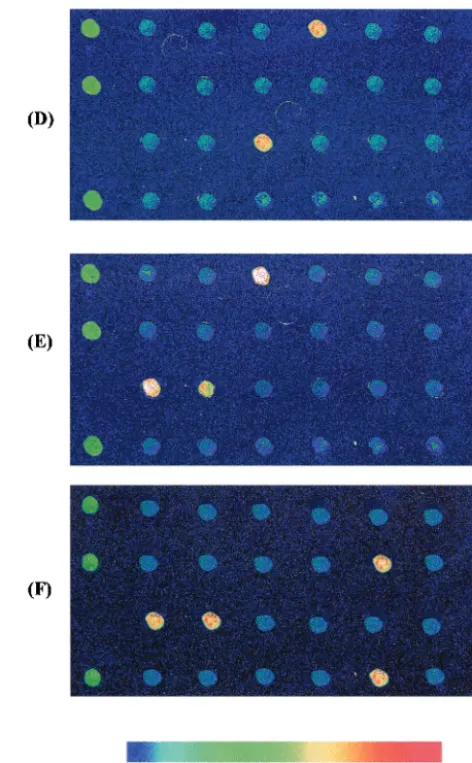
[image:4.603.61.528.81.608.2]species is able to react with the exact same four probes. The probes were printed onto the microarray as shown in Fig. 4. Figure 5 shows the actual scanning image obtained on the microarray, in which the colors of the spots, which are FIG. 3. Nucleotide sequence alignment of thegyrBgenes from the 14Mycobacteriumspecies strains. Nucleotides identical to those in
M. tuberculosis gyrBare indicated with dots, and PCR primers are underlined.
on May 15, 2020 by guest
http://jcm.asm.org/
pseudo-colored from yellow (highest) to blue (background level) according to the fluorescence intensity, represent the intensities of the reactions with the probes. Positive spots could be differentiated from negative spots, and a clear, specific
pat-tern of reactivity was observed for each six Mycobacterium
species which had been identified by the culture method. The culture results were consistent with the predictions in Fig. 5.
The specific set of probes complementary to M. tuberculosis,
for example, hybridized only to nucleic acids from the corre-sponding species and not to nucleic acids from any other my-cobacterial species examined here.
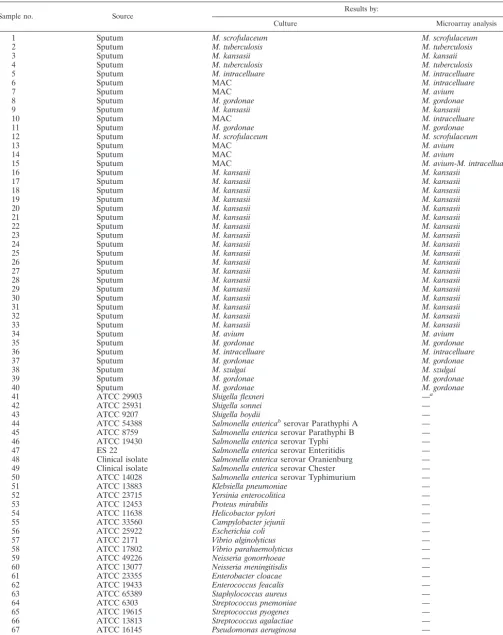
Microarray assay with labeled RNA from DNA samples
from cultured specimens.We analyzed in a blinded fashion 68
cultured specimens, including specimens with mycobacteria and nonmycobacteria, by both the conventional culture meth-od and the microarray methmeth-od, and the data were cmeth-oded at a later time (Table 2). Both methods gave the same results. The 28 specimens identified as nonmycobacteria by the culture method were classified as negative controls and were not rec-ognized by the microarray, as expected. In the culture assay, five specimens (specimens 6 to 10) were identified at best to be
members of theM. avium-M. intracellularecomplex (MAC). By
contrast, the microarray method was able to identify the indi-vidual species in these five specimens, that is, to specify either M. aviumorM. intracellulare. For the isolate in one specimen (specimen 15) that was identified as MAC by the culture meth-od, the scanning image obtained on the microarray showed a
composite of the pattern specific forM. aviumand that specific
for M. intracellulare, suggesting that this patient had a dual infection.
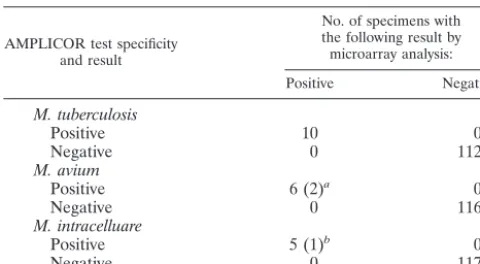
Blind test of microarray and AMPLICOR assays for direct
identification of clinical specimens.To determine whether the
gyrBfragment could be directly detected in clinical samples, we
analyzed 122 sputum samples by both the microarray assay and
AMPLICOR assays (forM. tuberuclosis,M. avium, andM.
in-tracellulare). Both methods produced identical results for these mycobacteria (Table 3). Most specimens were both AMPLI-COR MTB-PCR and microarray assay negative. Ten of 122 specimens were positive by the microarray assay and the
AMPLICOR assay for M. tuberculosis, and 6 and 5 of 122
specimens were positive by both methods for M. avium and
M. intracellulare, respectively (Table 3). Moreover, of six
spec-imens that were positive for M. avium by both methods, the
microarray assay identified two cases of dual infections with M. avium-M. intracelluareandM. avium-M. kansasii.Likewise, the microarray method detected a case of dual infection with M. avium-M. intracellulare, for which the AMPLICOR method
detected onlyM. intracelluare.
DISCUSSION
Mycobacterial species are usually identified by time-consum-ing culture methods. Recently, the development of rapid diag-nostic tests that use molecular genetic methods, such as PCR amplification, has been reported. The microarray has proved to be a valuable tool for the specific detection of microorgan-isms directly from clinical samples. In particular, it has several advantages over classical detection methods: first, the number of organisms in a clinical sample is not always large enough for the organisms to be detected by microscopic methods; second, the period required for culture of these organisms is long;
finally, not all acid-fast bacilli areM. tuberculosis, so an
iden-tification test must be used to differentiateMycobacterium
spe-cies.
Among several DNA regions that have been targeted for
diagnostic detection ofMycobacteriumspecies, the 16S rRNA
gene has been used the most frequently. DNA detection has been further advanced by exploiting the DNA microarray tech-nology (27), which can simultaneously detect hybridization to multiple DNA probes arranged in an array.
In the study described here we have developed a microarray
assay for the detection ofMycobacteriumspecies that uses the
gyrB gene as the target. Our study shows that a microarray
assay targeting thegyrBgene can identify mycobacteria at the
species level and can even differentiate among closely related species. A previous study (42) used 16S rRNA sequence data to construct a DNA probe array for the detection of mycobac-teria, but that array could not distinguish among closely related species of mycobacteria. In contrast, our microarray analysis
with the gyrB gene was able to classify the closely related
speciesM. tuberculosis and M. bovis. Of possible therapeutic
relevance was the fact that closely related species of very dif-ferent clinical importance were clearly difdif-ferentiated by this
technique, asM. tuberculosiscomplex species could be
distin-guished from M. avium, M. marinum, M. asiaticum, and M.
intracellulare. These results confirm those of previous studies reported by Yamamoto and Harayama (44, 45, 46) and Kasai
et al. (19) that analysis ofgyrB gene sequences is a rapid and
effective method for the identification of bacterial species. We have also shown that the microarray can readily differ-TABLE 1. Mycobacteria-specific probes
Probe Sequence Probe locationa
M1-1 ACCGACGCGAAAGT 871–884
M1-2 ACCGACTCGAAAGT 871–884
M1-3 GCAGACGCCAAAGT 871–884
M1-4 CGGACGCCAAGGT 872–884
M1-5 GCTGACGCTAAAAC 871–884
M1-6 TCGGAAGCCAAAAC 871–884
M1-7 GCTGATGCTAAAACC 871–884
M1-8 TCGGAAGCTAAAACC 871–884
M1-9 CGGATGCCAAAACT 872–884
M1-10 TCCGAGGCGAAAAC 872–884
M2-1 CCAATCCGTCGGA 863–875
M2-2 GCCAATCCTTCGGA 862–875
M2-3 CCAACCCGTCGGA 863–875
M2-4 CCAACCCATCGGA 863–875
M2-5 CCAACCGCACGGA 863–875
M3-1 TCTGTAACGAACAGC 830–844
M3-2 TCTGTAATGAACAGC 830–844
M4-1 GCGAAAGTCGTTGT 877–890
M4-2 CCAAGGTGGTGGT 878–890
M4-3 GCCAAAACCGTTGT 877–890
M4-4 GCTAAAACCGTTGTG 877–891
M4-5 GCCAAAACTGTTGTA 877–891
M4-6 GCCAAAACCATTGTG 877–891
M4-7 CGAAAACGGTGGTG 888–891
M4-8 GCTAAAACCGTTGTA 888–891
M4-9 CCAAAACCGTCGTG 888–891
M5-1 AGGTCTGTAACGAAC 827–841
M5-2 AGGTGTGCAATGAAC 827–841
aThe locations of probes are shown by the nucleotide number of thegyrB
sequence ofM. tuberculosis(GenBank accession number AB014241).
on May 15, 2020 by guest
http://jcm.asm.org/
[image:5.603.43.282.80.355.2]on May 15, 2020 by guest
http://jcm.asm.org/
FIG.
4.
Positions
of
Mycobacterium
-speci
fic
oligo-probes
on
the
DNA
microarray.
Each
species
of
Mycobacterium
was
expected
to
show
a
unique
pattern
of
reactivity
to
this
set
of
probes.
(A)
M.
tuberculosis
;
(B)
M.
bovis
;(C)
M.
avium
;(D)
M.
intracellulare
;(E)
M.
kansasii
;(F)
M.
gordonae
;(G)
M.
gastri
;(H)
M.
africanum
;(I)
M.
asiaticum
;(J)
M.
malmoense
;(K)
M.
marinum
;(L)
M.
scrofulaceum
;(M)
M.
simiae
;(N)
M.
szulgai
.NC,
Nonbacterial
hybridization
control.
on May 15, 2020 by guest
http://jcm.asm.org/
entiate between correctly matched and mismatched sequences (Fig. 2). The hybridization signals arising from perfectly matched oligonucleotide probes and mismatched oligonucleo-tide probes gave a signal-to-background ratio of 8.0 for three
concentrations of arrayed DNA (10⫺4, 10⫺5, and 10⫺6M).
We compared the clinical performance of the microarray assay with that of the traditional culture method. The results for isolates from 68 clinical specimens, including mycobacteria and nonmycobacteria, show that the overall performance of the microarray was comparable to that of the culture method. In cases in which the culture assay could identify specimens only as members of MAC, however, the microarray method
was able to identify the individual species, that is, either M.
avium orM. intracellulare. The microarray method was also able to identify both types of bacteria in cases of dual infection. For example, one specimen identified as MAC by the culture
method was identified to include bothM. aviumandM.
intra-cellularethrough its composite pattern on the microarray (Ta-ble 3). Our assay also performed well when its performance
was compared with that of the AMPLICOR MTB-PCR assay.
Studies on the use of PCR for the detection ofM. tuberculosis
organisms show that overall it has good sensitivity and speci-ficity, although the results for sensitivity vary from approxi-mately 50 to 100% (3, 4, 6, 10, 24, 36, 43). Cartuyvels et al. (4) have reported that the AMPLICOR PCR cannot yet replace
culture as a first-line screening method for the detection ofM.
tuberculosisisolates, but it can be used as a rapid confirmatory test for smear-positive specimens or in the case of a strongly
suspectedM. tuberculosisinfection (36). Rapid identification of
Mycobacteriumspecies is an important factor for the successful diagnosis of mycobacteriosis. However, because of the variable nature of the sputum specimens and the low sensitivities of these tests, there is a risk of negative results. No false-negative results were obtained by the microarray assay in this study.
[image:8.603.305.541.70.451.2]Our assay offers several advantages over other assays de-scribed in the literature. In addition, these initial studies sug-gest that our microarray method is at least as sensitive as and FIG. 5. Mycobacteriummicroarray. Colors represent the various intensities of theMycobacterium-specific oligonucleotide probes. Microarray analysis was performed after amplification of DNAs from cultured clinical specimens with primers F99 and R184T7, immobilization of specific probes on a glass slide, and hybridization on the glass slide with Cy-5-labeled clinical specimens. (A)M. tuberculosis; (B)M. bovis; (C)M. avium; (D)M. intracellulare; (E)M. kansaii; (F)M. gordonae.
on May 15, 2020 by guest
http://jcm.asm.org/
TABLE 2. Comparison of culture and microarray results with clinical outcome
Sample no. Source Results by:
Culture Microarray analysis
1 Sputum M. scrofulaceum M. scrofulaceum
2 Sputum M. tuberculosis M. tuberculosis
3 Sputum M. kansasii M. kansaii
4 Sputum M. tuberculosis M. tuberculosis
5 Sputum M. intracelluare M. intracelluare
6 Sputum MAC M. intracelluare
7 Sputum MAC M. avium
8 Sputum M. gordonae M. gordonae
9 Sputum M. kansasii M. kansasii
10 Sputum MAC M. intracelluare
11 Sputum M. gordonae M. gordonae
12 Sputum M. scrofulaceum M. scrofulaceum
13 Sputum MAC M. avium
14 Sputum MAC M. avium
15 Sputum MAC M. avium-M. intracelluare
16 Sputum M. kansasii M. kansasii
17 Sputum M. kansasii M. kansasii
18 Sputum M. kansasii M. kansasii
19 Sputum M. kansasii M. kansasii
20 Sputum M. kansasii M. kansasii
21 Sputum M. kansasii M. kansasii
22 Sputum M. kansasii M. kansasii
23 Sputum M. kansasii M. kansasii
24 Sputum M. kansasii M. kansasii
25 Sputum M. kansasii M. kansasii
26 Sputum M. kansasii M. kansasii
27 Sputum M. kansasii M. kansasii
28 Sputum M. kansasii M. kansasii
29 Sputum M. kansasii M. kansasii
30 Sputum M. kansasii M. kansasii
31 Sputum M. kansasii M. kansasii
32 Sputum M. kansasii M. kansasii
33 Sputum M. kansasii M. kansasii
34 Sputum M. avium M. avium
35 Sputum M. gordonae M. gordonae
36 Sputum M. intracelluare M. intracelluare
37 Sputum M. gordonae M. gordonae
38 Sputum M. szulgai M. szulgai
39 Sputum M. gordonae M. gordonae
40 Sputum M. gordonae M. gordonae
41 ATCC 29903 Shigella flexneri —a
42 ATCC 25931 Shigella sonnei —
43 ATCC 9207 Shigella boydii —
44 ATCC 54388 Salmonella entericabserovar Parathyphi A —
45 ATCC 8759 Salmonella entericaserovar Parathyphi B —
46 ATCC 19430 Salmonella entericaserovar Typhi —
47 ES 22 Salmonella entericaserovar Enteritidis —
48 Clinical isolate Salmonella entericaserovar Oranienburg —
49 Clinical isolate Salmonella entericaserovar Chester —
50 ATCC 14028 Salmonella entericaserovar Typhimurium —
51 ATCC 13883 Klebsiella pneumoniae —
52 ATCC 23715 Yersinia enterocolitica —
53 ATCC 12453 Proteus mirabilis —
54 ATCC 11638 Helicobactor pylori —
55 ATCC 33560 Campylobacter jejunii —
56 ATCC 25922 Escherichia coli —
57 ATCC 2171 Vibrio alginolyticus —
58 ATCC 17802 Vibrio parahaemolyticus —
59 ATCC 49226 Neisseria gonorrhoeae —
60 ATCC 13077 Neisseria meningitisdis —
61 ATCC 23355 Enterobacter cloacae —
62 ATCC 19433 Enterococcus feacalis —
63 ATCC 65389 Staphylococcus aureus —
64 ATCC 6303 Streptococcus pnemoniae —
65 ATCC 19615 Streptococcus pyogenes —
66 ATCC 13813 Streptococcus agalactiae —
67 ATCC 16145 Pseudomonas aeruginosa —
68 ATCC 29342 Mycoplasma pneumoniae —
a—, absence of amplification products. bSalmonella entericasubsp.enterica.
on May 15, 2020 by guest
http://jcm.asm.org/
may be less subject to error than methods based only on PCR. Most importantly, the microarray assay can analyze a sample for several kinds of bacteria at the same time. Dual infections,
such as those caused byM. aviumand M. intracellulareorM.
aviumandM. kansasii, could also be identified by microarray analysis. Thus, we have shown that the microarray assay de-scribed here has high levels of analytical sensitivity and speci-ficity as a clinical test.
In summary, the potential of the microarray strategy for the parallel testing of different targets has been demonstrated. It
has also been shown thatgyrBgene-based microarrays have the
potential to be used for the direct testing of samples to provide rapid results for species identification. Future studies will focus on defining both the identification of bacterial species and the drug resistance genotyping features of this technology for ap-plication in clinical diagnostics.
ACKNOWLEDGMENTS
We thank Kazunori Hochido for assistance with culture. We thank Noboru Fujinami and Yumiko Saito for stimulating discussions. We also thank Tadashi Matsunaga of the Tokyo University of Agriculture and Technology for critical advice regarding this study.
This study was supported by The New Energy and Industrial Tech-nology Development Organization of Japan.
REFERENCES
1. Bergmann, J. S., and G. L. Woods.1996. Clinical evaluation of the Roche AMPLICOR PCRMycobacterium tuberculosistest for detectionof M. tuber-culosisin respiratory specimens. J. Clin. Microbiol.34:1083–1085. 2. Brisson-Noel, A., B. Gicquel, D. Lecossier, V. Levy-Frebault, X. Nassiv, and
A. J. Hance.1989. Rapid diagnosis of tuberculosis by amplification of my-cobacterial DNA in clinical samples. Lancetii:1069–1071.
3. Brisson-Noel, A., C. Aznar, C. Chureau, S. Nguyen, C. Pierre, M. Bartoli, R. Bonett, G. Pialoux, B. Gicquel, and G. Garrique.1991. Diagnosis of tuber-culosis by DNA amplification in clinical practice evaluation. Lancet338:364– 366.
4. Cartuyvels, R., C. de Ridder, S. Jonckheere, L. Verbist, and J. van Eldere.
1996. Prospective clinical evaluation of AmplicorMycobacterium tuberculosis
PCR test as a screening method in a low-prevalence population. J. Clin. Microbiol.34:2001–2003.
5. Cloud, J. L., H. Neal, R. Rosenberry, C. Y. Turenne, M. Jama, D. R. Hillyard, and K. C. Carroll.2002. Identification ofMycobacteriumspp. by using a commercial 16S ribosomal DNA sequencing kit and additional sequencing libraries. J. Clin. Microbiol.40:400–406.
6. Cousins, D. V., S. D. Wilton, B. R. Francis, and B. L. Gow.1992. Use of polymerase chain reaction for rapid diagnosis of tuberculosis. J. Clin. Mi-crobiol.30:255–258.
7. Dawson, D. J.1990. Tuberculosis in Australia: an unfinished fight. Med. J. Aust.154:75–76.
8. De Wit, D., L. Steyn, S. Shoemaker, and M. Sogin.1990. Direct detection of
Mycobacterium tuberculosisin clinical specimens by DNA amplification. J. Clin. Microbiol.28:2437–2441.
9. Eisenach, K. D., M. D. Cave, J. H. Bates, and J. T. Crawford.1990. Poly-merase chain reaction amplification of a repetitive DNA sequence specific forMycobacterium tuberculosis. J. Infect. Dis.161:977–981.
10. Eisenach, K. D., M. D. Sifford, M. D. Cave, J. H. Bates, and J. T. Crawford.
1991. Detection ofMycobacterium tuberculosisin sputum samples using a polymerase chain reaction. Am. Rev. Respir. Dis.144:1160–1163. 11. Fries, J. W. U., R. J. Patel, W. F. Piessens, and D. F. Wirth.1990. Genus- and
species-specific DNA probes to identify mycobacteria using the polymerase chain reaction. Mol. Cell. Probes4:87–105.
12. Fukushima, M., K. Kakinuma, and R. Kawaguchi.2002. Phylogenetic anal-ysis ofSalmonella,Shigella, andEscherichia colion the basis of thegyrBgene sequence. J. Clin. Microbiol.40:2779–2785.
13. Gaydos, C. A., K. A. Crotechfelt, N. Shah, M. Tennant, T. C. Quinn, J. C. Gaydos, K. T. McKee, Jr., and A. M. Rompalo.2002. Evaluation of dry and wet transported intravaginal swabs in detection ofChlamydia trachomatis
andNeisseria gonorrhoeaeinfections in female soldiers by PCR. J. Clin. Microbiol.40:758–761.
14. Haas, W. H., W. R. Butler, C. L. Woodley, and J. T. Crawford.1993. Mixed-linker polymerase chain reaction: a new method for rapid fingerprinting of isolates of theMycobacterium tuberculosiscomplex. J. Clin. Microbiol.31:
1293–1298.
15. Hance, A. J., B. Grandchamp, V. Levy-Frebault, D. Lecossier, J. Rauzier, D. Bocart, and B. Gicquel.1989. Detection and identification of mycobacteria by amplification of mycobacterial DNA. Mol. Microbiol.3:843–849. 16. Hermans, P. W. M., A. R. J. Schuitema, D. Van Soolingen, C. P. H. J.
Verstynen, E. M. Bik, J. E. R. Thole, A. H. J. Kolk, and J. D. A. van Embden.
1990. Specific detection ofMycobacterium tuberculosiscomplex strains by polymerase chain reaction. J. Clin. Microbiol.28:1204–1213.
17. Higgins, D. G., A. J. Bleasby, and R. Fuchs.1992. CLUSTAL V: improved software for multiple sequence alignment. Comput. Appl. Biosci.8:189–191. 18. Holberg-Petersen, M., M. Steinbakk, K. J. Figenschau, E. Jantzen, J. Eng, and K. K. Melby.1999. Identification of clinical isolates of Mycobacterium spp. by sequence analysis of the 16S ribosomal RNA gene. Experience from a clinical laboratory. APMIS107:231–239.
19. Kasai, H., T. Ezaki, and S. Harayama.2000. Differentiation of phylogeneti-cally related slowly growing mycobacteria by theirgyrBsequences. J. Clin. Microbiol.38:301–308.
20. Kearns, A. M., A. J. Turner, G. J. Eltringham, and R. Freeman.2002. Rapid detection and quantification of CMV DNA in urine using LightCycler-based real-time PCR. J. Clin. Virol.24:131–134.
21. Kirschner, P., J. Rosenau, B. Springer, K. Teschner, K. Feldmann, and E. C. Bo¨ttger.1996. Diagnosis of mycobacterial infection by nucleic acid amplifi-cation: 18-month prospective study. J. Clin. Microbiol.34:304–312. 22. Maidak, B. L., N. Larsen, M. J. McCaughey, R. Overbeek, G. J. Olsen, K.
Fogel, J. Blandy, and C. R. Woese.1994. The Ribosomal Database Project. Nucleic Acids Res.22:3485–3487.
23. Maldonado, R. R., M. L. Espinosa, C. S. Suarez, W. G. Beattie, and K. L. Beattie.1999. Hybridization of glass-tethered oligonucleotide probes to tar-get strands preannealed with labeled auxiliary oligonucleotides. Mol. Bio-technol.11:1–12.
24. Pao, C. C., T. S. B. Yen, J.-B. You, J.-S. Maa, E. H. Fiss, and C.-H. Chang.
1990. Detection and identification ofMycobacterium tuberculosisby DNA amplification. J. Clin. Microbiol.28:1877–1880.
25. Patel, J. B., D. G. Leonard, X. Pan, J. M. Musser, R. E. Berman, and I. Nachamkin.2000. Sequence-based identification ofMycobacteriumspecies using the MicroSeq 500 16S rDNA bacterial identification system. J. Clin. Microbiol.38:246–251.
26. Patel, R. J., J. W. U. Fries, W. F. Piessens, and D. F. Wirth.1990. Sequence analysis and amplification by polymerase chain reaction of a cloned DNA fragment for identification ofMycobacterium tuberculosis. J. Clin. Microbiol.
28:513–518.
27. Ramsay, G.1998. DNA chips: state-of-the art. Nat. Biotechnol.16:40–44. 28. Reid, S. M., N. P. Ferris, G. H. Hutchings, K. De Clercq, B. J. Newman, N. J.
Knowle, and A. R. Samuel.2001. Diagnosis of foot-and-mouth disease by RT-PCR: use of phylogenetic data to evaluate primers for the typing of viral RNA in clinical samples. Arch. Virol.146:2421–2434.
29. Roberts, G. D., E. W. Koneman, and Y. K. Kim.1991. Mycobacterium, p. 304–340.InA. Balows, W. J. Hausler, K. L. Hermann, H. D. Isenberg, and H. J. Shadomy (ed.), Manual of clinical microbiology, 5th ed. American Society for Microbiology, Washington, D.C.
30. Ross, B. C., and B. Dwyer.1993. Rapid, simple method for typing isolates of
Mycobacterium tuberculosisby using the polymerase chain reaction. J. Clin. Microbiol.31:329–334.
[image:10.603.43.283.90.222.2]31. Saiki, R. K., D. M. Gelfand, S. Stoffel, S. J. Scharf, R. Higuchi, G. T. Horn, K. B. Mullis, and H. A. Erlich.1988. Primer-directed enzymatic amplifica-tion of DNA with a thermostable DNA polymerase. Science239:487–491. TABLE 3. Comparison of results of microarray analyses
with those of the AMPLICOR system
AMPLICOR test specificity and result
No. of specimens with the following result by microarray analysis:
Positive Negative
M. tuberculosis
Positive 10 0
Negative 0 112
M. avium
Positive 6 (2)a 0
Negative 0 116
M. intracelluare
Positive 5 (1)b 0
Negative 0 117
aTwo cases of dual infection withM. avium-M. intracelluareandM.
avium-M. kansasiiwere detected by microarray analysis.
bOne dual infection withM. intracellulareandM. kansasiiwas detected by
microarray analysis.
on May 15, 2020 by guest
http://jcm.asm.org/
32. Saitou, N., and M. Nei.1987. The neighbor-joining method: a new method for reconstructing phylogenetic trees. Mol. Biol. E.4:406–425.
33. Sambrook, J., E. F. Fritsch, and T. Maniatis.1989. Molecular cloning: a laboratory manual, 2nd ed. Cold Spring Harbor Laboratory Press, Cold Spring Harbor, N.Y.
34. Scarparo, C., P. Piccoli, A. Rigon, G. Ruggiero, D. Nista, and C. Piersimoni.
2001. Direct identification of mycobacteria from MB/BacT alert 3D bottles: comparative evaluation of two commercial probe assays. J. Clin. Microbiol.
39:3222–3227.
35. Schena, M., D. Shalon, R. W. Davis, and P. O. Brown.1995. Quantitative monitoring of gene expression patterns with a complementary DNA mi-croarray. Science270:467–470.
36. Shankar, P., N. Manjunath, K. K. Mohan, K. Prasad, M. Behari, G. K. Shriniwas, and K. Ahuja.1991. Rapid diagnosis of tuberculous meningitis by polymerase chain reaction. Lancet337:5–7.
37. Shawar, R. M., F. A. K. El-Zaatari, A. Nataraj, and J. E. Clarridge.1993. Detection ofMycobacterium tuberculosisin clinical samples by two-step poly-merase chain reaction and nonisotopic hybridization methods. J. Clin. Mi-crobiol.31:61–65.
38. Sio¨bring, U., M. Mecklenburg, A. B. Andersen, and H. Mio¨rner.1990. Poly-merase chain reaction for detection ofMycobacterium tuberculosis. J. Clin. Microbiol.28:2200–2204.
39. Takewaki, S.-I., K. Okuzumi, H. Ishiko, K.-I. Nakahara, A. Ohkubo, and R. Nagai.1993. Genus-specific polymerase chain reaction for the mycobacterial
dnaJgene and species-specific oligonucleotide probes. J. Clin. Microbiol.
31:446–450.
40. Thierry, D., M. D. Cave, K. D. Eisenach, J. T. Crawford, J. H. Bates, B. Gicquel, and J. L. Guesdon.1990. IS6110, an IS-like element of the Myco-bacterium tuberculosis complex. Nucleic Acids Res.18:188.
41. Tortoli, E., A. Nanetti, C. Piersimoni, P. Cichero, C. Farina, G. Mucignat, C. Scarparo, L. Bartolini, R. Valentini, D. Nista, G. Gesu, C. P. Tosi, M. Crovatto, and G. Brusarosco.2001. Performance assessment of new multi-plex probe assay for identification of mycobacteria. J. Clin. Microbiol.39:
1079–1084.
42. Troesch, A., H. Nguyen, C. G. Miyada, S. Desvrenne, T. R. Gingeras, P. M. Kaplan, P. Cros, and C. Mabilat.1999.Mycobacteriumspecies identification and rifampin resistance testing with high-density DNA probe arrays. J. Clin. Microbiol.37:49–55.
43. Wilson, S. M., R. McNerney, P. M. Nye, P. D. Godfrey-Faussett, N. G. Stoker, and A. Voller.1993. Progress toward a simplified polymerase chain reaction and its application to diagnosis of tuberculosis. J. Clin. Microbiol.
31:776–782.
44. Yamamoto, S., and S. Harayama.1995. PCR amplification and direct se-quencing ofgyrBgenes with universal primers and their application to the detection and taxonomic analysis ofPseudomonas putidastrains. Appl. En-viron. Microbiol.61:1104–1109.
45. Yamamoto, S., and S. Harayama.1996. Phylogenetic analysis of Acineto-bacterstrains based on the nucleotide sequences ofgyrBgenes and on the amino acid sequences of their products. Int. J. Syst. Bacteriol.46:506–511. 46. Yamamoto, S., and S. Harayama. 1998. Phylogenetic relationships of
Pseudomonas putidastrains deduced from the nucleotide sequences ofgyrB,
rpoD, and 16S rRNA genes. Int. J. Syst. Bacteriol.3:813–819.