ARTICLE
This open-access article is distributed under Creative Commons licence CC-BY-NC 4.0.Globally, 41 million children under the age of 5 years were classified as overweight or obese in 2016.[1] Recent data show that 18.1% of South African (SA) children aged 2 - 5 years are overweight.[2] Overweight and obesity significantly increase the risk of developing a number of non-communicable diseases (NCDs), including hypertension.[3,4]
Hypertension in younger children used to be rare,[5] but recent research indicates an increase in the prevalence of childhood hypertension.[6] Childhood hypertension significantly influences end-organ damage,[7] which, in turn, can result in serious cardiovascular illness or death.[8] With rising hypertension levels, this disease and its related NCDs are of global public health concern. Recent research suggests that prehypertension and hypertension rates among SA boys (6 - 8 years) are alarmingly high, especially among the black population.[9]
Evidence increasingly points to the role of sodium in the regulation of blood pressure in children.[10,11] Blood pressure in childhood also appears to be significantly associated with levels later in life.[12] The increased accessibility, availability and affordability of processed foods in SA are of concern, as these foods are generally considered to be high in fat, sugar or salt.[13,14]
The increase in hypertension among the SA population and the risk associated with a high-sodium diet motivated the SA Department of Health to introduce Regulation 214 (R214) of the Foodstuffs, Cosmetics and Disinfectants Act No. 54 of 1972 in 2013. This regulation aims to reduce the sodium content of certain processed foods and has been implemented in two phases, of which the target dates for implementation were 30 June 2016 and 30 June 2019, respectively.[15]
Limited information is available regarding the consumption of processed foods by SA children between the ages of 2 and 5 years and the sodium content of such foods, and it is unclear whether R214 includes these foods. This study therefore aimed to identify the processed foods frequently consumed by children between the ages of 2 and 5 years, with specific focus on the sodium content of these foods and the inclusion of the foods in the regulation.
Methods
Identifying frequently consumed processed foods
This cross-sectional study was conducted among children aged 2 - 5 years from Tlokwe Municipality, SA. As set out in the research protocol, 24-hour dietary recall (24HDR) was used to compile a population-specific electronic food frequency questionnaire (FFQ) to determine which processed foods are frequently consumed by the target population. A list of all the registered early childhood development centres within the municipal region was compiled and then mapped to ensure representation across the various suburbs. A random sample of 40 facilities was subsequently selected, representing all the suburbs. A convenience sample of parents or caregivers who volunteered to take part in the study was drawn from these facilities.Dietary recall interviews (24 hours) were subsequently conducted among parents and caregivers of the target age group in eight facilities, randomly selected from the full complement of 40. Dietitians and nutritionists from North-West University used the 24HDR data to develop an electronic FFQ. Foods identified from relevant literature[14,16] were also included. Pretesting of the Background. Rising levels of hypertension and the associated non-communicable diseases (NCDs) are of global public health concern. Evidence is emerging regarding the crucial role of sodium in regulating blood pressure in children. Processed foods high in fat, sugar or sodium have been identified as a key contributing factor to childhood obesity and diet-related NCDs.
Objectives. To determine the true sodium content of processed foods frequently consumed by children aged 2 - 5 years in Tlokwe Municipality in North-West Province, South Africa, and to determine whether the current sodium regulation (R214) includes high-sodium foods frequently consumed by young children.
Methods. Frequently counsumed processed foods were identified using an unquantified food frequency questionnaire. Atomic absorption spectrometry was used to determine the true sodium content of identified foods following microwave digestion.
Results. True sodium content was identified in 45 food products from 15 food categories. The majority of the products (86.7%) were included in R214. The measured sodium content of products differed from what was reported on the nutrition information labels, with differences ranging from 4.1% to 40.7%.
Conclusion. The majority of the food products consumed by children in this study are included in R214. These findings provide valuable information to support future studies on a larger set of processed foods frequently consumed by young children.
S Afr J Child Health 2020;14(1):45-49. https://doi.org/10.7196/SAJCH.2020.v14i1.1671
The South African Sodium Regulation (R214): Does
it make provision for processed foods frequently
consumed by young children?
M Korff,
1MSc; M Wicks,
1PhD; T van Zyl,
1PhD; B van der Westhuizen,
2PhD
1 Centre of Excellence for Nutrition (CEN), Faculty of Health Sciences, North-West University, Potchefstroom, South Africa
2 Food Evolution Research Laboratory, School of Tourism and Hospitality, University of Johannesburg, South Africa
ARTICLE
questionnaire involved interviewing 20 employees of North-West University who represented the respondents of the target population. This step was included to determine whether participants would understand the questionnaire and whether relevant information would be collected. The electronic FFQ was distributed to the remaining 32 facilities for targeted data collection. The development and testing of the FFQ are discussed further elsewhere.[17]
Frequently consumed foods were classified as foods consumed at least three times per week.[18] The identified food items were entered into an electronic spreadsheet.
Identifying true sodium content of
processed foods
From the 24HDR data, three brands (manufacturers) of a specified food product were identified per food category. For each brand in the identified food category, three similar food products were purchased from various supermarkets in Potchefstroom. To ensure equivalence, products with identical batch numbers and expiry dates were chosen. The following food products were excluded, as the study specifically focused on the sodium content of processed foods: composite meals (e.g. convenience meals), baby food (e.g. feeding formula), beverages (e.g. soft drinks), food products without nutritional information listed on the packaging (e.g. meat) and packaged fresh produce (e.g. vegetables).
As the study focused on sodium-contributing processed foods, only food products for which the sodium content was listed as >120 mg/100 g were analysed. Foods with a sodium content <120 mg/100 g are generally fresh produce rather than processed foods, and were therefore excluded.
Samples and preparation
Atomic absorption spectrometry (AAS) was used to analyse the true sodium content of the top quartile (top 25%) of the identified frequently consumed processed foods. Samples were prepared according to the method of Greenfield and Southgate,[19] after which the foodstuffs were subjected to microwave digestion (ETHOS EASY; Milestone, Italy). The ETHOS EASY is equipped with two 950 W magnetrons (for a total power output of 1 900 W) and was used to digest all food products according to the appropriate protocol for each food matrix.[19]
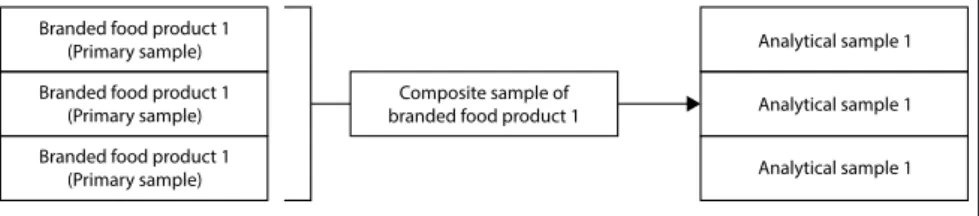
To ensure homogeneity of each composite sample, all primary samples were first blended separately and then together for at least 3 minutes. Each composite product
sample was divided into three analytical samples of ~0.5 g each (Fig. 1).
Certified standard reference material (peanut butter (SRM2387) and typical diet (SRM1548a)) from the National Institute of Standards and Technology (NIST, USA) was used as a comparative control sample in the analysis of each food sample. The average sodium content (and associated standard deviation (SD)) of the peanut butter reference was given as 4 890 (140) mg/kg. The average (SD) sodium content of the typical diet reference material was stated as 6 970 (125) mg/kg.
Sodium analysis and spectrometry
parameters
Sodium content was analysed using the AAS technique as previously described by Swanepoel et al.,[20] in line with R214. AAS signals were measured as absorbance using a standard curve (absorbance against concentration) based on standard sodium solutions (concentration range: 1.0 - 5.0 mg/L). Standard solutions were prepared each day before measurements. Measurements of each analytical sample were performed in triplicate. The linear equation of the sodium calibration curve was unique for each curve and formed part of the system suitability test. The wavelength and slit width were set at 330.3 nm and 0.5 nm, respectively. An air/acetylene oxidising flame was used, with an air flow of 13.5 L/min and an acetylene flow of 2.0 L/min. The current of the sodium lamp was set at 5.0 mA. A deuterium lamp (D2) was used for background corrections. The detection limit of the method was calculated as 0.008 ppm, determined by analysing seven replicates of a low-sodium standard (0.5 mg/L) and multiplying the SD of the seven replicates by three. As mentioned, the sodium content of all the food samples was estimated to be between 1 and 5 ppm, which is well above the detection limit; the limit of quantification was determined to be 1 ppm.
Statistical analysis
All statistical analyses were performed in Microsoft Excel (2016). The mean sodium content and coefficient of variance (CV) was calculated for each of the identified food products. This calculation was
based on nine samples (triplicate AAS measurements from three analytical samples taken from the composite sample). The mean sodium content and associated CV were subsequently calculated for each food category. The measured sodium content was compared with the target sodium contents stipulated by R214 for both the 2016 and 2019 implementation dates, and described as a percentage of the total number of food products analysed. The relative difference (%) between the measured sodium content and the sodium content stated on the packaging was calculated.
Ethical considerations
Ethical approval for the study was granted by the Health Research Ethics Committee of the North-West University, SA (ref. no. NWU-00033-17-A1-02).
Results
A total of 119 FFQs were received. Three questionnaires were excluded, as the children were older than 5 years. At the time of data collection, the average age of the children was 4 years and the majority of the children were female (60.3%).
Data from the FFQs revealed 66 food categories as being frequently consumed, of which 44 met the inclusion criteria for analysis. Only products in the top quartile of the identified food categories (n=15) were analysed (Table 1).
Two NIST samples (peanut butter; typical diet) were included in each round of AAS. Each of the NIST samples was analysed nine times (before measuring a new food category and freshly prepared each day) on different days, with an (average) accuracy and coefficient of analytical variation of 110.1% and 85.3%, respectively. The percentage relative SDs for the peanut butter (2.8%) and typical diet (2.7%) samples indicate a small variation in the means of the different samples and precision in the AAS analysis. Reagent blanks, which were measured with each of the food categories, returned a zero value with each analysed batch.
Three specific processed food brands were identified in each food category based on 24HDR data. In total, 135 readings of true sodium content were recorded. Except
Analytical sample 1
Analytical sample 1
Analytical sample 1 Branded food product 1
(Primary sample) Branded food product 1
(Primary sample) Branded food product 1
(Primary sample)
Composite sample of branded food product 1
ARTICLE
for tomato sauce and peanut butter, all the identified products were included in the regulation. The sodium content reported on the packaging was higher than the measured content for the majority of products (Fig. 2); differences exceeding 60% and 50% were found in two brands in the food categories ‘Cured meat – bully beef’ and ‘Noodles’, respectively. In the categories ‘Chips’ and ‘Tomato sauce’ the sodium content reported on the packaging was lower than the measured values in all the analysed brands (Fig. 2). The majority (71%) of the food products analysed complied with the 2016 targets stipulated by the regulation (Fig. 3).
Discussion
In light of the increase in childhood obesity and hypertension in SA,[2,9] the consumption of processed foods by SA children raises concern as these foods are often high in sodium. We therefore set out to determine the actual sodium content of various processed foods as included in R214 and frequently consumed by children under 5 years of age in the Tlokwe municipal region.
Bread, chips, viennas, soft (tub) margarines and processed meats (polony, salami, bacon and ham) were identified as the five most frequently consumed processed foods. To our knowledge, no other SA study specifically investigated the processed food consumption of young children. However, the 1999 National Food Consumption Survey reported foods frequently consumed by children (1 - 9 years) to be maize, white sugar, tea, whole milk and brown bread.[21] All five of the frequently consumed processed foods are included in R214. However, only two – bread and soft (tub) margarine – are included in the proposed SA paediatric food-based dietary guidelines (FBDGs). These guidelines aim to establish healthy eating habits and address the childhood obesity problem.[22] Finding that chips, processed sausages and processed meats were under the top five frequently consumed processed foods supports calls for a food environment where foods recommended by the FBDGs are the preferred choice.
Only two of the frequently consumed processed foods were not included in R214, namely peanut butter and tomato sauce; both ranked high (seventh and ninth, respectively) (Table 1). Peanut butter can be used as a good, fairly affordable source of energy and protein across the SA population, as animal-based protein sources are generally more expensive.[23] Nel and Steyn[24] reported that peanut butter ranked seventh under the foods consumed by SA children (1 - 5 years), but found that only 7.7%
Ta
bl
e 1. M
ea n s odi um c on te nt o f f oo ds i de nt ifi ed f or a na ly sis b as ed o n d ata f ro m f oo d f re qu enc y q ues tio nna ires Pro du ct ran k* A na ly se d f oo d pr od uc t Fo od c at eg or
y as s
ta
te
d in R214
N a co nt en t as rep or te d o n pac ka gin g (me an), m g/100 g M eas ur ed N a co nt en t (me an), m g/100 g Diff er ence o f me as ur ed a nd re po rte d c on te nt (CV , %) So di um r egu la tio n ta rg ets, m g/100 m g 2016 2019 1 Br ead (b ro w n) † Bre ad 380.0 323.8 ‡,§ 1.6 ( ↓ ) 400 380 2 Chi ps † Fl av our ed p ot at o cr isps, ex cludin g s al t-a nd-v in ega r 672.7 625.5 § 2.6 ( ↓ ) 650 550 3 Cur ed m ea
t – v
ienn as † Pr oces se d m ea
t – c
ur ed 1 011.0 947.8 2.5 ( ↓ ) 850 650 4 So ft (t ub) m ar ga rin e † A ll fa t a nd b ut ter s pr ead s 439.0 1 131.6 6.0 ( ↑ ) 550 450 5 Cur ed m ea
t – p
olo ny † Pr oces se d m ea
t – c
ur ed 984.7 933.4 4.8 ( ↓ ) 850 650 6 Br ea kfa st cer ea ls † A ll b re ak fa st cer ea ls 422.0 378.0 ‡,§ 0.9 ( ↓ ) 500 400 7 Pe an ut b ut te r n/a 175.3 208.1 4.6 ( ↑ ) N ot in clude
d in R
egu la tio n 214 8 In sta nt n oo dles † Dr y s av our y p ow der s w ith dr y in sta nt n oo dles t o b e mix ed w ith liq uid 1 046.3 1 020.3 ‡ 4.0 ( ↓ ) 1 500 800 9 To m at o s auce n/a 1 149.0 754.5 6.0 ( ↓ ) N ot in clude
d in R
egu la tio n 214 10 St oc k c ub es/p ow der s † St oc k c ub es, p ow der , g ra nu les, em ul sio ns, p as tes, j el lies 1 4318.7 1 2948.9 ‡,§ 1.9 ( ↓ ) 18 000 13 000 11 So up p ow der s † Dr y s ou p p ow der s (n ot in sta nt t yp e) 5 297.7 4 891.2 ‡ 2.8 ( ↓ ) 5 500 3 500 12 Cur ed m ea
t – b
ul ly be ef † Pr oces se d m ea
t – c
ur ed 1 163.7 614.6 ‡,§ 13.5 ( ↓ ) 850 650 13 Sa lt-a nd-v in ega r chi ps † Fl av our ed r ead y-t o-e at s av our y sn ac ks a nd p ot at o cr isps, sa lt-a nd-v in ega r o nl y 884.3 715.1 ‡,§ 2.5 ( ↓ ) 1 000 850 14 Sa uce p ow der s † Dr y s av our y p ow der s a nd dr y in sta nt s av our y s auces 5641.0 4 807.7 0.9( ↓ ) 3 500 1 500 15 Sa vo ur y crac ker s † Sa vo ur y sn ac ks, ex cludin g s al t-a nd-v in ega r fl av our ed 648.7 5 69.7 ‡,§ 4.0 ( ↓ ) 800 700
CV = co
efficien
t o
f va
ria
nce; R214 = R
egu la tio ns 214. *F oo d p ro duc ts a re ra nk ed f ro m m os t f re quen tly co ns um ed t o le as t f re quen tly co ns um ed . †In clude
d in R
ARTICLE
of total energy was provided by nuts and seed oils. Some peanut butters and tomato sauces can be classified as highly processed foods as a result of added salt, preservatives and colourants.[25]
Peanut butter and tomato sauce are consumed in fairly small quantities. Larger national studies to quantify food intake are therefore required to evaluate the need for including these foods in R214.
Among the five foods consumed most frequently, only bread met both the 2016 and 2019 sodium targets. (However, 76.0% and 49.0% of the set of 15 analysed food products met the 2016 and 2019 targets, respectively.) Brown bread was identified as the processed food most frequently consumed by children in this study, highlighting the importance of the inclusion of bread products in the regulations relating to the fortification of certain foodstuffs (R2003) and the reduction of sodium in certain foodstuffs (R214). Brown bread is also exempted from value-added tax in SA, which makes it
an affordable starchy food product.
The nutrition information panel displayed on the packaging over-reported sodium content in most of the food products analysed (individual brands) (Fig. 2). In food categories for which sodium content was under-reported, the variation between the measured sodium content and that reported on the nutrition information panel ranged from 4.1% (cured meat – viennas) to 50.7% (tomato sauce) (Fig. 2). Swanepoel et al.[20] reported similar findings, with the highest variation seen in the categories ‘Raw processed meat sausages’ (31.8%) and ‘All fat and butter spread’ (20.4%). The differences may be due to the food product not being perfectly homogenous, despite measures to ensure homogeneous composite samples. Homogenous sample preparation remains one of the biggest challenges in analyses of the kind reported here.
AAS results indicated that 26.0% of the processed food products did not comply with the 2016 sodium targets, although 58.0% of the products already complied with the 2019 target. This can be considered an indication of the food industry’s efforts to comply with the regulation. However, the findings also highlight the importance of continued compliance monitoring to manage and decrease the development of hypertension, as is the aim of R214.
Conclusion
SA is one of the first countries to implement mandatory sodium reduction legislation across a wide range of processed foods. This study analysed the sodium content of processed foods frequently consumed by children (2 - 5 years of age) in the Tlokwe municipal region, SA. Our findings indicate that the majority of the analysed foods are included in the new regulation governing sodium content. However, quantified food intake data from a larger comparable sample are needed for comparative analysis. The small sample size and target population were minor limitations of the study.
Soup po
w
ders
Sauc
e po
w
ders
St
ock cubes/po
w
ders Chips
Instan
t noodles
Salt
-and-vinegar chips
Sa
vour
y cr
ackers
Br
eakfast c
er
eals
Sof
t-tub mar
gar
ine
Cur
ed mea
t – viennas
Cur
ed mea
t – bully beef Bread (br
own)
Peanut butt
er
Toma
to sauc
e
Cur
ed mea
t – polon
y
Diff
er
enc
e bet
w
een r
epor
ted and measur
ed
Na c
on
ten
t (%)
60 50 40 30 20 10 0 –10 –20 –30 –40 –50 –60 –70
Food categories
Fig. 2. Comparison of sodium content stated on nutrition information panel of each brand and the actual product measurements.
Fig. 3. Compliance with sodium targets as stated in for the respective implementation dates in
Regulation R.214 Target dates
80 70 60 50 40 30 20 10 0
Complianc
e lev
el (%)
71
26
39 58
2016 2019
Yes No
ARTICLE
Declaration. This manuscript was submitted in partial fulfilment of the
requirements for the degree of Master of Science.
Acknowledgements. We thank the postgraduate students of North-West
University who assisted with sample preparation.
Author contributions. All authors contributed to the design of the study,
data collection and analysis, and preparation of the manuscript.
Funding. We gratefully acknowledge the MSc scholarship made available
by Discovery Vitality. The sponsor did not have any role in the design, analysis or interpretation of the study.
Conflicts of interest. None.
1. United Nations Children’s Fund, World Health Organization, International Bank for Reconstruction and Development/The World Bank. Levels and Trends in Child Malnutrition: Key findings of the 2017 edition of the Joint Child Malnutrition Estimates. Geneva: WHO, 2017.
2. Shisana O, Labadarios D, Rehle T, et al. South African National Health and Nutrition Examination Survey (SANHANES-1). Cape Town: HSRC Press, 2013. 3. Prospective Studies Collaboration. Body-mass index and cause-specific
mortality in 900000 adults: Collaborative analyses of 57 prospective
studies. Lancet 2009;373(9669):1083-1096.
https://doi.org/10.1016/S0140-6736(09)60318-4
4. National Heart Lung and Blood Institute. Risk of overweight and obesity. https://www.nhlbi.nih.gov/health-topics/overweight-and-obesity (accessed 26 November 2018).
5. Londe S. Causes of hypertension in the young. Pediatr Clin North Am 1978;25(1):55-65. https://doi.org/10.1016/S0031-3955(16)33532-5
6. Din-Dzietham R, Liu Y, Bielo M-V, Shamsa F. High blood pressure trends in children and adolescents in national surveys, 1963 to 2002. Circulation 2007;116(13):1488-1496. https://doi.org/10.1161/circulationaha.106.683243 7. Litwin M, Niemirska A, Śladowska J, et al. Left ventricular hypertrophy and
arterial wall thickening in children with essential hypertension. Pediatr Nephro 2006;21(6):811-819. https://doi.org/10.1007/s00467-006-0068-8
8. Feber J, Ahmed M. Hypertension in children: New trends and challenges. Clin Sci 2010;119(4):151-161. https://doi.org/10.1042/cs20090544
9. Mokwatsi GG, Schutte AE, Kruger R. Ethnic differences regarding arterial stiffness of 6 - 8-year-old black and white boys. J Hypertens
2017;35(5):960-967. https://doi.org/10.1097/hjh.0000000000001267
10. O’Halloran SA, Grimes CA, Lacy KE, Nowson CA, Campbell KJ. Dietary sources and sodium intake in a sample of Australian preschool children. BMJ
Open 2016;6(2):e008698. https://doi.org/10.1136/bmjopen-2015-008698
11. Shi L, Krupp D, Remer T. Salt, fruit and vegetable consumption and blood pressure development: A longitudinal investigation in healthy children. Br J
Nutr 2014;111(4):662-671. https://doi.org/10.1017/S0007114513002961
12. Riedel C, Von Kries R, Buyken AE, et al. Overweight in adolescence can be predicted at age 6 years: A CART analysis in German cohorts. PLoS ONE 2014;9(3):e93581-e93586. https://doi.org/10.1371/journal.pone.0093581
13. Moodley G, Christofides N, Norris SA, Achia T, Hofman KJ. Obesogenic environments: Access to and advertising of sugar-sweetened beverages in
Soweto, South Africa, 2013. Prev Chronic Dis 2015;12:E186. https://doi.
org/10.5888/pcd12.140559
14. Feeley AB, Norris SA. Added sugar and dietary sodium intake from purchased fast food, confectionery, sweetened beverages and snacks among Sowetan
adolescents. S Afr J Child Health 2014;8(3):88-91. https://doi.org/10.7196/
sajch.678
15. South Africa. Foodstuffs, Cosmetics and Disinfectants Act of 1972. Regulations: Reduction of sodium in certain foodstuffs and related matters. Government Gazette No. 36274(3), 2013 (Published under Government Notice R214). 16. Pedro TM, MacKeown JM, Norris SA. Variety and total number of food
items recorded by a true longitudinal group of urban black South African children at five interceptions between 1995 and 2003: The Birth-to-Twenty (Bt20) Study. Public Health Nutr 2008;11(6):616-623. https://doi.org/10.1017/ S1368980007000936
17. Theron N. The healthiness of processed foods frequently consumed by children in early childhood development centres in the North-West Province. MSc mini-dissertation. Potchefstroom: North-West University, 2018:1-76. 18. Brekke HK, Van Odijk J, Ludvigsson J. Predictors and dietary consequences
of frequent intake of high-sugar, low-nutrient foods in 1-year-old children
participating in the ABIS study. Br J Nutr 2007;97(1):176-181. https://doi.
org/10.1017/S0007114507244460
19. Greenfield H, Southgate DA. Food composition data: Production, management, and use. In: Burlingame BA, Charrondiere UR, eds. 2nd ed. Rome: Food and Agriculture Organization, 2003:72-79.
20. Swanepoel B, Malan L, Myburgh PH, Schutte AE, Steyn K, Wentzel-Viljoen E. Sodium content of foodstuffs included in the sodium reduction regulation of South Africa. J Food Compost Anal 2017;63:73-78. https://doi.org/10.1016/j. jfca.2017.07.040
21. Labadarios D, Steyn NP, Maunder E, et al. The National Food Consumption Survey (NFCS): South Africa, 1999. Public Health Nutr 2005;8(5):533-543. https://doi.org/10.1079/phn2005816
22. Vorster HH, Badham JB, Venter CS. An introduction to the revised food-based dietary guidelines for South Africa. S Afr J Clin Nutr 2013;26(3):S5-S12. 23. Steyn NP, Maunder EMW, Labadarios D, Nel JH. Foods and beverages that
make significant contributions to macro-and micronutrient intakes of children in South Africa – do they meet the food-based dietary guidelines? S Afr J Clin
Nutr 2006;19(2):66-76. https://doi.org/10.1080/16070658.2006.11734095
24. Nel JH, Steyn NP. Report on South African food consumption studies undertaken amongst different population groups (1983-2000): Average intakes of foods most commonly consumed. Pretoria: Department of Health, 2002. 25. Da Costa Louzada ML, Baraldi LG, Steele EM, et al. Consumption of
ultra-processed foods and obesity in Brazilian adolescents and adults. Prev Med 2015;81:9-15. https://doi.org/10.1016/j.ypmed.2015.07.018