Informatica37(2013) 55–60 55
Orange: Data Mining Fruitful and Fun - A Historical Perspective
Janez Demšar and Blaž Zupan
University of Ljubljana, Faculty of Computer and Information Science, Tržaška 25, Ljubljana, Slovenia E-mail:{janez.demsar|blaz.zupan}@fri.uni-lj.si
Keywords:data mining, machine learning, applications
Received:November 15, 2012
Orange (http://orange.biolab.si) is a general-purpose machine learning and data mining tool. Its multi-layer architecture is suitable for different kinds of users, from data mining beginners to programmers who prefer a scripting interface. In this paper we outline the history of Orange’s development and present its achievements, current status, and future challenges.
Povzetek: Orange kot splošno orodje za stojno uˇcenje in odkrivanje znanj iz podatkov, zgodovina, trenutna podoba in prihodnji izzivi.
1
Introduction
General-purpose machine learning software tools have had a short but eventful history. It began with utilities that im-plemented a specific induction method and reported on an inferred model in a textual form, to be then scrutinized and admired by the user. Such were implementations of tree and rule inducers C4.5 [5] and CN2 [3] in the 1980s. A contender to C4.5 was Assistant Professional [2]. Assis-tant Professional was expensive compared to C4.5, which came free with a book. As a result, C4.5 went on to be-come the most popular machine learning program of the last century and, in the spirit of free software, a precursor of open-source toolboxes.
In the 1990s the machine learning community grew sub-stantially and so did the number of different approaches. Many researchers preferred a single toolbox to implement, apply, and test their methods on a standard collection of data sets. Packages like IND and MLC++1emerged, each
with a set of command-line utilities that also implemented testing schemes and could report on evaluation scores.
To illustrate the challenges of those times, consider med-ical data modeled with a classification tree, and a medmed-ical doctor who wants to know which particular patients belong to a branch of the tree and what their average blood pres-sure is. With only a command-line utility at our disposal, this simple endeavor could (and did) prove rather impossi-ble. Command-line data analytics is no fun. Systems with graphical user interfaces emerged as alternatives. The ba-sic ones offered only data plotting capabilities such as R.2
In those that were more advanced, the user could interact with the graphics, for instance by clicking on a graphical element to get the information about the data it represents. SGI’s MineSet [1], for one, was a commercial product that was built on top of MLC++ and that implemented what was for the 1990s an advanced exploratory graphical
inter-1http://www.sgi.com/tech/mlc 2http://www.r-project.org
face. There was one problem, however. The data analysis pipeline was fixed: read the data, visualize the model, ex-plore it, and interpret the results.
Data analysts are, by definition, inquisitive. When given data, we like to dissect it, build models, observe their parts, consider specific data subsets, and dissect it further. We like to construct data analysis pipelines, not just use them. The idea of visual programming, an interface in which pipelines are created by linking predefined or even user-designed components, was explored in the early 1990s by Sun, IBM, and SGI in packages for data visualization such as Data Explorer.3 A similar idea took off in data
min-ing with Clementine (later bought by SPSS and in 2009 renamed to SPSS Modeler). Open-source toolboxes fol-lowed: Weka4, Knime5, Yale (which is now a much
re-designed RapidMiner6), and Orange7, each built on their
own favorite programming language, assembling a differ-ent set of core compondiffer-ents and offering their own interface for explorative data analysis.
2
History of Orange
The development of Orange began in 1997 by the authors of this paper. Its development continued at the Artificial Intelligence Laboratory and is currently taking place at the Laboratory of Bioinformatics, both at the University of Ljubljana.
Orange as a library of C++ components and command-line utilities. Orange was first conceived as a C++ li-brary of machine learning algorithms and related proce-dures, such as preprocessing, sampling, and other data
ma-3http://www.research.ibm.com/dx 4http://www.cs.waikato.ac.nz/ml/weka 5http://www.knime.org
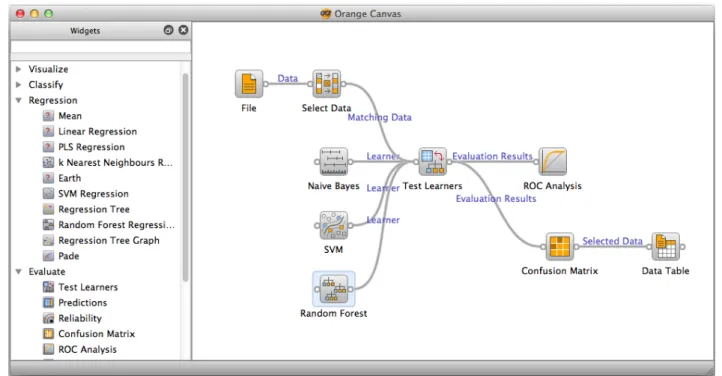
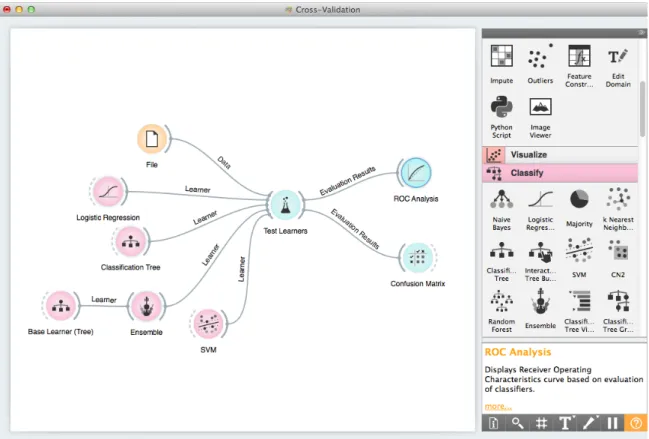
Figure 1: An Orange schema that explores misclassified data instances with a naive Bayesian classifier, support vector machines and random forest.
nipulation. We aimed at constructing a platform where ad-vanced users would write their own components in C++. This turned out not to be the case. Instead, Orange was mostly used for data exploration in which different combi-nations of provided preprocessing and learning algorithms were tested and scored using cross-validation. The com-ponents were packed into programs with command line in-terfaces. As this was too limiting, we decided to provide a scripting interface to these components by exposing them to Python.
Orange as a Python module. Python, a modern script-ing language, was chosen for a variety of reasons.
– It has a very clean and simple syntax that is easy to learn, not only for a programmer but also for a begin-ner. (Python is becoming the language of choice for teaching programming at many leading universities, including CMU, MIT, Berkeley, Rice and Caltech.)
– Despite its simplicity, Python is an industry-strength language. For instance, Python is behind many of Google’s technologies, which is also why Google is one of the major sponsors of Python’s development.
– Since programming in Python is fast, it is very suitable for prototyping of new methods.
– It is relatively easy to extend Python with modules written in C or C++. Python was even dubbed a glue language due to its use for gluing libraries in C or For-tran. Today, one seldom needs to implement
special-ized routines in low-level languages due to the avail-ability of high quality libraries such as NumPy and SciPy.
Since 1999 Orange has been used almost exclusively as a Python module. Although the C++ core eventually rose to around 140,000 lines, most developers have been adding to its Python modules and rather than implementing their own classes in C++.
The transition to Python has enabled several important developments. More and more of Orange’s functionality is implemented in pure Python or by combining the fast func-tions provided by the C++ Orange core using the glue code written in Python. Since the programs in Python are so readable, they enable collaboration of larger teams with-out the need to coordinate the development and establish a set of coding standards. The size of the group that de-velops the system has increased to 10-15 members, mostly from the Laboratory of Bioinformatics. Most importantly, migration to Python has simplified the development of the graphical user interface.
Orange: Data Mining Fruitful and Fun Informatica37(2013) 55–60 57
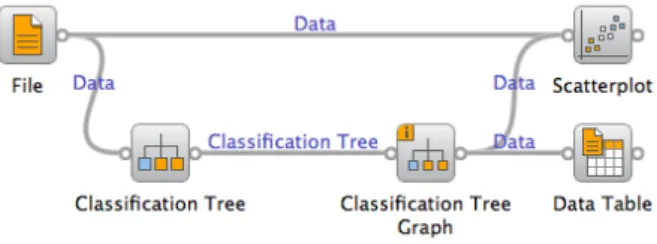
Figure 2: A schema where the user can observe data be-longing to selected nodes of the decision tree. The selected examples are shown in a table and marked in a scatter plot (see Figure 3).
which is behind products as different as Skype and KDE desktop.
The majority of current users now use Orange only through its graphical interface (Figure 1). It consists of a canvas onto which users place pipeline components called widgets. Each widget offers some basic functionality, such as reading the data, showing a data table, selecting data features, either manually or based on some feature scor-ing, training predictors, cross-validating them, and so forth. The user connects the widgets by communication channels. The basic strength and flexibility of Orange is in the differ-ent ways in which the widgets can be combined into new schemata.
Special emphasis in the development and design of wid-gets was placed on data visualization and interactivity. For instance, a classification tree viewer allows the user to click on a node of the tree, which transmits the data samples that belong to the node to any widgets connected to the tree viewer widget (Figure 2). The user can thus construct a tree and then explore its content by observing, say, a data table with the data instances from interesting nodes, or, for example, by drawing scatter plots from the entire data set and marking the data points from different nodes of the tree (Figure 3).
Figure 1 shows a more complex schema. After loading some data, the user selects a subset of instances and induces a naive Bayesian classifier, support vector machine, and random forest. Results are compared using ROC curves and confusion matrices. The confusion matrix is connected to a data table widget with which the user can observe par-ticular kinds of misclassifications.
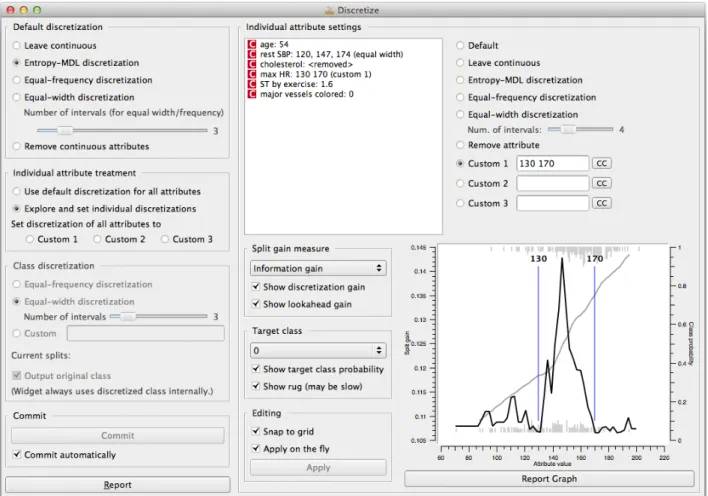
While the general philosophy of Orange is that widgets should be simple and the power of the tool should stem from the different ways of connecting them, several wid-gets are rather powerful by themselves. For instance, in the widget for discretization of continuous attributes (Fig-ure 4), we can set a general discretization method (equal interval width, equal frequency of data points, and entropy-based discretization), override it for individual attributes, or manually discretize an attribute by entering expert-defined thresholds or finding suitable ones from a graph that shows distributions and gains at different threshold values.
3
Orange in 2012
Orange, together with Knime, is among the easiest-to-use data mining tools available. It runs on OS X, Windows, and Linux. The default installation includes a number of ma-chine learning, preprocessing, and data visualization algo-rithms. Unlike Weka, for instance, which offers everything there is in machine learning, the goal of Orange was to im-plement the most useful and commonly used techniques in a way that is flexible and user-friendly. The emphasis of the tool is data exploration.
The machine learning algorithms in the default instal-lation are limited to a naive Bayesian classifier, k-nearest neighbors, induction of rules and trees, support vector ma-chines, neural networks, linear and logistic regression, and ensemble methods. Most methods are, however, coupled with a visual representation that allows for exploration of the resulting model; the user can select a node in a clas-sification tree or rule, and explore the training instances covered by them. A naive Bayesian classifier, logistic re-gression, and linear SVM can be explored through nomo-grams that offer insight into the importance of features and their individual values. Nomograms can also be used for explaining the model’s predictions. This also applies to unsupervised methods, such as association rules, multidi-mensional scaling, self-organizing maps, and various types of clustering.
In contrast with the intentionally limited assortment of machine learning methods, Orange has a rich collection of visualization methods. Besides the common visualiza-tions, such as box plots, histograms, and scatter plots, it contains a number of multivariate visualizations, including parallel coordinates, mosaic display, sieve diagram, survey plots, and a number of data projection techniques, such as multi-dimensional scaling, principal component analysis, RadViz, FreeViz, and others. The user can interactively explore the visualizations or connect them to other widgets that send or receive data from the visualization. Orange can also help the user in finding insightful visualizations by automatically ranking them by interestingness or by or-ganizing them into a network of visualizations.
Orange can be extended with additional modules. We currently provide an extensive collection of methods for bioinformatics, as well as modules for text mining and multi-target learning and a set of powerful widgets for vi-sualization and exploration of networks.
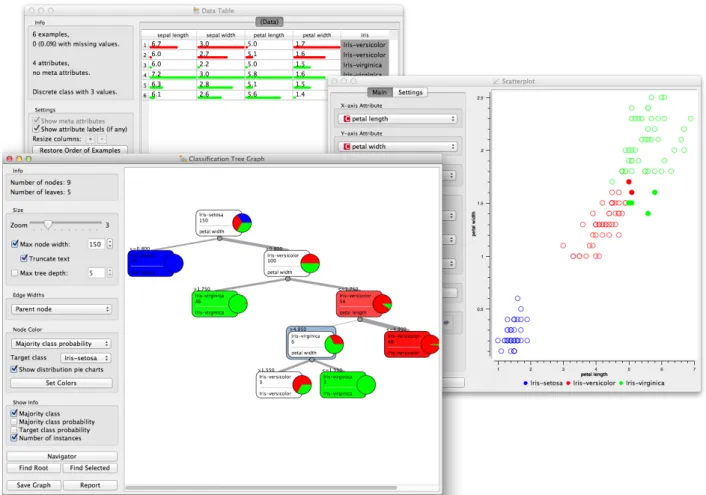
Figure 3: Widgets from schema in Figure 2 showing the classification tree with selected node of six instances. These are displayed in the table and highlighted in the scatterplot. The user can change the selection, instructing Orange to propagate it through the schema and update table and scatterplot widget. By combining interaction and signal propagation, the collection of widgets thus becomes a tool for explorative data analysis.
and data mining in countries around the world, including the US, Italy, France, Japan, Turkey, Cuba, and Peru.
4
Future developments
The landscape of Python’s libraries has been strongly af-fected by reorganizing the obsolete libraries Numeric and numarray into NumPy8, which has become a standard li-brary for scientific computation in Python. It provides ar-rays of arbitrary dimensions and linear algebra routines from BLAS and ATLAS. Another library, SciPy, adds many other common scientific routines, from statistical functions to fast Fourier transforms. The scikit-learn9
li-brary utilizes NumPy’s fast vectorized operations to pro-vide fast and high-quality implementations of most ma-chine learning algorithms and is widely used by the com-munity.
The power of Orange is not as much in its machine learning algorithms, but rather in the way in which they
8http://NumPy.SciPy.org 9http://scikit-learn.org
are packed and exposed to Python scripting in a simpler form. Beyond that, an even stronger feature of Orange is its graphical user interface and visual programming envi-ronment. We are intensely working on a new version of Orange in which we will replace the entire C++ core with routines in NumPy, SciPy, scikit-learn, and similar third-party open source libraries for Python. This should encour-age contribution from outside the group and allow us to concentrate on the development of just those parts where Orange is unique. For early 2013, we plan a revamped user interface (Figure 5) and, in collaboration with com-pany Ainda, we are designing MyFlow10, a platform with a
web-based interface to Orange.
Acknowledgements
Development of Orange is a team effort of many develop-ers, and we thank them all for their enthusiasm and support. Major contributions to the package have been made by Aleš Erjavec, Gregor Leban, Tomaž Curk, Marko Toplak, Miha
Orange: Data Mining Fruitful and Fun Informatica37(2013) 55–60 59
Figure 4: Discretization widget; the left part of the widget defines the general settings for all attributes and the right part allows for individual attribute customization.
Štajdohar, Anže Stariˇc, Matija Polajnar, Lan Žagar, Jure Žbontar, Mitar Milutinovi´c, Lan Umek, ˇCrt Gorup, Mar-tin Možina, Gregor Rot, Aleks Jakulin, and designers Peter
ˇ
Cuhalev and Roman Ražman. We thank the Slovenian Re-search Agency (P2-0209, J2-9699, L2-1112), National In-stitutes of Health (European Commission (FP7 CARE-MI 242038, FP7 AXLE 318633), Astra Zeneca, and Google through its Summer of Code program, for providing finan-cial support.
References
[1] Clifford Brunk, James Kelly, and Ron Kohavi. Mine-Set: An Integrated System for Data Mining. InKDD, pages 135–138, 1997.
[2] Bojan Cestnik, Igor Kononenko, and Ivan Bratko. AS-SISTANT 86: A Knowledge-Elicitation Tool for So-phisticated Users. InEWSL, pages 31–45, 1987.
[3] Peter Clark and Tim Niblett. The CN2 Induction Al-gorithm. Machine Learning, 3(4):261–283, 1989.
[4] Tomaz Curk, Janez Demsar, Qikai Xu, Gregor Leban, Uros Petrovic, Ivan Bratko, Gad Shaulsky, and Blaz
Zupan. Microarray data mining with visual program-ming. Bioinformatics, 21(3):396–398, 2005.
[5] J R Quinlan. C4.5: Programs for Machine Learn-ing, volume 1 ofMorgan Kaufmann series in Machine
Learning. Morgan Kaufmann, 1993.