Development and Validation of the Social Thermoregulation and Risk Avoidance Questionnaire (STRAQ-1)
How do interpersonal relationships form and what are they for? Bowlby’s (1969) model of interpersonal relation-ships proposed that caregivers (early in life) and partners (later in life) serves as a secure base from which to explore. The concept of interpersonal attachments has been associated with nearly every important aspect of human psychology, ranging from individual differences in emo-tion regulaemo-tion (Fraley, Waller, & Brennan, 2000; Sbarra & Hazan, 2008) to mental health (Schore, 2001). In the social psychological literature, individual differences of attachment are mostly assessed through self-reports that
tap people’s phenomenological experiences of felt safety and security in their past relationships and how these past relationships influence present appraisals of relation-ships. However, in the literature on self-reported differ-ences in attachment, it is overlooked that the behavioral attachment system was originally thought to have evolved as it benefited infant survival, revolving, in most animals around the social distribution of temperature regulation (i.e., social thermoregulation) and risk avoidance (Beckes & Coan, 2011; Ebensperger, 2001; IJzerman & Hogerzeil, 2017; IJzerman, Coan, et al., 2015).
There is thus a gap between what attachment’s func-tion and how it is measured. We aim to address this gap in the literature through the development and presenta-tion of the first iterapresenta-tion of the Social Thermoregulation and Risk Avoidance Questionnaire (STRAQ-1), in which we ask whether 1) individual differences in terms of people’s preferences and habits to distribute thermoregulation and risk exist, whether 2) attachment avoidance and anxi-ety are derived from problematic preferences and habits regarding such social thermoregulation and risk avoidance, and whether 3) inclusion of the STRAQ-1 improves our understanding of how relationships are linked with stress and health.
18, 1–18. DOI: https://doi.org/10.5334/irsp.222
RESEARCH ARTICLE
Development and Validation of the Social
Thermoregulation and Risk Avoidance Questionnaire
(STRAQ-1)
Rodrigo C. Vergara
*, Cristobal Hernández
†, Francisco Jaume-Guazzini
‡,§, Siegwart
Lindenberg
‖,¶, Richard A. Klein
**and Hans IJzerman
**Attachment theory was built around the idea that infants rely on others to survive, and it is often forgotten that survival hinged on coping with environmental demands. Adult attachment reports have instead been organized around people’s subjective experience of safety and security in relationships. To resolve the gap between infant’s physical needs and adult attachment experiences, we made a first step by developing the Social Thermoregulation and Risk Avoidance Questionnaire (STRAQ-1) in 12 countries (N = 1510), providing a complementary measure to identify biological drives formative to attachment. We conjectured that co-regulatory patterns of temperature and stress are foundational to attachment styles and on this basis used a naïve bootstrapping method to find a robust solution, conducting seven exploratory factor analyses in an exploratory-confirmatory fashion. We identified 23 (out of 57) items in 4 subscales: Social Thermoregulation (Total Omega = .83), High Temperature Sensitivity (.83), Solitary Thermoregulation (.77), and Risk Avoidance (.57). In terms of external validity, we also found that the
STRAQ-1 relates to emotion regulation strategies broadly and, importantly, relates to individual differ
-ences in attachment specifically, which in turn mediates the relationship with stress and health (making the scale face valid). Our approach provides a robust first effort in identifying biological mechanisms underlying attachment formation.
Keywords: Personality; Social Thermoregulation; Attachment Theory; Naïve Bootstrapping; Scale Devel-opment; Exploratory-Confirmatory Analyses
* Universidad de Chile, CL
† Universidad Adolfo Ibáñez, CL
‡ Pontificia Universidad Católica de Chile, CL
§ Clínica Alemana de Santiago, Universidad del Desarrollo, CL
‖ Rijksuniversiteit Groningen, NL
¶ Tilburg University, NL ** Université Grenoble Alpes, FR
Previous attachment instruments have mainly focused on behavioral consequences of attachment, rather than the biological bases which should be formative for those styles. The STRAQ-1 serves then as a complement to pre-vious assessment methods to help understand underly-ing mechanisms. Emergunderly-ing from theoretical insights and sharpened through an exploratory-confirmatory data-driven approach (in a sample of 1510 participants in 12 different countries) we detect four different sub-compo-nents of attachment drives (Social Thermoregulation and Risk Avoidance) and detect two more that predict stress and health beyond attachment through the constructs of Solitary Thermoregulation and High Temperature Sensitivity. We discuss how our first iteration of the STRAQ-1 helps to more fully appreciate attachment expe-riences, like feeling secure, as being related to (and we conjecture, derived from) attachment-related drives, like being warm and physically safe, ultimately furthering our understanding of how attachment helps the individual adapt to a given environment, thereby making successful a ttachment interventions within closer reach.
Attachment Theory and its Measurement
We postulate that biological mechanisms are formative to how people form relationships. If this were to be true, correlations between drives related to those mechanisms and relationship styles should continue to exist into adult-hood. Our proposal is not new; Bowlby (1969) already pro-posed that relationships were a solution to evolutionary problems, the most pressing of which is infant survival. Bowlby (1969) further regarded attachment behaviors, like crying and clinging, as means by which the infant could keep the caregiver close to be protected from threats, such as physical threats from large strangers or from the cold. One of the hallmarks of attachment the-ory is that early life experiences manifest in stable indi-vidual differences called attachment styles (Bowlby, 1969; Kriss, Steele, & Steele, 2012). Correlations between drives related to specific biological mechanisms and attachment styles are expected to continue into adulthood.
Bowlby and Ainsworth initially proposed three clas-sifications of attachment (avoidant (A), secure (B), and anxious (C)). This classification was later expanded to four with the addition of disorganized (D) (cf., Main & Solomon, 1986, 1990; see also Ainsworth et al., 1978). The success of this classification system for infants elicited – in the late eighties and early nineties – a rich development of self-report measures of attachment for adults. The most often-used measures were the Inventory of Parent and Peer Attachment (IPPA; Armsden & Greenberg, 1987), the Adult Attachment Scale (Collins & Read, 1990), the Relationships Style Questionnaire (Griffin & Bartholomew, 1994) and Simpson’s (1990) attachment scales. The cur-rently best-known and psychometrically most superior instrument that captures attachment style in adulthood is the Experiences in Close Relationships (ECR) Scale (Brennan, Clark, & Shaver, 1998; Fraley et al., 2000). It measures attachment on two dimensions of self-reported security, from less to more avoidant and from less to more anxious. All of the assessment tools we cite however
(including the ECR) focus 1) on the consequences of felt security and thus 2) on the phenomenological, subjective experience of the secure base.
In all modern self-report tools, however, there has been little focus to understand the underlying biological organ-ization of these systems, which Bowlby (1969) thought to be reliant on complex behaviors surrounding survival and by extension, exploration. As such, current attachment instruments omit the biological drives that were at the root of Bowlby’s theory and a new instrument is needed. We constructed the STRAQ-1 based on what was and still is needed for infant survival. In what follows, we provide the theoretical reasoning for this instrument.
Towards an Alternative Measurement: Reducing Risk and Regulating Temperature
To dig into the biological drives organizing survival behav-iors, we turn to studies on rodents (a domain that is prob-ably the richest in terms of evolutionary causes of group living). Although the literature in nonhuman animals is often reliant on small samples and sometimes lacks solid meta-analytical evidence, it can be used to learn the most basic of mechanisms. The rodent literature suggests at least two elementary drives around which group behav-ior is organized: Keeping safe from predation and from cold temperatures (Ebensperger, 2001). Attending to these aspects is needed for all altricial animals – including humans – whose infants are born so prematurely that they cannot possibly care for themselves. Attachment’s primary functions have thus evolved to help the organism to sur-vive from environmental threats in its early life phases, and the same should have been true for humans through-out evolutionary time. Because of this dependency early in life and its importance throughout evolutionary time, humans’ social lives in adulthood should have remained organized around risk avoidance and social thermoregula-tion, despite having the availability of all kinds of modern conveniences – like houses, infant heat-warming systems, and clothes – to protect them from environmental dangers (for a perspective taking a similarly evolutionary perspec-tive to attachment, see Bateson, Brilot, & Nettle, 2011).
Subscale 1: Attachment and Risk Avoidance
attached not only perceive dangers earlier than others, they also process threats more deeply and are not as e asily soothed when under distress (Ein-Dor, Mikulincer, & Shaver, 2011). Risk avoidance thus implies social distribu-tion of risk most of all.
Having had a reliable caregiver to protect from environ-mental threats should help develop a ‘prediction system’ that lets the individual trust close others to mitigate risks. Coan’s Social Baseline Theory relies on the assumption of risk distribution (Beckes & Coan, 2011): In multiple stud-ies on ‘the handholding effect’, Coan and colleagues find that threat-related neural activities after electric shock is decreased when the participant’s hand is held. This effect is more formidable when the handholder is a loved one, when relationship quality with the handholder is higher (Coan, Schaefer, & Davidson, 2006), and when past social experiences have been reliable (Coan, Beckes, & Allen, 2013). The reliance on others in distributing risk can be improved through therapy focused on feeling securely attached in relationships (Johnson et al., 2013). If the risk distribution process in relationships is successful, then risk avoidance is low.
Subscale 2: Attachment and Social Thermoregulation
The second subscale that we chose to be part of our scale is probably lesser known: Social thermoregulation, a phenomenon that has been well-documented in non-human animals (Ebensperger, 2001; Gilbert et al., 2010). Like keeping safe from dangers, thermoregulation is an important constraint for homeothermic endotherms to survive. Homeothermic endotherms can generate heat internally, but internal thermoregulation is e nergetically expensive. For shivering – one of the most important ways to gen erate heat – the efficiency is very limited ( Cannon & Nedergaard, 2004). The reliance on conspecif-ics seems remarkably asymmetrical: Coping with elevated temperatures is typically accomplished by the organism itself (e.g., through internal regulation like yawning or through behavioral thermoregulation like getting into colder water) because overheating can be immediately threatening for survival. In contrast, because tempera-ture decreases are not immediately dangerous, regulation back to homeostasis is often ‘outsourced’ to conspecifics through huddling (IJzerman, Lindenberg, et al., 2018).
The cheaper way to regulate temperature is through behavioral thermoregulation, one of the most efficient ones being social thermoregulation. For rodents for example, basic metabolic rate drops considerably when they are experimentally housed with others when in cold environments (Nuñez-Villegas, Bozinovic, & Sabat, 2014). In species other than humans, having a larger social net-work relates to having higher core temperatures when environmental temperatures drop (McFarland et al., 2015). In humans, there is now also a considerable support for the link between interpersonal relationships and tempera-ture regulation. For example, when people feel colder, cog-nitive accessibility of loved ones increases very similarly to when stressed for those who had past positive relationship experiences, whereas the effect flips for those who have negative relationship experiences (IJzerman, Neyroud,
Courset, Schrama, Post, & Pronk, 2018). Perhaps the most compelling effect is that higher levels of complex social integration protects people’s core temperature from colder climates (IJzerman, Lindenberg, et al., 2018). We thus sus-pect that it is likely that a lack of being th ermoregulated by close others early in life can lead to an insecure attachment.
Survival, Social Regulation, and the Development of Attachment
We have taken the position that whether infants’ needs are met in terms being able to offload temperature regulation and risk avoidance is central to interper-sonal attachment and there should thus be a correlation between the two in adulthood. Secure attachments can thus be expected when the caregiver(s) succeed(s) in meeting the infant needs in its quest to regulate tem-perature, avoid risk, and feel energized in general. Our reasoning informed us about the basic components we ought to measure so that we pick up on what went well and what did not go well in the development of one’s attachment style: The tendency to offload body tempera-ture regulation and the habit to avoid risky situations. If the risk distribution process was not successful, then risk avoidance will be high. In addition, we measured preferences that may or may not be part of the attach-ment process itself but could affect the consequences of being able to regulate temperature or avoid risks, such as thermal preferences (i.e., p referring hot or cold environments), and solitary versus social thermoregula-tion strategies (i.e., preferring a blanket over cuddling). Because risk avoidance and social thermoregulation are closely tied to metabolism regulation, we also included several items on self-reported feelings of being ener-gized (but could not find any reliable subscale related to ‘social metabolism’).
The Present Research
A priori, we expected a six-dimensional solution ( meaning that we were partly wrong in our a priori assump-tions). In order to discover such a six-factor solution, at least 30–36 items are needed (Fabrigar et al., 1999). In our second, data-driven part of the project, we initially used an exploratory-confirmatory method to establish our scale but ended up reporting naïve bootstrapping instead as it was more conservative (both methods are included in our analysis script). We also assessed our scale’s reliability and investigated the scale’s discriminant validity using the same exploratory-confirmatory method.
Methods
Sample
We collected data via different sites (described more exten-sively in the Supplemental Materials). Our total sample (after STRAQ missing data removal) consisted of N = 1510 (70.3% female, Mbirthyear = 1990.96; SDbirthyear = 8.44). Please note that we recorded birth year instead of age due to an oversight (the study was conducted in 2016).
Recruitment Procedure
This project was attached to a major social thermoregu-lation study called the Human Penguin Project (HPP; IJzerman et al., 2017). The last author recruited research sites through personal contacts and through ‘the Many-Lab’ (https://osf.io/89vqh/). This research was approved under an ‘umbrella’ ethics proposal at Vrije Universiteit, Amsterdam, the Netherlands. Additionally, each site pre-sented a local ethics committee approval, if applicable, to join the project. All ethics approvals can be downloaded from the project page from the individual site: https:// osf.io/2rm5b/.
We created one central survey, which was translated and back-translated keeping in mind loyalty to the origi-nal meaning, corrected where necessary when comparing the backtranslation and original version (Brislin, 1970). Backtranslations were led by one or two researchers per country, who were in charge of supervising the translation and backtranslation procedure. In case of doubts regard-ing specific items, the research leader(s) contacted the lead researchers (Vergara and IJzerman) to ask for the general meaning of the item(s). As a final step, a centralized review of all the backtranslations was made. In order to ensure the accuracy of the items, the lead researchers submitted all items to Google Translate. When a change in meaning was suspected with Google Translate, the research leader of that country was again contacted to ensure a proper translation was done. All surveys were then programmed into the online survey platform Qualtrics.
Procedure and Measurements
Participants completed a variety of online questionnaires at home or in the lab (depending on site). Answering the questionnaire took approximately 35 minutes in total (questionnaires in each language are available at https:// osf.io/2rm5b/). The STRAQ-1 portion consisted of a ques-tionnaire that was originally created to capture six theo-retical dimensions: Social Thermoregulation (N = 8; e.g., ‘When I feel cold I seek someone to cuddle with’), Risk
Avoidance (N = 10; e.g., ‘I try to be accompanied by people that I know at all times’), Social Metabolism (N = 7; e.g., ‘I feel energized after sharing my emotions with my part-ner’); Thermal Preference (N = 12; e.g., ‘I am sensitive to heat’), Contextual Thermal Preference (N = 6; e.g., ‘I prefer to work under cold environments rather than hot ones’), solitary or social thermoregulation strategies (N = 14; e.g., ‘When people are close to me, I like to be really close to them’). Vergara and IJzerman created each item with the goal of avoiding overlap between different dimensions. For the full 57-item list, see Appendix A.1 in the Supple-mental Materials.
A number of other questionnaires were included in the main project that could help us assess discriminant and external validity. Although we had anticipated six dimensions, we were cognizant of the fact that these six dimensions may not be confirmed. For external validity, we suspected a relationship of our questionnaire at least with attachment, stress, and health. Beyond that, we were not confident which other variables the STRAQ-1 related to. As a result, we simply included all the variables from the principle project (the Human Penguin Project).
At the beginning and end of the questionnaire, participants measured their own core body tempera-ture through an oral thermometer. We measured a host of questionnaires, which were given in random order. Similarly, in each questionnaire, items were delivered randomly where possible. For the Social Network Index, some questions are intended to logically follow each other and it could thus not be randomized. The ques-tionnaires we asked concerned the Perceived Stress Scale (PSS; Cohen & Willis, 1985), the Southampton Nostalgia Scale (SNS; Sedikides et al., 2008), the Home Attachment Scale (Harris, Brown, & Werner, 1996), Experiences in Close Relationships (measuring Attachment Avoidance and Anxiety; Fraley et al., 2000), participants daily sugary drink consumption (Henriksen et al., 2014), Nomophobia (Yildirim & Correia, 2015), Self-control (Tangney, Baumeister, & Boone, 2004), Alexithymia (Revised ver-sion of the TAS-20; Kooiman, Spinhoven, & Trijsburg, 2002), and the Social Network Index (Cohen et al., 1997). Finally, we also asked about participants’ sex, their height and weight, and whether they used medication. We also asked participants whether they were in a romantic rela-tionship or not and how monogamous they perceive themselves to be (from 1 [‘Not at all’] to 7 [‘Entirely’]; M = 5.87, SD = 1.69).
Analyses and Results
Software and Analysis Logic
All analyses were conducted using R (R Core Team, 2015), relying on packages caTools (Tuszynski, 2014) for random selection, psych (Revelle, 2018), nFactors (Raiche, 2010), GPArotation (Bernaards & Jennrich, 2005), MBESS (Kelley, 2017), and MNV (Korkmaz & Goksuluk, 2014) for factor analyses, Hmisc (Harrell & Dupont, 2016) for correlations, lavaan (Rosseel, 2012) for path analysis, lattice (Sarkar, 2008), and fmsb (Nakazawa, 2017) for data visualization. For data loading we used foreign (R Core Team, 2016).
To reduce chances of under- or overfitting our analyses, we relied on bootstrapping procedures using one thou-sand iterations. During bootstrap procedures, resampling is performed using random sampling with replacement. As such, all one thousand iterations had the same sam-ple size, but some observations might be absent or they can appear multiple times (e.g. duplicated, triplicate, or more) as they were sampled with replacement. We gauged external validity of the STRAQ-1 using other question-naires (again by using naïve bootstrapping). In doing so, we balanced parsimony (as few factors as possible) with plausibility (i.e., the probability that our factor structure is reproducible).
Detecting STRAQ-1’s Internal Structure
Following our bootstrap logic, we first performed seven iterative factor analyses to discover the internal structure of the STRAQ-1 using two bootstraps during each itera-tion (see Table 1). This method allowed us to reduce the number of items and factors to a minimum. Once we had obtained a factor structure with sufficient fit, without items cross-loading onto different subscales, and ascer-tained that all items load >0.3 onto its factor (ensuring sufficient communality), the iteration procedure was ended. In the Supplemental Materials we explain this pro-cedure in more detail.
The final iteration, and current solution, presented a significant Chi Squared test (χ²[253, N = 1510] = 768,
p < .001), significant Bartlett’s Test of Sphericity (χ²[253, N = 1510] = 8075, p < .001), an overall KMO of 0.78 (ref: >0.7), RMSEA index of 0.059 (C.I. 90%: 0.055–0.063, ref: <.05), and Tucker Lewis Index of 0.831 (ref: >0.9). This means that for our factor analyses, we had an adequate sample of questions (we had adequate correlation among items and less factors than items) and the final solution presented a reasonable fit (Budaev, 2010). One should expect a significant Chi Squared test given our sample size. The larger the sample size, the harder it is for the Chi Squared test not to reject the null hypothesis (Hu & Bentler, 1999; Iacobucci, 2010; Kline, 2011). For the pre-sent case, it is thus wise to rely on CFI and TLI, which are fit indicators not sensitive to sample size (Iacobucci, 2010; Kline, 2011).
Assessing the STRAQ-1’s Reliability and Correlations amongst STRAQ-1 Subscales
We termed the subscales of our final solution Social Thermoregulation, Risk Avoidance, Solitary Thermoreg-ulation, and High Temperature Sensitivity (items that composed each scale as well as each sub scale’s reliabil-ity can be observed in Table 2). We also obtained a fifth factor, mostly related to Solitary Thermoregulation. This factor – beyond just Solitary Thermoregulation – also cap-tures a separate factor Solitary Thermoregulation under stress. Since this additional factor strongly overlaps theo-retically with the other Solitary Thermoregulation factor, we decided to merge them. When evaluating the newly merged Solitary Thermoregulation factor versus them separately, we found Cronbach’s Alpha: 0.7; ωh: 0.59;
ωt: 0.76, M = 3.33 ± 0.74; for Solitary Thermoregulation,
and Cronbach’s Alpha: 0.57; ωh: 0.05; ωt: 0.59, M = 3.25
± 0.73 for Solitary thermoregulation under stress. When merging both factors into one subscale, we obtain a Cron-bach’s Alpha: 0.68; ωh: 0.57; ωt: 0.77, M = 3.30 ± 0.59.
Changes in reliability were thus only minor. When run-ning a factor analysis for only these two items forcing a 1-factor solution, just two items of the Solitary
Ther-Table 1: Iterative Factor Analysis procedure for structure validation.
Iteration 1 2 3 4 5 6 7
Number of Factors to Extract (PA) 11 10 10 10 6 5 5
Number of Factors to Extract (OC) 11 10 10 10 6 5 5
Number of Factors Extracted 11 10 10 10 6 5 5
Number of items 57 42 39 37 29 25 23
Items loading below 0.3 12 1 1 0 0 0 0
Items loading on more than 1 factor 3 2 1 0 2 1 0
Items removed by two items factor criteria 0 0 0 8 2 0 0
Number of items removed 15 3 2 8 4 2* 0
TLI 0.79 0.82 0.86 0.85 0.83 0.82 0.83
RMSEA Index 0.041 0.046 0.040 0.042 0.051 0.058 0.059
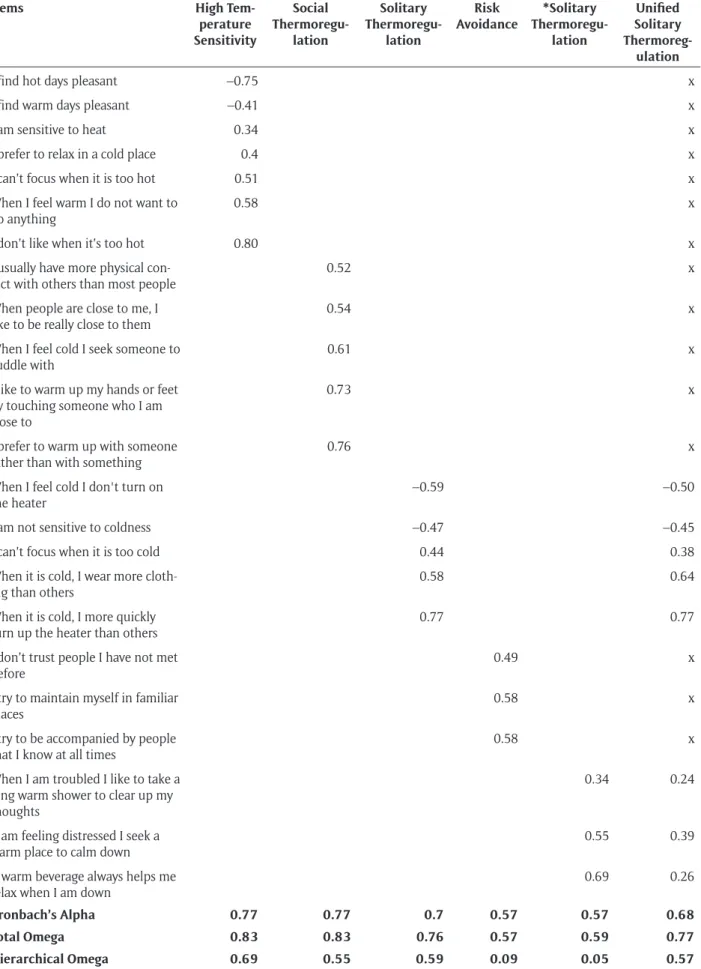
Table 2: STRAQ–1 factor loadings. Blank cells denote loadings below 0.3. Two subscales associated to Solitary Thermoregulation were found. We present the factor solution accompanied by all scales, and for the two Solitary Thermoregulation scales alone. In this case we marked with an x to denote that those items were not included. In the unified factor analysis for Solitary Thermoregulation we present all.
Items High
Tem-perature Sensitivity
Social
Thermoregu-lation
Solitary
Thermoregu-lation
Risk
Avoidance Thermoregu-*Solitary lation
Unified Solitary
Thermoreg-ulation
I find hot days pleasant –0.75 x
I find warm days pleasant –0.41 x
I am sensitive to heat 0.34 x
I prefer to relax in a cold place 0.4 x
I can’t focus when it is too hot 0.51 x
When I feel warm I do not want to
do anything 0.58 x
I don’t like when it’s too hot 0.80 x
I usually have more physical
con-tact with others than most people 0.52 x
When people are close to me, I
like to be really close to them 0.54 x
When I feel cold I seek someone to
cuddle with 0.61 x
I like to warm up my hands or feet by touching someone who I am close to
0.73 x
I prefer to warm up with someone
rather than with something 0.76 x
When I feel cold I don't turn on
the heater –0.59 –0.50
I am not sensitive to coldness –0.47 –0.45
I can’t focus when it is too cold 0.44 0.38
When it is cold, I wear more
cloth-ing than others 0.58 0.64
When it is cold, I more quickly
turn up the heater than others 0.77 0.77
I don’t trust people I have not met
before 0.49 x
I try to maintain myself in familiar places
0.58 x
I try to be accompanied by people
that I know at all times 0.58 x
When I am troubled I like to take a long warm shower to clear up my thoughts
0.34 0.24
If am feeling distressed I seek a warm place to calm down
0.55 0.39
A warm beverage always helps me
relax when I am down 0.69 0.26
Cronbach’s Alpha 0.77 0.77 0.7 0.57 0.57 0.68
Total Omega 0.83 0.83 0.76 0.57 0.59 0.77
moregulation under stress factor loaded over 0.3. Despite the subloadings, we decided to merge these two factors into one subscale, as together, they are theoretically more coherent phenomenon described as Solitary Thermoregu-lation. The most representative items of unified Solitary Thermoregulation scale are ‘When it is cold, I wear more clothing than others’, and ‘When it is cold, I more quickly turn up the heater than others’, which embodies the need of fulfilling proactively and solitarily thermoregulatory needs.
For Risk Avoidance, we found that one item (‘I love to arrive to unknown places alone’) was at the edge of fac-tor removal criteria (–0.33). When we examine internal consistencies (Cronbach’s Alpha: 0.55; ωh: 0.56; ωt: 0.59,
M = 3.05 ± 0.55), we noticed that the structure of the sub-scale was weak. Specifically, we found that this item cor-related with the remaining items with a Pearson r ranging from 0.09 to 0.19. When removing this item, we found almost no change in internal Cronbach’s Alpha: 0.57;
ωh: 0.09; ωt: 0.57, M = 3.14 ± 0.72. The drop in Hierarchical
omega can be attributed to the low number of items in the scale. In any case, we would like to highlight that with only four items, just removing one would be enough to deteriorate internal consistency. Given that internal con-sistency did not change when removing the item, and that it was poorly correlated with the remaining items, we decided to remove it. The most representative items are ‘I try to be accompanied by people that I know at all times’ and ‘I try to maintain myself in familiar places’.
The Social Thermoregulation dimension is character-ized by the willingness to thermoregulate with others, were the two most representative items were ‘I prefer to warm up with someone rather than with something’ and ‘I like to warm up my hands or feet by touching someone who I am close to’. Social Thermoregulation subscale pre-sented Cronbach’s Alpha: 0.77; ωh: 0.55; ωt: 0.83 with an
average score of 3.07 ± 0.78. High Temperature Sensitivity on the other hand is characterized by the preferences of cold places and discomfort under heat. The most rep-resentative items are ‘I don’t like when it’s too hot’ and reverse item ‘I find hot days pleasant’. High Temperature Sensitivity subscale presented Cronbach’s Alpha: 0.77;
ωh: 0.69; ωt: 0.83 with an average score of 3.11 ± 0.70.
The STRAQ-1 thus represents a robust factor solution supported by solution diagnostics and by bootstrap-ping procedures. Of our four subscales and using Omega Coefficient, Social Thermoregulation, High Temperature Sensitivity, and Solitary Thermoregulation presented an acceptable internal consistency ωt > 0.7), whereas this was
not the case for Risk Avoidance (ωt = 0.57).
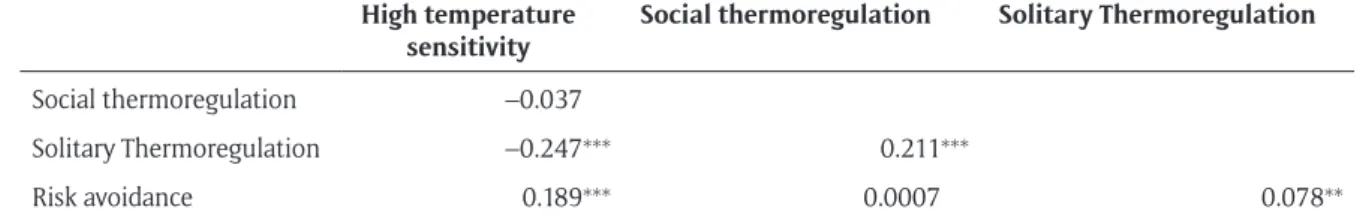
We also tested correlations amongst STRAQ-1 subscales, again relying on our bootstrap logic. Significant correla-tions were found for Solitary Thermoregulation and High Temperature Sensitivity (r = –.24; meaning that people who prefer colder temperatures tend to ‘outsource’ tem-perature regulation), Solitary Thermoregulation and Social Thermoregulation (r = .21; meaning that at least some portion of people use both strategies to thermoreg-ulate), Risk Avoidance and High Temperature Sensitivity (r = .18 meaning that people who do not prefer unfamil-iar situations tend to be more sensitive to heat), and Risk Avoidance and Solitary Thermoregulation (r = .07; mean-ing that people who do not prefer unfamiliar situations may tend to thermoregulate using non-social strategies [although this correlation is rather small; see Table 3]).
External and Discriminant Validity of the STRAQ-1
The next step, gauging external and discriminant validity, consisted again of two phases. We first assessed simple correlations (and independent sample Welch t-tests for categorical variables) with other scales to form a general impression of the meaning of the STRAQ-1. We then pro-ceeded to model the more complex relationships between social thermoregulation and risk avoidance habits on the one hand and subjective security in relationships (meas-ured through ECR attachment) on the other hand.
Nomological Network of the STRAQ-1: Correlations and Group Comparisons with Well-Known Constructs
In order to discover the nomological network of the STRAQ-1, we first ran a number of simple correlations with other, better-known constructs through bootstrap (all variables reported in Tables 4a–e). We report them without much further interpretation, due to a lack of a priori hypotheses. Importantly, the STRAQ-1 sub-scales clearly correlate with attachment measures as well as with emotion regulation variables (all of which are typically related to attachment styles), which is the central portion of our article and we further explore in the next section.
Sex, sexual orientation, and being or not being in a rela-tionship were analyzed using multiple Welch t-tests (and we were even more strict in this section of our analyses, using Bonferroni’s correction and bootstrapping meth-ods). Results can be found in Table 4f.
External, Discriminant, and Face Validity of the STRAQ-1: Predicting Attachment from STRAQ-1 Related Habits
The most important part of our analyses was to assess the relationship between STRAQ-1 and attachment, in order to know whether the measurement is different from
Table 3: Bootstrapped Pearson’s correlations among STRAQ–1 subscales.
High temperature
sensitivity Social thermoregulation Solitary Thermoregulation
Social thermoregulation –0.037
Solitary Thermoregulation –0.247*** 0.211***
Risk avoidance 0.189*** 0.0007 0.078**
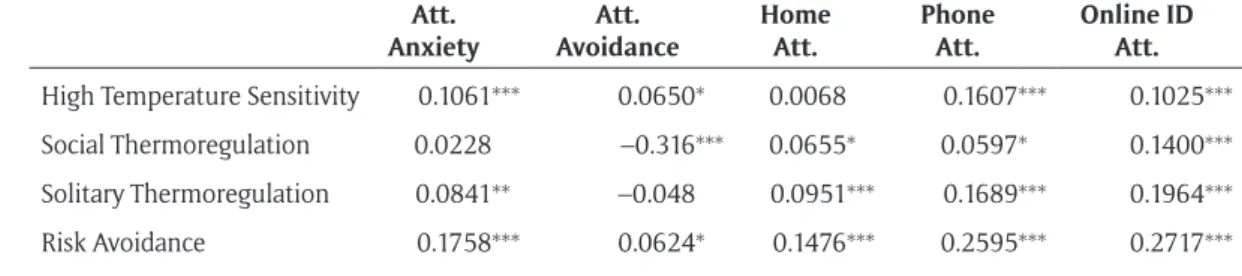
Table 4a: Bootstrapped Pearson correlations between STRAQ-1 Subscales and Attachment Variables.
Att.
Anxiety AvoidanceAtt. Home Att. Phone Att. Online ID Att.
High Temperature Sensitivity 0.1061*** 0.0650* 0.0068 0.1607*** 0.1025***
Social Thermoregulation 0.0228 –0.316*** 0.0655* 0.0597* 0.1400***
Solitary Thermoregulation 0.0841** –0.048 0.0951*** 0.1689*** 0.1964***
Risk Avoidance 0.1758*** 0.0624* 0.1476*** 0.2595*** 0.2717***
* denotes p < 0.05, ** denotes p < 0.01, and *** denotes p < 0.001.
Table 4b: Bootstrapped Pearson correlations between STRAQ-1 Subscales and Emotion Regulation Variables.
Self-Control Nostalgia
Proneness Alexithymia EOT Alexithymia DIDF
High Temperature Sensitivity –0.172*** 0.0977*** 0.0390 0.1548***
Social Thermoregulation 0.0034 0.1263*** –0.163*** 0.0231
Solitary Thermoregulation –0.040 0.1578*** –0.103*** 0.0596*
Risk Avoidance –0.042 0.0937*** 0.1285*** 0.2458***
* denotes p < 0.05, ** denotes p < 0.01, and *** denotes p < 0.001.
Table 4c: Correlations between STRAQ-1 Subscales and Social Environment Variables.
Monogamy ID Network Size Complex Social
Integration Social Embeddedness in Network
High Temperature Sensitivity –0.000 –0.105*** –0.046 –0.022
Social Thermoregulation –0.014 0.1016*** –0.010 0.1867***
Solitary Thermoregulation 0.0428 0.0446 0.0499 0.1194***
Risk Avoidance 0.0316 –0.126*** 0.0329 –0.022
* denotes p < 0.05, ** denotes p < 0.01, and *** denotes p < 0.001.
Table 4d: Correlations between STRAQ-1 Subscales and Environment Variable.
Average Humidity
of Test Day Temperature Minimum of Test Day
Distance
from Equator TemperatureCore Body
High Temperature Sensitivity –0.033 0.2752*** –0.322*** 0.0260
Social Thermoregulation –0.102*** –0.068** 0.0318 –0.036
Solitary Thermoregulation –0.038 –0.046 0.0356 0.0836**
Risk Avoidance –0.025 0.2058*** –0.218*** 0.0942***
* denotes p < 0.05, ** denotes p < 0.01, and *** denotes p < 0.001.
Table 4e: Correlations between STRAQ-1 Subscales and “person variables”.
Age Health Height Weight Stress
High Temperature Sensitivity 0.1313*** –0.109*** 0.0260 0.1190*** 0.1528***
Social Thermoregulation 0.0455 0.1048*** 0.0169 0.0023 –0.011
Solitary Thermoregulation 0.0735** –0.051* –0.215*** –0.282*** 0.1112***
Risk Avoidance 0.2215*** –0.114*** –0.081** –0.054* 0.2381***
Table 4f:
Mean
±
SD for Sex, Sexual Orientation and being or not being in a Relationship.
Sex
Sexual Orientation
Relationship Status
Male
Female
p-value
Hetero
-sexual
Other
p-value
In a
Relationship
Single
p-value
High T
emperature Sensitivity
3.2
1 (
±
0.69)
3.07 (
±
0.7
1)
0.0004
***
3.11
(
±
0.69)
3.16
(
±
0.80)
0.39
3.08 (
±
0.72)
3.16
(
±
0.68)
0.022
*
Social Thermoregulation
3.00 (
±
0.77)
3.11
(
±
0.79)
0.007
**
3.07 (
±
0.77)
3.2
1 (
±
0.90)
0.06
3.24 (
±
0.75)
2.88 (
±
0.8)
2.3E-1
8***
Solitar
y Thermoregulation
3.05 (
±
0.57)
3.4
1 (
±
0.58)
1.03E-26
***
3.30 (
±
0.59)
3.27 (
±
0.67)
0.43
3.32 (
±
0.59)
3.27 (
±
0.6
1)
0.11
Risk A
voidance
3.15
(
±
0.7
4)
3.14
(
±
0.7
1)
0.48
3.14
(
±
0.72)
3.15
(
±
0.77)
0.48
3.10
(
±
0.72)
3.19
(
±
0.72)
0.
011
*
Differences were tested with t-test using bootstrap cross validation and
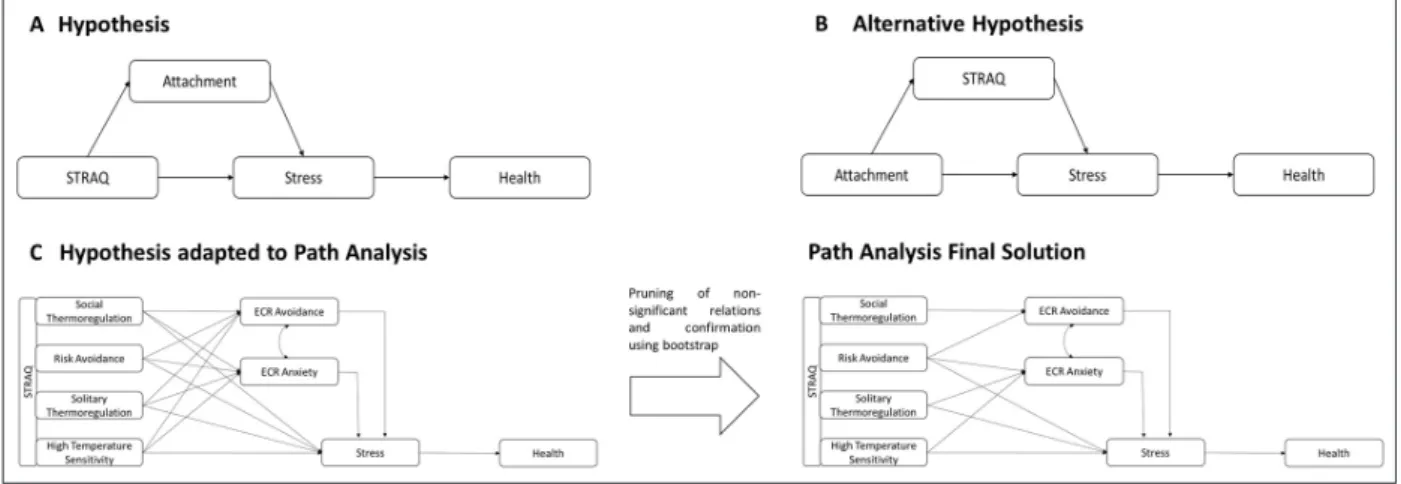
attachment, but also to check whether the STRAQ-1 logi-cally relates to measures that we suspected it to relate to (like attachment and health). In order to most accurately model the link of STRAQ-related needs to attachment experiences, we relied on multiple, converging analyses (starting with Figure 1). The overall logic was again to run a number of exploratory-confirmatory analyses through naïve bootstrapping to understand 1) which subscales were best associated to attachment avoidance and ment anxiety, 2) how the STRAQ-1 is related to attach-ment, and 3) whether the STRAQ-1’s inclusion in a model where attachment predicts stress and health improves explained variance. We again ran a series of analyses to most accurately capture the STRAQ-1’s meaning. Given that all the STRAQ-1’s subscales correlated reliably with attachment (i.e., confirmed through bootstrap; see Table 5), we anticipated that the STRAQ-1’s subscales would suc-cessfully predict attachment.
Our final model is presented in Figure 2. The path anal-ysis model presented significant results for a chi square test (χ²(10, N = 1504) = 43.72, p < .001). Usually this sug-gests a bad global fit, but rejecting the null hypothesis with this sample size is virtually impossible, as mentioned above. Results from our path analysis did present good fit by means of all other diagnostics that are not sensitive to sample size (CFI = 0.974, TLI = 0.942, RMSEA = 0.047 (C.I.
90%: 0.034–0.062), and SRMR = 0.029). In other words, our model was robust.
Our final model shows that Attachment Avoidance relates to Social Thermoregulation and Risk Avoidance. Attachment Anxiety relates to Risk Avoidance, Solitary Thermoregulation, and High Temperature Sensitivity. In our model, Attachment Avoidance and Anxiety medi-ated the relationship between all STRAQ-1’s subscales and self-reported stress (and self-reported health thereafter). All STRAQ-1 subscales but Social Thermoregulation pre-sented both a direct and indirect effect onto self-reported stress through Attachment. Overall these results support our conjecture that whether or not STRAQ-1 related needs are met shapes people’s attachment styles, in turn influ-encing their health.
Cross-Sample Variability
We explored cross-cultural variability in various ways. A first indication that STRAQ-1 related habits differ across cultures is the correlation between distance from the equator and Risk Avoidance (r = –.21, p < .001), and High Temperature Sensitivity (r = –.32, p < .001), meaning that people further from the equator – in our sample – report being less risk avoidant and less sensitive to higher temperatures. We don’t have a good explanation for this effect yet.
Figure 1: Schematic overview of our proposed model (A), a competing model (B), and how our proposed model (A) was adapted through pruning in our path analysis to our final solution (C).
Second, we tested whether the STRAQ-1 presented invari-ance across languages to explore whether the STRAQ-1 measured the same construct across these languages. We calculated a multi-group analysis using language fam-ily as grouping factor to evaluate the degree in which the instrument measures the same constructs for different sites, a property called measurement invariance (Putnkik & Borstein, 2016). This is achieved by imposing restrictions of equality in a stepwise form and then comparing changes in model fit until it decreases significantly: First restrictions are imposed to its structure, then to factor loadings and to inter-cepts and finally to residuals. A Scaled Chi-Square difference test of model fit was calculated to compare the model at each step with restrictions (Satorra & Bentler, 2001).
When restrictions were imposed to the factorial struc-ture across groups, no significant differences in model fit were found (X2diff = 441.84, Df diff = 440, p = .466);
how-ever, when restrictions were imposed to factor loadings across groups a significant decrease in model fit from the previous model was found (X2diff = 402.11, Df diff = 46,
p < .05). This can indicate that the same factor structure could be attributed between groups, but that a different meaning is assigned to some of the items between lan-guage families. However, most STRAQ-1 subscales corre-late with one another, introducing difficulties to properly attribute variance to each subscale.
We cannot be entirely sure what the cause is based on measurement invariance. The correlation between
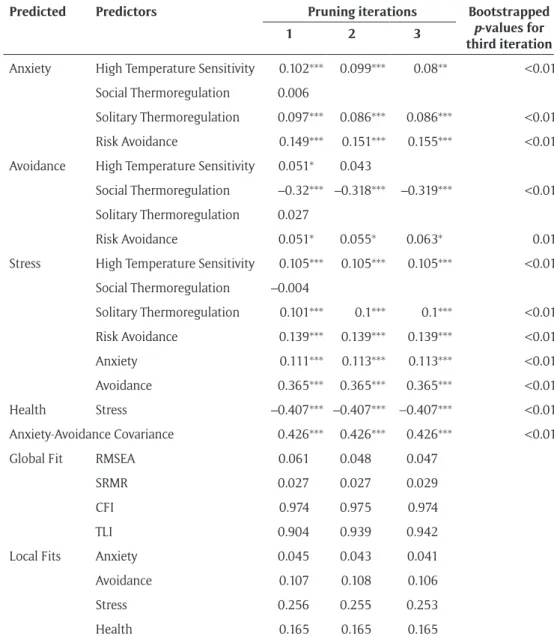
Table 5: Iterative Path Analysis procedure to prune non-significant relations.
Predicted Predictors Pruning iterations Bootstrapped p-values for third iteration
1 2 3
Anxiety High Temperature Sensitivity 0.102*** 0.099*** 0.08** <0.01
Social Thermoregulation 0.006
Solitary Thermoregulation 0.097*** 0.086*** 0.086*** <0.01
Risk Avoidance 0.149*** 0.151*** 0.155*** <0.01
Avoidance High Temperature Sensitivity 0.051* 0.043
Social Thermoregulation –0.32*** –0.318*** –0.319*** <0.01
Solitary Thermoregulation 0.027
Risk Avoidance 0.051* 0.055* 0.063* 0.01
Stress High Temperature Sensitivity 0.105*** 0.105*** 0.105*** <0.01
Social Thermoregulation –0.004
Solitary Thermoregulation 0.101*** 0.1*** 0.1*** <0.01
Risk Avoidance 0.139*** 0.139*** 0.139*** <0.01
Anxiety 0.111*** 0.113*** 0.113*** <0.01
Avoidance 0.365*** 0.365*** 0.365*** <0.01
Health Stress –0.407*** –0.407*** –0.407*** <0.01
Anxiety-Avoidance Covariance 0.426*** 0.426*** 0.426*** <0.01
Global Fit RMSEA 0.061 0.048 0.047
SRMR 0.027 0.027 0.029
CFI 0.974 0.975 0.974
TLI 0.904 0.939 0.942
Local Fits Anxiety 0.045 0.043 0.041
Avoidance 0.107 0.108 0.106
Stress 0.256 0.255 0.253
Health 0.165 0.165 0.165
The column named ‘Predicted’ presents the variable that we tried to estimate using variables from the column named ‘Predictors’.
We present the standardize coefficient for each path analysis with *p < 0.05, **p < 0.01, ***p < 0.001. Variables that were not included
because of pruned are left blank. We also included the covariance estimation between Anxiety and Avoidance. At the bottom of the
table we present the global fits for each iteration and validation step. We also included local fits (R2) for each regression model for
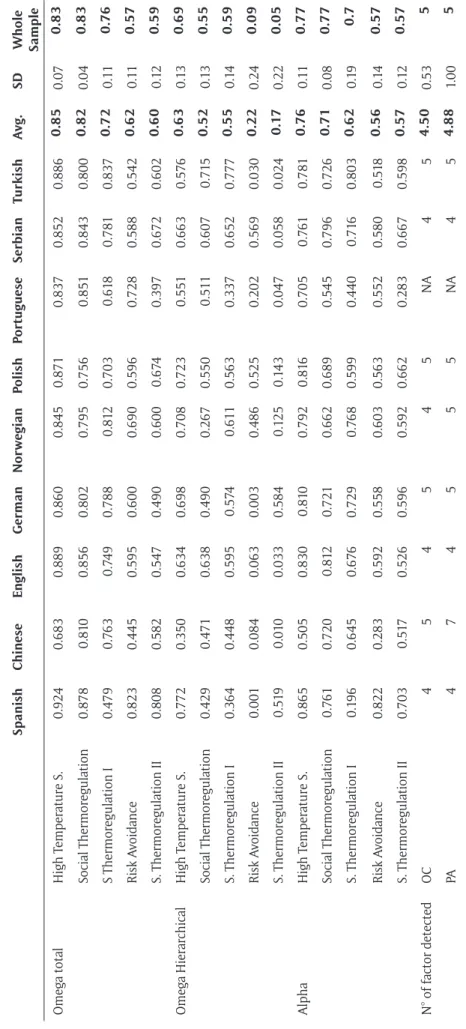
subscales and how these correlations vary across sites represents a major problem to properly estimate meas-urement invariance. For this reason, we used an alter-native strategy, replicating STRAQ-1 internal validity across the different locations sampled to assess its con-sistency across languages. We first checked robustness of the number of factors based on Parallel Analyses and Optimal Coordinates. We then compared how internal consistencies measured through Cronbach’s Alpha, Total Omega, and Hierarchical Omega across samples of different languages. The optimal solution for most samples was four or five factors (the second Solitary Thermoregulation factor starts loading onto other fac-tors). The average of internal consistencies across lan-guages were consistent when compared with the results of the full sample (Table 6). Only Hierarchical Omegas showed strong discrepancies between country samples and full sample. Hierarchical Omega measures the low-est possible bound of internal consistency, being sensi-ble to hierarchical structures where the general factor might be decomposed into some other minor factors. Given our results, we suspect that the covariances among items across languages present important variations, captured by Hierarchical Omega. This is also consistent with the measurement invariance results, suggesting that we have proper general factors (current subscales), but that items should be further tuned across language and cultures.
In short, measurement invariance could not be detected because loadings were somewhat different across lan-guages, but, in some cases, different crossloadings across different countries were detected. This simply suggests that in some languages, some items of those subscales tend to be more related to one another than in other languages. These results are expected, given the oblique solution of the factor analysis which allows them to cor-relate. Furthermore, internal consistency analysis by assessing the Total Omega Coefficient suggests that High Temperature Sensitivity and Social Thermoregulation pre-sented robust internal consistency across samples. Risk Avoidance, Solitary Thermoregulation presented high variability and lower values of internal consistency. The results of this process are summarized in Table 6. Taken altogether, these results suggest that the STRAQ-1 has a stable internal structure throughout different the lan-guages tested.
Discussion
Are thermoregulation and risk avoidance organizing constructs of attachment? Our report strongly sug-gests they are. We created a large pool of items from which we found a reliable 4-factor solution, comprised of Social Thermoregulation, High Temperature Sensi-tivity, Solitary Thermoregulation, and Risk Avoidance. These STRAQ-1 subscales reliably related to attachment avoidance and anxiety. Furthermore, we also obtained robust relationships between the STRAQ-1 and con-structs often found to relate very closely with attach-ment (e.g., self-control, alexithymia, stress, and health). Altogether, these results converge with what we know
from animals other than humans: thermoregulation and risk avoidance are crucial for security in relationships. Further, social thermoregulation and risk avoidance are not only central to survival, our findings also suggest that they can be considered a cornerstone for healthy ( psychological) development. But of course, all our find-ings are correlational and our inferences are based on theoretical assumptions.
Measuring the biological drives supporting attachment formation: Caveats and questions
Perhaps one of the more important caveats is that, a pri-ori, we had thought a kind of ‘Social Metabolism’ to be linked to attachment. After all, attachment avoidance has been linked before to levels of fasting glucose, which has been based on the argument that people who are avoid-ant mobilize more energy to cope with their (social) world (Ein-Dor et al., 2015). We detected one subscale, but as it counted fewer than three items, we chose not to retain this subscale. It is worth investigating in future iterations whether Social Metabolism is a separate factor from Social Thermoregulation or Risk Avoidance.
A second important theoretical caveat is that our data-set is cross-sectional and causal links can only be derived based on theoretical grounds. But as Bollen and Pearl (2013) suggest, it is possible to make causal inferences about cross-sectional data, as ‘[causal] assumptions derive from prior studies, research design, scientific judgment, logical arguments, temporal priorities, and other evidence that the researcher can marshal in support of them’. On the basis of prior research, we had strong assumptions about the direction of our model. That is, STRAQ-1 drives should predict attachment and not the other way around. This is what we found.
The most evident drawback of the STRAQ is the internal consistency of Risk Avoidance (Cronbach’s Alpha: 0.57, Total Omega: 0.57, Hierarchical Omega: 0.09). However, different factor structures were found across different languages. The data from our Western samples (the sam-ples from United Kingdom, Germany, the United States, Norway, Poland) fit our a priori assumptions and resem-bles the whole sample solution reported. However, in our Chinese sample we found that some Social and Solitary Thermoregulation subscales break into more factors (meaning that the concept of being energized by being alone or by others is affected by culture). Of course, these differences affect the overall internal consistency of the scales. The source of this is not entirely clear. Looking at our cross-cultural explorations it is possible that not all items are ideal for all countries and this presents a major reason for further improvement.
Table 6:
Factor solutions compared at all different languages with samples >80 (S. Thermoregulation II represents Solitar
y Thermoregulation under Stress).
Spanish Chinese English German Nor wegian Polish Portuguese Serbian Turkish A vg. SD
Whole Sample
Omega total High T emperature S. 0.924 0.683 0.889 0.860 0.845 0.87 1 0.837 0.852 0.886 0.85 0.07 0.83 Social Thermoregulation 0.878 0. 810 0.856 0.802 0.795 0.756 0.85 1 0.843 0.800 0.82 0.04 0.83
S Thermoregulation I
0.479 0.7 63 0.7 49 0.788 0. 812 0.703 0. 618 0.78 1 0.837 0.72 0.11 0.7 6 Risk A voidance 0.823 0.445 0.595 0.600 0.690 0.596 0.728 0.588 0.542 0.62 0.11 0.57
S. Thermoregulation II
0.808 0.582 0.547 0.490 0.600 0.67 4 0.397 0.672 0.602 0.60 0.12 0.59 Omega Hierarchical High T emperature S. 0.772 0.350 0.634 0.698 0.708 0.723 0.55 1 0.663 0.57 6 0.63 0.13 0.69 Social Thermoregulation 0.429 0.47 1 0.638 0.490 0.267 0.550 0. 511 0.607 0. 715 0.52 0.13 0.55
S. Thermoregulation I
0.364 0.448 0.595 0.57 4 0. 611 0.563 0.337 0.652 0.777 0.55 0.14 0.59 Risk A voidance 0.00 1 0.084 0.063 0.003 0.486 0.525 0.202 0.569 0.030 0.22 0.24 0.09
S. Thermoregulation II
0. 519 0. 010 0.033 0.584 0.12 5 0.14 3 0.047 0.058 0.024 0 .17 0.22 0.05 Alpha High T emperature S. 0.865 0.505 0.830 0. 810 0.792 0. 816 0.705 0.7 61 0.78 1 0.7 6 0.11 0.77 Social Thermoregulation 0.7 61 0.720 0. 812 0.72 1 0.662 0.689 0.545 0.796 0.726 0.7 1 0.08 0.77
S. Thermoregulation I
0.19 6 0.645 0.67 6 0.729 0.7 68 0.599 0.440 0. 716 0.803 0.62 0.19 0.7 Risk A voidance 0.822 0.283 0.592 0.558 0.603 0.563 0.552 0.580 0. 518 0.56 0.14 0.57
S. Thermoregulation II
0.703 0. 517 0.526 0.596 0.592 0.662 0.283 0.667 0.598 0.57 0.12 0.57
N° of factor detected
OC 4 5 4 5 4 5 NA 4 5 4.50 0.53 5 PA 4 7 4 5 5 5 NA 4 5 4.88 1.00 5 W
e present here the factors extraction suggested by O.P
. and P
.A. and internal consistency of the subscales (T
as attachment (Harkness, 2015; Quinn & Mageo, 2013; Röttger-Rössler, 2014). For instance, a meta-analysis of the Strange Situation conducted by Van IJzendoorn and Kroonenberg (1988) suggested that in Western European countries the A classifications (insecure avoidant) emerge as relatively more prevalent, while in Israel and in Japan the C classifications (insecure ambivalent/resistant) emerged as relatively more frequent.
Cultural differences in attachment are expected and it should come as no surprise that the first iteration of the STRAQ-1 has difficulties in one of the subscales. Nevertheless, the other STRAQ-1 subscales proved robust. More importantly, the STRAQ-1 could pick up differences that the ECR could not. In other words, the STRAQ-1 allows us to analyze the mechanisms by which attachment is formed. And finally and notably, when we conducted out-of-sample testing in a French sample, 1) we again found the subscale to be robust, 2) we again found a relationship between Social Thermoregulation and attachment avoidance, and 3) we found a first indica-tion that this Thermoregulaindica-tion subscale may moderate the link between temperature manipulation and think-ing about loved ones (IJzerman, Neyroud, et al., 2018). In other words, the STRAQ-1 was validated in a country that was not included in our sample of 12 countries.
Conclusions
To date, adult attachment has been measured by tapping into self-reported feelings of security (e.g., through the Adult Attachment Scale (AAS) (Collins & Read, 1990); the Relationships Scales Questionnaire (RSQ) ( Bartholomew & Horowitz, 1991); the Peer Attachment Interview (PAI) ( Bartholomew & Horowitz, 1991); the Experiences in Close Relationships (ECR & ECR-R) (Brennan, Clark, & Shaver, 1998; Fraley et al., 2000); the Attachment Style Inter-view (ASI) (Bifulco, Lilie, Ball, & Moran, 1998); and/or the Adult Attachment Interview (AAI) (George, Kaplan, & Main, 1996). The STRAQ-1 represents – to our knowledge – the first assessment tool to understand how internal models/attachment styles are reliant on biological drives. The STRAQ-1 thus allows us to infer how basic biological drives shape attachment and will thus help us better appre-ciate attachment across cultures and physical environments. But we also need to be clear: Prospective studies are needed to establish causal relationships between the two.
The STRAQ-1 now consists of a number of a few highly robust subscales assessed in 12 different countries that assess habits related to Social Thermoregulation, Solitary Thermoregulation, and High Temperature Sensitivity (and one that is somewhat less robust: Risk Avoidance). The two items central to our Social Thermoregulation subscale (‘I prefer to warm up with someone rather than with something’ and ‘I like to warm up my hands or feet by touching someone who I am close to’) reflect the need to warm up physically and an affective component more evidently related to an attachment-like relation. The items related to solitary thermoregulation (e.g., ‘When it is cold, I more quickly turn up the heater than others’) captured strategies to cope with thermal stress alone and to compensatory behaviors due to the lack of other
means of thermoregulation (thus representing not being able to rely on others for this). Finally, items related to High Temperature Sensitivity captured both the prefer-ence for colder temperatures and the distaste for hotter temperatures. Interestingly, only the thermoregulatory drive fulfilled through social interactions was able to predict ECR formalization of attachment, while the non-social strategies predicted directly self-perceived stress, remarking the need of accounting for the biological drives of attachment.
We are strongly convinced that the STRAQ-1 helps us understand attachment above and beyond exist-ing measures and this assumption is supported by our data. Further, despite the somewhat lower internal reli-abilities across countries, one should be reminded that the STRAQ-1 was developed and validated using samples from 12 different countries. In other words, using the entire instrument available, at the moment, is the best option to measure STRAQ-1 related drives. This permits a much greater robustness than scale development in most instances and allows us much better to infer how biologi-cal drives shape attachment processes. STRAQ-1 was able to predict stress variability that was not explained by ECR (direct effects of Figure 2), therefore impacts over health. This underlines the psychological value of social ther-moregulation and risk avoidance by showing that proper risk avoidance and thermoregulatory behaviors reduced perceived stress and improve health, thereby stressing the psychological value of social thermoregulation and risk avoidance.
Future Directions
We believe that the STRAQ-1 will help us better diag-nose potentially maladaptive relationship behaviors, and, ultimately, will allow therapists to develop much more accurate biofeedback interventions when insecure attachments become destructive towards one’s health (cf., IJzerman, Heine, Nagel, & Pronk,, 2017).1
Yet it is also clear that further steps can be taken to improve the reliability of the STRAQ-1, thus allowing us to even better understand how attachment is shaped. An important component is to know the desire (e.g., ‘I only cuddle if I am cold’) versus the confidence that other will be there to resolve the cold. Further, it is clear that we did not yet capture the full range of biological drives. One important one, the sharing of food, needs to be included as well. Finally, future developments should not only focus on letting different cultures self-generate items (so as to make them more culturally appropriate) but also on other aspects that help us understand what environmen-tal factors can help shape attachment security, like dis-ease prevalence (Schaller & Murray, 2008), physical safety, and temperature. Knowing how well others help regulate these environmental demands will ultimately help us as researchers capture how attachment is shaped.
Data Accessibility Statement
Note
1 In order to facilitate its use, we include an info sheet
in Appendix B.1 in the Supplemental Materials, which includes descriptions of the scale, norm scores, and feedback for online use. We also direct the reader to the different translations (in English, German, Polish, Turkish, Portuguese, Norwegian, Mandarin, Spanish, and Serbian), which are available on the Human Pen-guin Project project page (https://osf.io/2rm5b/).
Additional File
The additional file for this article can be found as follows:
• Supplementary Materials. These supplemental materials are meant to complement Vergara et al.’s STRAQ-1. It includes additional information on the methods, analysis approach, and includes some additional results. DOI: https://doi.org/10.5334/ irsp.222.s1
Acknowledgements
We thank Uli Schimmack, Eiko Fried, Adam Fetterman, Jaime Derringer, Brent Roberts, and Chris Fraley for their feedback on this article. All remaining mistakes are the authors’ responsibility.
Funding Information
This work was partly supported by postdoctoral FON-DECYT grant (3160403) to Rodrigo Vergara and a Veni grant (016.145.049) and a French National Research Agency ‘Investissements d’avenir’ program grant (ANR-15-IDEX-02) both awarded to Hans IJzerman.
Competing Interests
HIJ is writing a popular science book on social thermoreg-ulation. All other authors have no competing interests.
Author Information
RCV and HIJ conceived of the idea and designed the study. SL provided feedback on the ideas and the design of the study. RCV, CH, and FJG conducted all the analyses for this project. RCV, CH, and FJG wrote the first draft of the paper. HIJ rewrote the paper and SL provided several rounds of critical feedback. RAK conducted two different rounds of code review.
References
Ainsworth, M. S., Blehar, M. C., Waters, E., & Wall, S. N. (1978). Patterns of attachment: A psychological study of the strange situation. Child Development, 41, 49–67. DOI: https://doi.org/10.1002/1097- 0355
Armsden, G. C., & Greenberg, M. T. (1987). The Inven-tory of Parent and Peer Attachment: Individual differences and their relationship to psychologi-cal well-being in adolescence. Journal of Youth and Adolescence, 16, 427–454. DOI: https://doi. org/10.1007/BF02202939
Bartholomew, K., & Horowitz, L. M. (1991). Attachment styles among young adults: A
test of a four-category model. Journal of Personal-ity and Social Psychology, 61, 226–244. DOI: https:// doi.org/10.1037/0022-3514.61.2.226
Bateson, M., Brilot, B., & Nettle, D. (2011). Anxiety: An evolutionary approach. Canadian Journal of Psychiatry, 56, 707–715. DOI: https://doi. org/10.1177/070674371105601202
Beckes, L., & Coan, J. A. (2011). Social Baseline The-ory: The role of social proximity in emotion and economy of action. Social and Personality Psy-chology Compass, 5, 976–988. DOI: https://doi. org/10.1111/j.1751-9004.2011.00400.x
Bernaards, C. A., & Jennrich, R. I. (2005). Gradient projection algorithms and software for arbitrary rotation criteria in factor analysis. Educational and Psychological Measurement, 65, 676–696. Retrieved from http://www.stat.ucla.edu/research/gpa. DOI: https://doi.org/10.1177/0013164404272507 Bertram, B. C. R. (1980). Vigilance and group size in
ostriches. Animal Behaviour, 28, 278–286. DOI: https://doi.org/10.1016/S0003-3472(80)80030-3 Bifulco, A., Lilie, A., Ball, B., & Moran, P. (1998).
Attach-ment style interview (ASI): Training manual. London: Royal Holloway.
Bollen, K. A., & Pearl, J. (2013). Eight myths about causal-ity and structural equation models. In S. Morgan (Ed.), Handbook of causal analysis for social research (pp. 301–28). Dordrecht, the Netherlands: Springer. DOI: https://doi.org/10.1007/978-94-007-6094-3_15 Bowlby, J. (1969). Attachment, Vol. 1 of Attachment and
loss. New York: Basic Books.
Brennan, K. A., Clark, C. L., & Shaver, P. R. (1998). Self-report measurement of adult attachment: An inte-grative overview. In J. A. Simpson & W. S. Rholes (Eds.), Attachment theory and close relationships (pp. 46–76). New York, NY, US: Guilford Press.
Brislin, R. W. (1970). Back-translation for cross-cultural research. Journal of Cross-Cultural Psychology, 1, 185–216. DOI: https://doi. org/10.1177/135910457000100301
Budaev, S. V. (2010). Using principal components and factor analysis in animal behaviour research: Cave-ats and guidelines. Ethology, 116, 472–480. DOI: https://doi.org/10.1111/j.1439-0310.2010.01758.x Burisch, M. (1984). Approaches to personality inven-tory construction: A comparison of merits. Ameri-can Psychologist, 39, 214–227. DOI: https://doi. org/10.1037/0003-066X.39.3.214
Cannon, B., & Nedergaard, J. (2004). Brown Adipose Tis-sue: Function and physiological significance. Physi-ological Reviews, 84, 277–359. DOI: https://doi. org/10.1152/physrev.00015.2003
Coan, J. A., Beckes, L., & Allen, J. P. (2013). Childhood maternal support and social capital moderate the regulatory impact of social relationships in adult-hood. International Journal of Psychophysiology, 88, 224–231. DOI: https://doi.org/10.1016/j. ijpsycho.2013.04.006
to threat. Psychological Science, 17, 1032–1039. DOI: https://doi.org/10.1111/j.1467-9280.2006.01832.x Cohen, S., Doyle, W. J., Skoner, D. P., Rabin, B. S., & Gwaltney, J. M. (1997). Social ties and sus-ceptibility to the common cold. Jama, 277, 1940–1944. DOI: https://doi.org/10.1001/ jama.1997.03540480040036
Cohen, S., & Wills, T. A. (1985). Stress, social sup-port, and the buffering hypothesis. Psycho-logical Bulletin, 98, 310–357. DOI: https://doi. org/10.1037/0033-2909.98.2.310
Collins, N. L., & Read, S. J. (1990). Adult attach-ment, working models, and relationship qual-ity in dating couples. Journal of Personality and Social Psychology, 58, 644–663. DOI: https://doi. org/10.1037/0022-3514.58.4.644
Ebensperger, L. A. (2001). A review of the evolutionary causes of rodent group-living. Acta Theriologica, 46, 115–144. DOI: https://doi.org/10.1007/BF03192423 Ein-Dor, T., Coan, J. A., Reizer, A., Gross, E. B., Dahan,
D., Wegener, M. A., … Zohar, A. H. (2015). Sug-arcoated isolation: Evidence that social avoidance is linked to higher basal glucose levels and higher consumption of glucose. Frontiers in Psychology,6. https://doi.org/10.3389/fpsyg.2015.00492
Ein-Dor, T., Mikulincer, M., & Shaver, P. R. (2011). Effective reaction to danger: Attachment insecu-rities predict behavioral reactions to an experi-mentally induced threat above and beyond general personality traits. Social Psychological and Personality Science, 2, 467–473. DOI: https://doi. org/10.1177/1948550610397843
Fabrigar, L. R., Wegener, D. T., MacCallum, R. C., & Strahan, E. J. (1999). Evaluating the use of explora-tory factor analysis in psychological research. Psy-chological Methods, 4, 272–299. DOI: https://doi. org/10.1037/1082-989X.4.3.272
Fraley, R. C., Waller, N. G., & Brennan, K. A. (2000). An item response theory analysis of self-report meas-ures of adult attachment. Journal of Personality and Social Psychology, 78, 350–365. DOI: https://doi. org/10.1037/0022-3514.78.2.350
George, C., Kaplan, N., & Main, M. (1996). Adult Attach-ment Interview. Unpublished Manuscript (Third Edition).
Gilbert, C., McCafferty, D., Le Maho, Y., Martrette, J. M., Giroud, S., Blanc, S., & Ancel, A. (2010). One for all and all for one: the energetic benefits of huddling in endotherms. Biological Reviews, 85(3), 545–569. DOI: https://doi.org/10.1111/j.1469-185X.2009.00115.x Griffin, D. W., & Bartholomew, K. (1994). The meta-physics of measurement: The case of adult attach-ment. In K. Bartholomew & D. Perlman (Eds.), Advances in personal relationships: Vol. 5. Attach-ment processes in adulthood (pp. 17–52). London: Jessica Kingsley.
Harkness, S. (2015). The Strange Situation of attachment research: A review of three books. Reviews in Anthro-pology, 44, 178–197. DOI: https://doi.org/10.1080/ 00938157.2015.1088337
Harrell, F. E., & Dupont, C. (2016). Hmisc. Retrieved from https://cran.r-project.org/package=Hmisc
Harris, P. B., Brown, B. B., & Werner, C. M. (1996). Pri-vacy regulation and place attachment: Predicting attachments to a student family housing facility. Journal of Environmental Psychology, 16, 287–301. DOI: https://doi.org/10.1006/jevp.1996.0025 Hazan, C., & Zeifman, D. (1999). Pair bonds as
attach-ments: Evaluating the evidence. In J. Cassidy & P. R. Shaver (Eds.), Handbook of attachment: Theory, research, and clinical applications (pp. 336–354). New York, NY, US: Guilford Press.
Henriksen, R. E., Torsheim, T., & Thuen, F. (2014). Lone-liness, social integration and consumption of sugar-containing beverages: Testing the Social Baseline Theory. PLoS ONE, 9. DOI: https://doi.org/10.1371/ journal.pone.0104421
Hu, C. P., Yin, J. X., Lindenberg, S., Dalğar, İ., Weissgerber, S. C., Vergara, R. C., … IJzerman, H. (2019). Data from the Human Penguin Project, a cross-national dataset testing social thermoregula-tion principles. Scientific Data, 6, 32. DOI: https:// doi.org/10.1038/s41597-019-0029-2
Hu, L. T., & Bentler, P. M. (1999). Cutoff criteria for fit indexes in covariance structure analysis: Conven-tional criteria versus new alternatives. Structural Equation Modeling, 6, 1–55. DOI: https://doi. org/10.1080/10705519909540118
Iacobucci, D. (2010). Structural equations modeling: Fit Indices, sample size, and advanced topics. Journal of Consumer Psychology, 20, 90–98. DOI: https://doi. org/10.1016/j.jcps.2009.09.003
IJzerman, H., Coan, J. A., Wagemans, F. M. A., Missler, M. A., Van Beest, I., Lindenberg, S., & Tops, M. (2015). A theory of social thermoregulation in human primates. Frontiers in Psychology, 6, 1–17. DOI: https://doi.org/10.3389/fpsyg.2015.00464 IJzerman, H., Heine, E. C., Nagel, S. K., & Pronk, T.
M. (2017). Modernizing relationship therapy through Social Thermoregulation Theory: Evi-dence, hypotheses, and explorations. Frontiers in Psychology, 8. DOI: https://doi.org/10.3389/ fpsyg.2017.00635
IJzerman, H., & Hogerzeil, L. J. (2017). People as pen-guins: Thermoregulation as part of the human essence. In M. van Zomeren & J. Dovidio (Eds.), Oxford Handbook of Human Essence. Oxford Uni-versity Press. DOI: https://doi.org/10.31234/osf.io/ zrtg6
IJzerman, H., Lindenberg, S., Dalğard, İ., Weissgerber, S. C., Vergara, R. C., Cairo, A. H., … Zickfeld, J. H. (2018). The Human Penguin Project: Climate, social integration, and core body temperature. PsyArXiv Preprints. DOI: https://doi.org/10.17605/OSF. IO/6B7NE