TECHNICAL UNIVERSITY OF CLUJ-NAPOCA
ACTA TECHNICA NAPOCENSIS
Series: Applied Mathematics, Mechanics, and Engineering Vol. 61, Issue IV, November, 2018
COMPUTATIONAL FLUID DYNAMIC ANALYSES OF WIND TURBINES
FOR SOKE REGION
Ismail BOGREKCI, Pinar DEMIRCIOGLU, Hilmi Saygin SUCUOGLU, Asli GULTEKIN, Emrah GUVEN
Abstract: Wind turbines are very important electro-mechanical devices converting the wind's kinetic energy into electrical energy. Due to poor configurations in design and layout of wind turbines, energy cannot be harvested efficiently. Therefore, this study focused on the optimization of four different configurations using Computational Fluid Dynamics (CFD). The solid state models of the wind turbines were created and all components were assembled using Autodesk Inventor. Four different configurations such as in-line, side-by-side, triangular and diagonal were conceptually planned and implemented in simulations. The weather data for Soke Region were obtained. These data were used as an input to CFD calculations. CFD computations were conducted by Fluent Analysis Software in Ansys in order to find the best pattern. These configurations were tested using wind speed values obtained from the weather data. Furthermore, the calculation performance of CFD with a rectangular enclosure type was investigated. The obtained results showed that diagonal and triangular patterns had better harvesting capacity than the others
Key words: Coal Mine Conveyor, Discrete Element Method, Finite Element Analysis, Granular Material.
1. INTRODUCTION
Renewable energy is the energy that can be obtained permanently from the natural sources energy flow and which can be used continuously. Wind is generated from the temperature and the pressure difference due to the solar energy. Wind is the relative movement of the air stream displaced from the high pressure area to the low pressure area with respect to the earth surface. Wind energy is given to the kinetic energy obtained from the motion of the air stream. Kinetic energy of wind converts from mechanical energy and that mechanical energy is converted into electrical energy [1]. Wind turbine components consist of tower, blades, rotor, gearbox, generator and electrical-electronics components [2].
The wind farm is formed by placing many wind turbines in a determined area. Wind turbine locations are determined to form the most efficient wind farm. Wind farm layout optimization aim is maximizing the total produced power of wind farm. Wake models
placement based on the wind distribution to maximize the wind energy capture was explored [11]. First constraint programming (CP) and mixed integer linear programming (MIP) models were developed for wind farm layout optimization [12].
In this study, four types of wind turbine layout were determined for wind farm with considering the parameters that affected the wind turbine efficiency. An optimization process was conducted to gain better results for wind farm layout by considering the parameters; time, layout effectiveness, generated electricity energy effectivity.
2. MATERIAL AND METHOD
2.1. Material
In order to determine the ideal materials for wind turbine, it should be taken account into some criteria’s. They are low density and weight to decrease the gravitational forces, high strength to meet strong wind loading, high fatigue resistance to endure cyclic load and high lightning resistance, etc. A detailed study on the Structural Analysis of composite wind turbine blade by using Glass-Epoxy as a material was carried out by researchers recently [13]. Glass-Epoxy is lightweight and strong enough; therefore, this material was selected for this case study.
2.2. Method
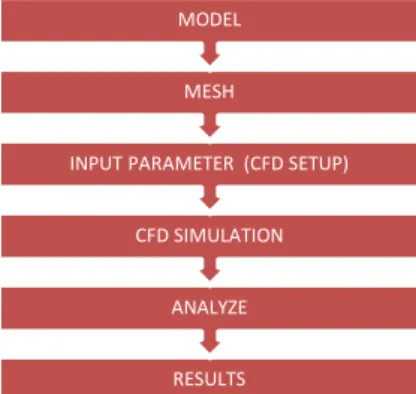
A computerized fluid simulation study was constructed and run in ANSYS Fluent Computational Fluid Dynamics (CFD) simulator with Fluid Flow (Fluent) to gain a better understanding of wind farm flows. Figure 1 represents the flowchart of processing and simulation in the ANSYS Workbench.
2.3. Design of Layout Optimization
Four different scenarios were conceptually planned and implemented for layout optimization in wind farm for considering Soke Region climate conditions.
Fig. 1. CFD processing and simulation in the ANSYS Workbench
Configuration 1: Wind turbines placed one behind the other (in-line).
Three wind turbines are aligned one behind the other as shown in Figure 2. The distance among turbines was selected as 5m.
Fig. 2. Configuration of the wind turbines placed one behind the other
Configuration 2: Wind turbines placed one beside the other (side-by-side).
Alternatively, the turbines one beside the other, to the direction of the headwind were placed (Figure 3). The distance among turbines was selected as 5m.
Fig. 3. Configuration of the wind turbines placed one beside the other
Configuration 3: Wind turbines placed along a triangular.
The third configuration is to place the turbines one beside the other, along a triangular, to the
RESULTS ANALYZE CFD SIMULATION INPUT PARAMETER (CFD SETUP)
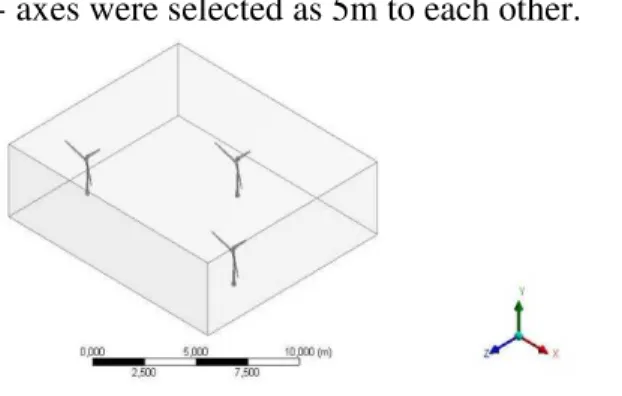
direction of the headwind, as shown in Figure 4. Most commercial wind farms use such configurations. The distances in x- and y- axes were selected as 5m to each other.
Fig. 4. Configuration of the wind turbines placed along a triangular
Configuration 4: Wind turbines placed along a diagonal.
Three wind turbines are placed along a diagonal as shown in Figure 5. The distances in x- and y- axes were selected as 5m to each other.
Fig. 5. Configuration of the wind turbines placed along a diagonal
2.4. Mathematical Calculations
The power calculations for each configuration in the wind farm can be determined using the below equation:
3 1
2 p
P= ×C ×ρ×A V×
Where;
P the electrical power produced (W),
ρ air density (kg/m3),
A swept area of wind turbine (m2),
V wind velocity (m/s),
Cp the power coeffcient.
1.38
R= m A=π×(1.38)2 =5.983m2
3
1.225kg m/
ρ=
0.4
Cp= [1].
3 1.225 5.98 (7.283) 1
0.4
2 566.26W
P= × × × × =
0.000566MW
P=
The power obtained from one wind turbine in Soke Region is 3MW. The rated power obtained from the wind turbine for analysis is 0.000566MW. The ratio between them is 5,297.918.
Wind velocity in Soke Region was taken as 10.56m/s. In present study, by assuming that turbine effciency (Cp) is 40% [1] and the
produced turbine power can be calculated as:
Configuration 1: Wind turbines placed one beside the other.
Velocity of each wind turbine is equal to 5.376 m/s. Therefore;
3
1.225 5.98 (5.376) 1
0.4
2 227.75W
P= × × × × =
0.00023MW
P=
Total power ;
3 0.00023 3 0.00068
T
P =P× = × = MW
5, 297.918 0.00068 5, 297.918 3.61
T
P =P× = × = MW
Configuration 2: Wind turbines placed one behind the other.
Velocity of each wind turbine=5.528 m/s
3
1.225 5.98 (5.528) 1
0.4
2 247.62W
P= × × × × =
0.00025MW
P=
Total power:
3 0.00025 3 0.00074
P× = × = MW
5, 297.918 0.00074 5, 297.918 3.93
T
P =P× = × = MW
Configuration 3: Wind turbines placed along a triangular.
Velocity of each wind turbine=5.633 m/s. Therefore;
3
1.225 5.98 (5.633) 1
0.4
2 262.00W
P= × × × × =
0.00026MW
P=
Total power:
3 0.00026 3 0.00078
P× = × = MW
5, 297.918 0.00078 5, 297.918 4.16
T
P =P× = × = MW
Velocity of each wind turbine=6.037m/s. Therefore;
3 1.225 5.98 (6.037) 1
0.4
2 322.51W
P= × × × × =
0.00032MW
P=
Total power:
3 0.00032 3 0.00097
P× = × = MW
5, 297.918 0.00097 5, 297.918 5.13
T
P =P× = × = MW
3. RESULTS
In this study, four types of wind turbine layout optimization were analysed using FEA-CFD Analyses. Since wind speed is the most crucial contributor to the power harvesting capacity of the wind turbines, the focus of study was obtaining the wind speeds on blades for each configurations.
Power calculations were performed for wind farm configuration types.
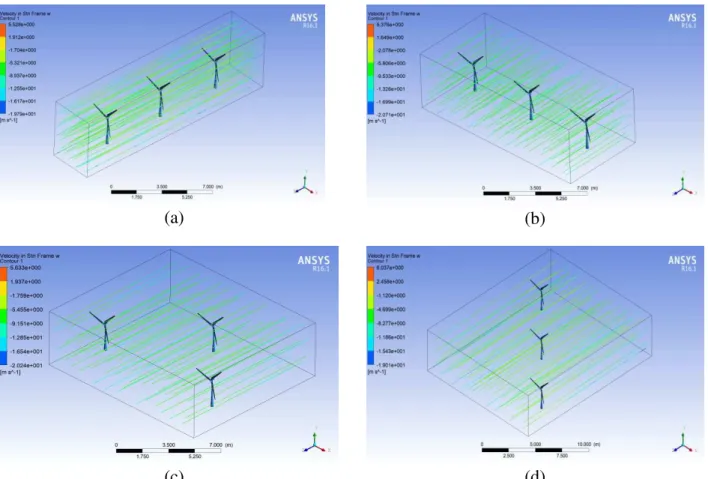
(a) (b)
(c) (d)
Fig. 6. The results of wind speed distribution on (a) Configuration 1, (b) Configuration 2, (c) Configuration 3 and (d) Configuration 4
Power production results for wind farm configuration types are given in Table 1. It is observed that diagonal and triangular type layouts produced more power than the others.
Table 1:
Power Production Results for Wind Farm Configuration Types
Wind Farm Configuration Types
Power (MW)
Configuration 1 3.61
Configuration 2 3.93
Configuration 3 4.16
Configuration 4 5.13
The results from CFD Analyses for the wind farm configuration types are depicted in Figure 6. It is understood that wind speed values are increasing in diagonal and triangular layouts.
In this study, four different configurations such as in-line, side-by-side, triangular and diagonal were conceptually planned and implemented in simulations. The weather data for Soke Region were obtained. These data were used as an input to CFD calculations. CFD computations were conducted by Fluent Analysis Software in Ansys in order to find the best pattern.
From the results, the following conclusions can be withdrawn;
1) The diagonal and triangular type layouts produced more power than the others (in-line and side-by-side).
2) The wind speed values are increasing in diagonal and triangular layouts.
3) The diagonal type wind turbine harvested the power of 5.13 MW. When comparing with other layouts, diagonal type wind turbine produced the highest power.
4) It is suggested to investigate the performance of CFD simulation by applying real environmental boundary conditions and shapes. 5) Furthermore, the calculation performance of CFD with two enclosure types such as rectangular and square should be investigated
5. REFERENCES
[1] Saptarshi, G., Pomali, B., Renewable energy, Survey, International Journal of Engineering Sciences & Research Technology, Vol.52, No.19, pp. 245-52, (2013).
[2] J.G. Slootweg., Henk P., Will L. K., Representing wind turbine electrical generating systems in fundamental frequency simulations. IEEE Transactions on energy conversion, Vol.18, No.4, pp. 516-524, (2003).
[3] Rabia, S., Abdur, R., Mohammad Yusri, H., Yuan-Kang, W., Wake effect modeling: A review of wind farm layout optimization using Jensen׳s model, Renewable and Sustainable Energy Reviews, Vol.58, pp. 1048-1059, (2016).
[4] Javier Serrano, G., Angel, G., José Castro, M., Jesús M. Riquelme, S., Manuel Burgos,
P., Optimization of wind farm turbines layout using an evolutive algorithm, Renewable energy, 35.8: pp.1671-1681, (2010).
[5] S.D.O, Turner., Peter Yun, Z., Timothy C.Y, C., David, R., Cristina H,A., A new mathematical programming approach to optimize wind farm layouts. Renewable Energy, Vol.63, pp. 674-680, (2014).
[6] Jinkyoo, P., Kincho H, L., Layout optimization for maximizing wind farm power production using sequential convex programming, Applied Energy, Vol.151, pp. 320-334, (2015).
[7] S.Ali, M., Amin Y., Wind farm layout optimization under uncertainty. Renewable Energy, Vol.107, pp. 288-297, (2017). [8] Xiaoxia, G., Hongxing, Y., Lin, L., Prentice,
K., Wind turbine layout optimization using multi-population genetic algorithm and a case study in Hong Kong offshore, Journal of Wind Engineering and Industrial Aerodynamics, Vol.139, pp.89-99, (2015). [9] Yunus, E., Serap, U.S., Wind farm layout
optimization using particle filtering approach Wind farm layout optimization using particle filtering approach, Renewable Energy, Vol.58, pp. 95-107, (2013).
[10] S.A., Grady., Mohammed Yousuff, H., Makola, A., Placement of wind turbines using genetic algorithms. Renewable energy, 30.2, pp. 259-270, (2005).
[11] Andrew, K., Zhe, S., Design of wind farm layout for maximum wind energy capture, Renewable energy, 35.3, pp.685-694, (2010). [12] Peter Y.Z., David A.R., J. Christopher B., Cristina H.A., Solving wind farm layout optimization with mixed integer programs and constraint programs, EURO Journal on Computational Optimization, Vol.3 No.3, pp. 195-219, (2014).
[13] Kebin Peter, Abraham., Swethalakshmy, H., Anthony, T., Finite Element Analysis of Wind Turbine Blade, International Journal for Research in Applied Science & Engineering Technology (IJRASET), Vol.4, No.2, (2016)
ANALIZA DINAMICĂ DE CALCUL A FLUIDELOR TURBINELOR EOLIENE PENTRU REGIUNEA SOKE
Rezumat: Turbinele eoliene sunt dispozitive electro-mecanice foarte importante care transformă
energia cinetică a vântului în energie electrică. Datorită configurațiilor necorespunzătoare în proiectarea și aspectul turbinelor eoliene, energia nu poate fi recoltate eficient. Prin urmare, acest studiu sa concentrat pe optimizarea a patru configurații diferite folosind Calculul dinamicii fluide computerizate (CFD). Modelele de stare solidă ale turbinelor eoliene au fost create și toate componentele au fost asamblate folosind Autodesk Inventor. Patru configurații diferite, cum ar fi în linie, side-by-side, triunghiulare și diagonale au fost planificate conceptual și implementate în simulări. Au fost obținute datele meteorologice pentru regiunea Soke. Aceste date au fost utilizate ca o contribuție la calculele CFD. Calcularea CFD a fost efectuată de Software-ul Fluent Analysis în Ansys pentru a găsi cel mai bun model. Aceste configurații au fost testate utilizând valorile vitezei vântului obținute din datele meteorologice. Mai mult, a fost investigată performanța de calcul a CFD cu un tip de incintă dreptunghiulară. Rezultatele obținute au arătat că modelele diagonale și triunghiulare au o capacitate de recoltare mai bună decât celelalte.
Ismail BOGREKCI, Mechanical Engineering Department, Adnan Menderes University, Aydin, Turkey, [email protected]
Pinar DEMIRCIOGLU, Mechanical Engineering Department, Adnan Menderes University, Aydin, Turkey, [email protected]
Hilmi Saygin SUCUOGLU, Mechanical Engineering Department, Adnan Menderes University, Aydin, Turkey, [email protected]
Asli GULTEKIN, Mechanical Engineering Department, Adnan Menderes University, Aydin, Turkey, [email protected]