OVERCONSUMPTION?
This repOrT
was financially suppOrTed by
CREDITS:
RESEARCH: Sustainable Europe Research Institute (SERI), Austria and GLOBAL 2000 (Friends of the Earth Austria) – IN COOPERATION WITH: Institute for Economic Structures Research (GWS), Germany – TEXT: Stefan Giljum, Friedrich Hinterberger, Martin Bruckner, Eva Burger, Johannes Frühmann, Stephan Lutter, Elke Pirgmaier, Christine Polzin, Hannes Waxwender, Lisa Kernegger, Michael Warhurst – INFO-GRAPHICS: Roswitha Peintner ACKNOWLEDGEMENTS: We thank Nicky Stocks, Becky Slater, Kenneth Richter and Hannah Griffiths from Friends of the Earth England, Wales and Northern Ireland (FoE EWNI) as well as Christian Lutz and Bernd Meyer from GWS for their assistance with the content of this report. – EDITING: Becky Slater and Michael Warhurst – PRODUCTION: Lisa Kernegger and Stefan Giljum – DESIGN: Hannes Hofbauer – PHOTO-EDITING: Steve Wyckoff – PHOTOS: Jiri Rezac/WWF-UK (p5), iStockphoto (p8, p11, p16, p18, p21, p22, p25, p28, p31), Elaine Gilligan/FoE EWNI (p12), Asociación Civil LABOR (p13), Aulia Erlangga/FoE EWNI (p14), Michael Common/Green Net (p19), Michael Warhurst/FoE EWNI (p30, p32), Cover: iStockphoto – PRINTING: Janetschek, A-3860 Heidenreichstein, www.janetschek.at – PRINTED ON 100% RECYCLED PAPER
© SERI, GLOBAL 2000, Friends of the Earth Europe, September 2009
Federal Environment Agency, Germany
Federal Ministry of Agriculture, Forestry, Environment and Water Management, Austria
Friends of the Earth
England, Wales and Northern Ireland
Working Committee “Forum mineralische Rohstoffe” of the Austrian association for building materials and ceramic industries
SUPPORTED
BY
N
atural resources, including materials, water, energy and fertile land, are the basis for our life on Earth. However, humanity’s rapidly growing consumption of these resources is causing severe damage. Our climate is changing; fresh water reserves, fish stocks and forests are shrinking; fertile land is being destroyed and species are becoming extinct. In order to continue to thrive on this planet, our lifestyles will need to become more sustainable, so that we are able to protect our natural resource base and the fragile eco-systems on our planet. We consider that it is essential to start a debate about European resource use and its environmental and social impacts around the world. In order to help facilitate this debate, this report aims to provide a compilation of information on current trends in European and global resource use. This report focuses on biotic and abiotic materials, and is intended to be the first in a series of reports on different aspects of natural resource use.Humans today extract and use around 50% more natural resources than only 30 years ago, at about 60 billion tonnes of raw materials a year. This is equivalent to the weight of around 41,000 Empire State Buildings. Increasing resource extraction doesn’t just lead to environmental problems, but is often also linked to social problems such as human rights violations and poor working conditions. These negative environmental and social impacts are most strongly felt in African, Latin American and Asian countries with low environmental and social standards. Given current trends of growth, our extraction of natural resources could increase to 100 billion tonnes by 2030.
People in rich countries consume up to 10 times more natural resources than those in the poorest countries. On average, an inhabitant of North America consumes around 90 kilograms (kg) of resources each day. In Europe, consumption is around 45 kg per day, while in Africa people consume only around 10 kg per day.
With almost 3 tonnes per capita per year, Europe is the continent with the highest net-imports of resources.
Europe thus benefits from a major transfer of resources from poorer, low consuming countries to richer, high con-suming countries. The current world trade system helps support substantial inequalities in the distribution of the use of natural resources. This raises important questions for global justice.
The world economy today uses around 30% fewer resources to produce one Euro or Dollar of GDP than 30 years ago; however, overall resource use is still increasing. Resource efficiency has improved steadily in Europe and globally. However, as we consume growing amounts of products and services, this positive trend is more than outweighed by the overall growth of our economies. In order to create a more sustainable and equitable world, regions with high levels of per-capita resource use, such as Europe, will need to sharply decrease their resource use in absolute terms. This reduction in resource use in richer regions will give poorer regions the chance to increase their resource use as they overcome poverty and increase their quality of life. This principle is already well established in the global debate on climate targets, and it needs to be extended to the area of resource use.
Short-term actions can get Europe and other rich countries on the right track. These include implementing policy measures that increase the prices of natural resour-ces and reward resource-efficient behaviour, exploiting resource efficiency within companies, increasing recycling and informing consumers about their options to reduce the use of natural resources.
More fundamental questions about economics, deve-lopment and resources need to be addressed in the medium term. Most significantly, “How can new models of development be created in Europe and other industrialised countries that focus on well-being instead of increased production and consumption?” This will require rethinking the role of economic growth and the links between resource use, quality of life and happiness.
1. inTrOducTiOn
...
5
2. The hisTOry Of human resOurce use
...
7
3. exTracTiOn Of resOurces
...
9
4. Trade in resOurces
...
15
5. cOnsumpTiOn Of resOurces
...
20
6. resOurce efficiency
...
23
7. scenariOs fOr fuTure resOurce use
...
26
8. TOwards susTainable resOurce use
...
29
Oil exTracTiOn and Gas flarinG in The niGer delTa
...12
cOpper mininG and smelTinG in peru
...13
palm Oil prOducTiOn in indOnesia and malaysia
...14
subsidised eurOpean milK flOOdinG The marKeT in burKina fasO
...18
expOrT Of fair Trade OrGanic hOm mali (Jasmine rice) frOm Thailand
...19
mObile phOnes: relaTive imprOvemenTs, buT absOluTe GrOwTh
...25
recyclinG in flanders
...32
Table Of cOnTenTs
1. inTrOducTiOn
O
ur life is based on natural resources. Natural resources in the form of materials, water and energy, as well as the land available to us on Earth, are the basis of all living beings on our planet. We humans are also part of nature. Without the constant use of natural resources, neither our economy nor our society could function. Nature provides humans with all resources necessary for life: energy for heat, electricity and mobility; wood for furniture and paper products; cotton for clothing; construction materials for our roads and houses; food and pure water for a healthy diet.However, the natural resource base our societies are built on is in severe danger of overexploitation and collapse. Due to the growth of world population, continued high levels of resource consumption in the developed world and rapid industrialisation of countries such as China, India and Brazil, worldwide demand on natural resources and related pressures on the environment are steadily increasing. Many of the problems that threaten mankind’s survival on the planet result from the increased consumption of energy, water and raw materials, the increased production of waste and emissions and the increased human use of land area. The environmental consequences of this over-demand are already clear. Climate change is the most important environ- mental problem linked to our natural resource use. Global ecosystems and the ecological services they provide are being degraded: fresh water reserves and forests are shrinking, many species are under threat of extinction and fertile land is being eroded.1 At the same time, the
extraction of many non-renewable resources is already reaching or nearing a peak. “Peak-oil” is just the most prominent example.2
Despite the critical environmental situation, only around a quarter of the world’s population have high enough pur-chasing power to benefit from the system of global resource extraction and resource trade. 80% of the world population still live on less than US $10 a day and legitimately demand for further growth and increased material consumption in the future.3 The generalisation of the resource-intensive
economic model in Europe and other developed countries to all the seven billion people alive today, or to the ten billion people predicted for the middle of this century is neither environmentally possible nor can it be economically and socially sustained.
Industrial development in the past 200 years was based on cheap fossil energy and cheap raw materials. In the past few years, prices for raw materials and energy have already risen, mainly due to increasing demand from emerging countries such as China. However, prices for resources are still too low and do not reflect the real costs of current levels of resource use to people and societies worldwide. For example, cheap oil has been the fuel for globalisation and increasing international trade, without the costs of this fuel use – e.g. climate, pollution and noise impacts of transport – being included in the price.
Achieving sustainable patterns of resource use is therefore a key part of achieving sustainable development. Resource consumption and material welfare are inseparably linked to global justice, and there is not – at the moment – a fair distribution of natural resources between everyone on our planet. Currently, Europe and other rich Western countries appropriate far more than their sustainable and fair shares of global resource use.
We need to start taking action now to move towards more sustainable use of our natural resources. Rich countries should support developing countries in overcoming poverty and increasing the future material welfare of their inhabi-tants. However, in a world increasingly facing physical limits (most obviously the global climate system), this requires that countries with high levels of per-capita resource con-sumption sharply decrease their share of global resource use in absolute terms. The group of G8 countries, with the highest economic importance, recently stated the goal to reduce their greenhouse gas emissions by 80% by 2050. A similar if not even more ambitious target is also required for our general resource use.4
A strategy of reducing resource use will not only diminish the pressures on the global environment. Running a resource-efficient economy will also be a competitive advantage in a world with rising commodity prices and increased resource constraints.
This report aims to provide empirical evidence on current trends in resource use in different world regions and its environmental and social impacts. We want to emphasise the importance of resource use and resource management for world-wide sustainable development and to support related policy processes and campaigns.
Natural resources comprise a number of different env- ironmental categories: biotic materials such as cereals or timber, abiotic materials such as minerals and fossil fuels, energy, water, land area and fertile soil.
This report focuses on biotic and abiotic materials, and is intended to be the first in a series of reports on different aspects of natural resource use. Future editions of the report will focus on other resource categories, such as water and land area.
In our globalised world, resources are used in complex world-wide networks. These networks include countries where resources are extracted, international trade in re-sources and countries where rere-sources are consumed. In order to illustrate current challenges related to resource use, many economic and environmental aspects have to be addressed.
THE REPORT WILL BE STRUCTURED IN SEVERAL THEMATIC CHAPTERS:
CHAPTER 2: The history of human resource use provides an historical overview of resource use and its contribution to human development in different societies. It describes how annual per capita consumption of natural resources increased from around 1 tonne in hunter-gatherer societies to 15-30 tonnes in modern industrialised nations.
CHAPTER 3: Extraction of resources focuses on the most recent historical period and illustrates how global extraction of natural resources developed over the past 30 years. It sheds light on the distribution of resource extract- ion and related environmental and social impacts across the world.
CHAPTER 4: Trade in resources looks at one of the central economic drivers for increased resource extraction: international trade. Patterns, magnitude and impacts of global trade in natural resources are illustrated at the level of countries as well as through some example products.
CHAPTER 5: Consumption of resources turns to the ultimate goal of resource extraction and trade: consumption. It illustrates the differences in per-capita consumption levels in different world regions and discusses how dif- ferent resources contribute to the consumption basket of an average European citizen.
CHAPTER 6: Resource efficiency discusses the links between resource use and economic performance. It illus-trates why overall resource use is increasing, despite the fact that we produce and consume with increasing resource efficiency.
CHAPTER 7: Scenarios for future resource use addresses future aspects of resource use and what would happen if current patterns of development continued at the global level.
CHAPTER 8: Towards sustainable resource use finally presents the main actions necessary to achieve a more sus- tainable use of resources. It explains how different sections of society, such as policy makers, business and consumers, can contribute towards a sustainable development in Europe as well as globally. And it argues that high resource consumption is not a requirement for high quality of life.
2. The hisTOry Of human resOurce use
I
n human history, societies were always dependent on the use of natural resources. But different forms of societies consumed dramatically different levels of natural resouces. From the Stone Age until today, the per capita consumption of natural resources has grown by a factor of 15 to 30. The cultural development of mankind is also the history of an ever intensified exploitation of natural resources.Early social systems such as those of hunter-gatherers, as well as early agrarian societies, were mainly dependent upon the use of renewable natural resources such as wood and the sun. A hunter-gatherer society had a per capita consumption of natural resources of about one metric ton per year. This equals around 3 kg per day (see Figure 1).5
Resources were used mostly for food, basic housing and weapons for bringing down prey.
In agrarian societies, consumption rose to around four metric tonnes per person per year or around 11 kg per day. A large percentage of this increase was due to the feed needed for animals which were kept for milk, meat production and as a power source (e.g. for ploughing fields). At the same time, larger buildings were erected and more metallic objects, such as ploughs, weapons, and cooking pots, were produced.
These societies depended on wood as the key energy source. As one hectare of forest could only produce a
natural resources have always been the material basis of societies and their economic systems.
however, in human history, the per capita level of resource consumption changed dramatically.
Today, inhabitants of industrialised countries use 4 to 8 times more resources than people living
in agricultural societies and 15 to 30 times more resources than people in hunter-gatherer
societies. achieving a sustainable level of resource use globally does not mean that we should
go back to the stone age. however, we need to find new models of resource use, which ensure
a high quality of life for all people on our planet.
11kg/D
44kg/D
3kg/D
Hunter / Gatherer
Agrarian Society
Industrial Society
limited amount of wood each year, the energy available to these societies was limited. The population and the eco- nomy, which both depend on energy, therefore faced a limit to growth.
The Industrial Revolution in the 18th century launched the most important change in natural resource use to date. With the use of fossil fuels – at first coal, later also oil and gas – suddenly much more energy was available to man- kind. The use of fossil fuels, produced over millions of years, created an apparent energy surplus for human societies. This surplus was the precondition for the economic growth that has continued until today. It was the availability of en-ergy in a cheaper and more concentrated form that allowed a sharp increase in the production of goods and services. Population has also grown steadily since the Industrial Revolution, mainly because the use of ever more machines and ever greater amounts of fertiliser allowed a constant increase in harvest yields per hectare of cultivated land. Therefore, one hectare of arable land today feeds many more people than it did in agrarian societies, which were limited to the use of human and animal labour and had no chemical fertilisers.
However, progress has had an environmental price, as the consumption of resources has risen dramatically. One
resident of an industrialised country today uses fifteen to thirty-five tonnes of raw materials and products annually – a multi-fold increase in comparison to agrarian societies.6
Today, hunter-gatherer and agrarian societies are still pre-sent on the planet. Hunter-gatherer societies are found in the rainforests of Amazonia and Papua New Guinea. How-ever, these forms of societies have been almost completely eliminated. Agricultural societies make up large parts of the global South, in Africa, Asia and Latin America. However, an ever larger share of global population has moved into industrial societies and urban lifestyles.
With a growing global population, economy and affluence, our consumption of nature also grows. It would help us tremendously if global ecosystems would grow accordingly – but we cannot change the size of our planet.
How can we become more sustainable without going back to the Stone Age and renouncing the comfort of modern life? In a world increasingly facing physical limits, we need to find alternative approaches to human development and wellbeing. Finding new models of resource use is one corner- stone of such a new way of development. The challenge is to ensure a high quality of life for today’s global population of nearly 7 billion people, and for the 9-10 billion people predicted for the middle of this century, without exceeding the environmental capacities of our planet.
A
s the world economy grows, humans extract and harvest increasing amounts of natural resources from ecosystems and mines – around 60,000 billion kg (or 60 billion tonnes) annually.7Global annual extraction of natural resources equals the weight of more than 41,000 Empire State Buildings, each weighing around 365,000 tonnes (or 112 Empire State Buildings every day).
These natural resources comprise renewable and non-re-newable resources. Renon-re-newable materials include agricultural products and fish to feed us and our livestock, and timber to produce furniture and paper. Non-renewable resources include fossil fuels that provide energy, metal ores used in the manufacture of cars and computers, and industrial and construction minerals used to build our houses and roads.
The amount of natural resources extracted for the production of goods and services is steadily
increasing. at around 60 billion tonnes each year, humans extract and use about 50% more than
only 30 years ago. almost half of global resource extraction takes place in asia, followed by north
america with almost 20% and europe and latin america with 13% each. large variations exist in
natural resources extraction per capita: on average, an inhabitant of australia extracts around 10
times more resources than inhabitants of asia or africa. increasing resource extraction leads to
growing environmental and social problems, often worst in poor countries in africa, latin america
and asia.
3. exTracTiOn Of resOurces
Additional materials are extracted or removed from the soil
surface in order to get access to valuable resources, but are not used in production processes themselves. Overburden from mining activities is the most prominent example of this. These materials account for a further annual extraction of 40,000 billion kg (or 40 billion tonnes). All in all, we move over 100 billion tonnes of material each year.
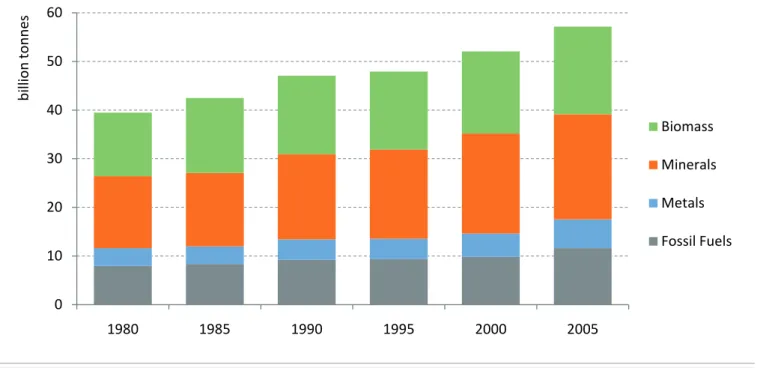
This annual extraction of natural resources is steadily in-creasing. As more goods and services are produced each year, more natural resources are required. In 1980, the world economy extracted almost 40 billion tonnes. Up to 2005, this number grew to 58 billion tonnes, an increase of almost 50% (Figure 2).
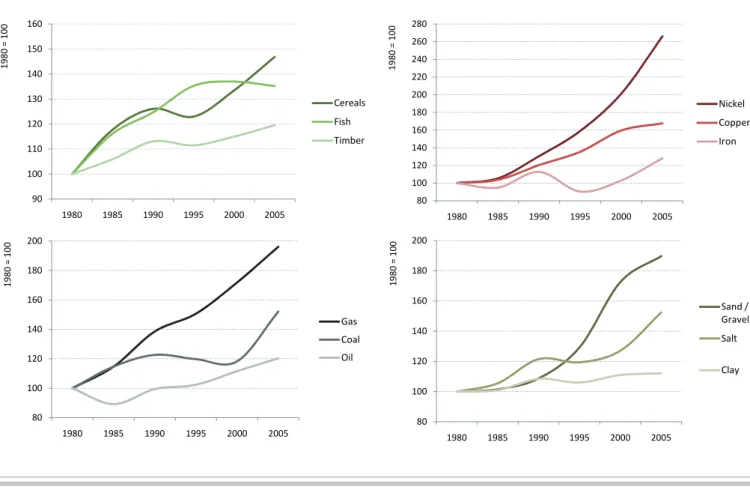
Resource extraction has increased in all major categories: biomass, fossil fuels, metal ores and industrial and construc- tion minerals (see Figure 3). Between 1980 and 2005, the extraction of gas, sand and gravel almost doubled, and nickel ore extraction tripled. For some of the biotic resources, such as fish, the signs of overuse can already be observed – catch rates have been declining over the past 10 years.
Environmental and social problems related to resource extraction. The extraction and processing of natural resources is often very intensive in the use of materials, energy, water and land. These activities therefore often entail environmental problems, such as the destruction of fertile land, water shortages or toxic pollution. Social problems are also often linked to extraction activities, including human rights violations, poor working conditions and low wages.
As the case studies on oil extraction in Nigeria, copper mining and processing in Peru and palm oil production in Indonesia and Malaysia illustrate, these negative environ-mental and social impacts are most strongly felt in poor developing and emerging countries with low environmental and social standards.
The geography of resource extraction. Each person on the planet uses on average over 8 tonnes of natural resour- ces per year, or 22 kg per day. If we include the unused extraction of materials (overburden), each inhabitant of the planet uses almost 40 kg per day.
Resource extraction is very unevenly distributed across the world. How many natural resources are extracted on a continent depends on several factors: the size of the conti- nent, the availability of resources, the size of the population as well as the level of affluence. In 2005, by far the largest share of resource extraction took place in Asia (48%), where more than half of the world’s population lives. North America ranked second with 19%, followed by Latin America and Europe (13% each), Africa (9%) and Oceania (3%).
There is also a big variation globally in the amounts and types of natural resources extracted per capita (see Figure 4). As a continent, Oceania has the smallest share of extraction, but the biggest extraction of resources per capita: in 2000 57 tonnes per year (or 158 kg per day) were extracted per person. Australia is the biggest economy in Oceania and has significantly expanded its mining industries in recent years. North America ranked second with 24 tonnes extracted per person per year (or almost 68 kg per day), followed by Latin America (41 kg per day). As with Australia, large amounts of the resources extracted in Latin America are exported to other countries; in particular metal ores, timber
and agricultural products such as soya. The average ex-traction of resources in Europe in 2000 was around 13 tonnes per year (or 36 kg per day). The smallest amounts per capita were extracted in Africa and Asia, with only 6 tonnes per year (or around 15 kg per day).
1 Full Rucksack 15 kg of Resource Extraction Per Capita and Day — — North America
Latin America
Europe Asia
Oceania
48,2 p.Day
88
100
14,40 kg/Day
10
34
Africa
14,40 kg/Day15
14
43 36
100
41
36
4368
43 158
OIL EXTRACTION AND GAS FLARING
IN THE NIGER DELTA
8shell has been operating in nigeria’s niger delta since the 1930s. nigeria is now a democracy, but has a long and brutal history of military dictatorships. The niger delta was once considered the breadbasket of nigeria because of its rich ecosystems, a place where people cultivated fertile farmlands and benefitted from abundant fisheries. in the southern part of the delta lies Ogoniland, where half a million Ogoni people live.
nigeria is the largest oil producer in africa and 11th largest in the world. in 2004, 17% of all nigerian oil exports - more than two million tonnes - went to the european union (eu 27).9 crude oil production in 2004
was 2.5 million barrels per day, of which an average of one million barrels per day were produced by shell, making shell by far the biggest oil company in nigeria. The country has significant oil reserves and even greater gas reserves. however, most nigerians have not benefited from these resources and nigeria is now one of the poorest countries in the world.
shell operates in nigeria through the shell petroleum development company (spdc), a joint venture between shell and the nigerian government. spdc has more than 90 oil and gas fields spread over some 30,000 square kilometres of oil mining leases in the niger delta. it is a massive operation involving a network of more than 6,000 kilometres of flow lines and pipelines, seven gas plants, 86 flow stations and other facilities.
shell and other oil companies have transformed the niger delta into a virtual wasteland, bearing deep scars from gas flaring and oil spills. The population in the niger delta suffers from multiple health problems and the land is heavily polluted. Gas flaring has severe health conse- quences. many scientific studies have linked breathing particulate matter to a series of significant health problems, including aggravated asthma, increases in respiratory symptoms like coughing and difficult or painful breathing, chronic bronchitis, decreased lung function, and premature death. This is due to the fact that flaring emits a cocktail of toxic substances (including sulphur dioxide, nitrogen dioxides), carcinogenic substances (such as benz[a]pyrene and dioxin) and unburned fuel components (including benzene, toluene, xylene and hydrogen sulphide).
One example of the environmental consequences of gas flaring in the niger delta is acid rain. delta residents have long complained that their roofs have been corroded by the composition of the rain that falls as a result of the flaring. The primary causes of acid rain are emissions of sulphur dioxide (sO2) and nitrogen oxides (nOx), which
combine with atmospheric moisture to form sulphuric acid and nitric acid, respectively. acid rain acidifies lakes and streams and damages vegetation. in addition, acid rain accelerates the decay of building materials and paints. according to the world bank, emissions during flaring are the major source of greenhouse gases in sub-saharan africa.
in november 2005, the federal high court of nigeria ordered shell to immediately stop flaring gas, in iwherekan community, delta state. The court found gas flaring to be a ‘gross violation’ of the rights to life and dignity. nevertheless, shell continues the flaring. a recent report from the nigerian federal ministry of environment, nigeria conservation foundation, wwf uK and iucn concluded that the niger delta is one of the five most severely petroleum-damaged ecosystems in the world.
There have been major human rights abuses as well. On June 8 2009, shell was forced to pay us$15.5 million to settle an embarrassing lawsuit in the us for human rights abuses in nigeria. The company is also facing legal action in The hague concerning repeated oil spills which have damaged the livelihoods of nigerian fisherfolk and farmers.
COPPER MINING AND SMELTING
IN PERU
10peru’s mining sector accounted for about 60% of total export revenues in 2006 and 2007. copper accounts for about 40% of the total exports of the mining sector. approximately 1.3 million tonnes of copper was mined in peru in 2008. in 2007 and 2008, 31% and 21% respec-tively of peru’s copper exports were sent to europe.11
peru has about 10 copper mines, the biggest of which is the antamina mine in huari (400,000 tonnes). There are copper smelters at ilo (320,000 tonnes) and la Oroya (65,000 tonnes).
many communities in peru have protested against mining because production of copper requires huge amounts of water (e.g. for electrolysis) and water shortages are a major problem. local communities also experience few benefits from mining revenues. The peruvian government lacks the capacity and political will to regulate the indus-try. for example, the mining sector was exempted from the responsibilities of the newly created ministry of the environment; only the ministry of energy and mines is allowed to monitor mining.
Copper smelter La Oroya. in september 2007, the us-based not-for-profit organisation blacksmith institute, which focuses on identifying and solving pollution-related problems in the developing world, listed the town of la Oroya (35,000 inhabitants) in peru as one of the top ten most polluted places on earth. a poly-metallic smelter has been the main cause of the released toxins. a survey conducted by the peruvian ministry of health in 1999 revealed that blood lead levels among local children were triple the limits set by the world health Organisation (whO). sulphur dioxide concentrations also exceeded the world health Organization guidelines by a factor of ten, and vegetation in the surrounding area has been destroyed by acid rain due to these emissions. The copper smelter is the main driver of the local economy, and able to exercise control over the livelihood of the population. The smelter and adjoining copper mine are owned by doe run peru (a subsidiary of the us-based renco Group). in september 2008, doe run peru inaugurated a us$50 million sulphuric acid plant, which is expected to halve the sulphur dioxide emissions from the la Oroya metals smelter. however, even after emissions from the smelter are reduced, the emitted lead will remain in la Oroya’s soil for centuries — and there is currently no plan to clean it up.
PALM OIL PRODUCTION
IN INDONESIA AND MALAYSIA
palm oil is an edible oil extracted from the fruit of the oil palm. it is used in food products, cosmetics and increa-singly as a biofuel. indonesia and malaysia are the world’s largest producers. between 2000 and 2006 imports of palm oil products into the eu almost doubled from 1.2 to 2.2 million tonnes, mostly for food and cosmetics.12
additional demand resulting from eu biofuel targets could result in the import of a further 13 million tonnes per year by 2020.13 6.5 million hectares of land have already
been converted to palm oil plantations in indonesia and a further 20 million hectares for palm oil have now been earmarked for further expansion.14
palm oil production is having a devastating environmental and social impact.
in 2007 indonesia was ranked as having the world’s third highest greenhouse gas emissions, not because of its high consumption (consumption alone would put it in 21st place) but because of the draining of its peatlands and
conversion of tropical forest to agriculture, largely palm oil for export.15 in order to clear forest, the indonesian
government, international funders and companies are trampling over the rights of indigenous people who live sustainably off the forest and whose land is being conver-ted without their permission. They are promised jobs and economic advancement, but conditions on plantations can be harsh and often families are better off before palm oil.16
biodiversity loss is another major problem associated with palm oil. Key habitat for numerous species, including iconic ones such as the orang-utan, is being wiped out by oil palm development.17
meanwhile the malaysian Government plans massive continued expansion and rebuts environmental concerns as “protectionist agendas” from developed countries that deforested their own land centuries ago.18 palm oil raises
important questions about europe’s ecological footprint – how much land do we need to feed our lifestyles? are we really willing to dig up our tropical rainforests in order to fuel our cars? how much responsibility are we prepared to take for the devastation of resource extraction else-where in the world?
T
he preceding chapter illustrated that the extraction of natural resources is very unevenly distributed across the world. Consumption of products often takes place far away from the origins of their raw materials (see Chapter 5). International trade redistributes resources across the globe, allowing some countries to export resources and to raise revenues and other countries to increase their supply of raw materials and products.Growing world trade and its environmental impacts. Over the past 50 years, international trade of raw materials and products has increased dramatically. Since 1950, in-ternational trade volumes in monetary units have grown by an average of 6% each year. Compared with 1950, in 2006 the value of trade was 60 times higher for manufactured products, 10 times higher for fuels and mining products, and 7 times higher for agricultural products (see Figure 5).19
international trade in raw materials and products has increased hugely in recent decades. Trade
in natural resources can support economic development, as it enables resource-rich countries to
export resources and raise revenues. if done to high environmental and social standards, trade
can thereby contribute to sustainable development of poor countries. however, growing world
trade also poses severe environmental and social threats. world trade accelerates resource
ex-traction by linking local resources in all parts of the world with global demand. in addition, the
current trade system reinforces unequal levels of resource consumption by shifting resources
from poorer low consuming countries to richer, high consuming countries.
4. Trade in resOurces
Since international exchange requires goods to be trans-ported between the countries of extraction and production to countries of consumption, growth in trade has signifi-cantly increased greenhouse gas emissions from transport activities. Out of the total energy used in world transport, 95% is still supplied by petroleum. Around a quarter of global energy-related greenhouse gas emissions originate from transport activities (including transport that isn’t trade related).20 Trade also contributes to increased land
requirements for transport infrastructure, such as roads, harbours and airports.
The structure of world trade. Current patterns of trade are largely determined by the availability of resources in different world regions and the economic position of countries in the world system.21
Industrialised countries in Europe and North America, but also in Asia, largely export manufactured products with a high value added. Many developing countries, on the other hand, continue to rely strongly on the export of raw materials such as agricultural products, minerals and fossil fuels (see Figure 6).
Exporting manufactured products usually generates higher profits compared to export of commodities. Furthermore, environmental pressures related to extraction and proces-sing of resources are high (see Chapter 3). However, some resource exporting countries do gain significant income from their exports, for example prices of many resources increased sharply between 2003 and 2008. Examples include the OPEC countries and Venezuela for oil exports, or Chile and Australia for exports of metal ores.
If managed with high environmental and social standards and under effective local governance structures, exports of natural resources can have positive impacts on regional development in poorer countries, as the case study on export of fair trade rice from Thailand illustrates.
However, the massive growth of the global trade system in the latter half of the 20th century has had significant impacts on the way we use natural resources and poses some severe environmental and social threats.
Trade reinforces inequalities in resource consumption. Global trade of natural resources allows countries and world regions with high purchasing power to increase re-source consumption beyond their own national rere-source capacities. In recent years, more and more countries have become net-importers of natural resources and products and thus consume more than would be possible based on domestic resources only. These countries run an “ecological trade deficit”.
It may not be regarded as problematic that countries with poor natural endowments have net resource imports. How- ever, the inequalities in resource use facilitated by the current patterns of world trade raise concern as they may jeopardise sustainable and equitable development in all world regions.
In order to ensure material welfare for all people, trade could help redistribute resources from countries with a high extraction to countries with lower extraction. Currently, however, the opposite is in general the case. Like other OECD countries, Europe’s per capita extraction is higher than the rest of the world. Europe also has the highest net imports of natural resources, at almost 3 tonnes per capita per year. Developing and emerging economies are net exporters of natural resources (see Figure 7). Currently, international trade does not balance, but instead reinforces inequalities in per capita resource use.
Importing feed, exporting milk and meat. Europe is a significant net importer of fossil fuels and metal ores as well as of some categories of agricultural and forestry products.22
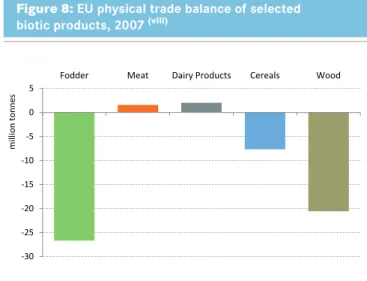
As Figure 8 shows, Europe has huge net imports of fodder and cereals from other world regions. These resources are
mostly used to feed animals, in order to maintain high levels of production of meat and dairy products. But Europe produces more meat and dairy products than are consumed by Europeans. These products are therefore exported to other world regions, in particular developing countries. The EU had a trade surplus of 1.6 million tonnes of meat and 2.0 million tonnes of dairy products in 2007 (see Figure 8).
Fostered by producer subsidies through the Common Agri-cultural Policy, Europe is able to sell this surplus production abroad at below world market prices. This has had negative consequences for local markets in developing countries (see the case study on subsidised European milk powder in West Africa on page 18).
Appropriation of foreign agricultural land. Another relatively new but accelerating trend in the global economic system is the increasing trade and investment by richer emerging countries in developing countries. One compo-nent of this trend is the large-scale land deals in which governments (mainly China and the Gulf region) and poli-tically influential companies buy or lease millions of acres of farmland abroad (largely in Africa and South-East Asia). This land is then used to grow food or biofuel crops instead of buying these crops on the world markets.23
These developments are a consequence of rising food prices and increasing concerns over long-term food security and water shortages. Some argue that such deals may increase economic growth, government revenues and opportunities for economic development in the target countries. Yet they may also threaten food security, displace local populations, create political unrest and increase land prices.
Figure 7: Net exports versus net imports per capita, 2000 (vii)
Figure 8: EU physical trade balance of selected biotic products, 2007 (viii)
SUbSIDISED EUROPEAN MILK FLOODING
THE MARKET IN bURKINA FASO
24in the west african country of burkina faso cattle bree-ding is the second most important economic sector. small-scale farmers constitute the bulk of the sector. however, farmers in burkina faso cannot compete with the low prices of imported powdered milk. for decades, burkina faso has been importing milk from abroad. in part, this was a deliberate government strategy: these imports gave the urban population cheap food. These imports have frequently been subsidised, and are dumped below cost price on local markets in developing countries such as burkina faso. The main source of these cheap milk im-ports is france, followed by ireland and the netherlands. when the local currency depreciated (increasing the price of these imports), the burkina dairy sector displayed signs of a modest comeback. This, however, proved short-lived when a regional partnership of west african countries instituted a very low import tariff on milk.
it is not only burkina faso where dairy farmers are suf-fering - senegal and cameroon are also being in undated with subsidised powdered milk from europe. before, countries could fairly easily close off their markets by levying import tariffs. This, however, has become in- creasingly difficult under the influence of current main-stream economic ideology that argues that liberalisation is always beneficial to the economic development of a country. as a result, dairy farmers in developing countries have to compete with products from countries which have yet to dismantle their own state support and subsidy systems, with no recourse to subsidies or any other form of government intervention of their own.
in June 2007 the european union decided to stop export subsidies for dairy products due to the high world market price, aiming to make eu dairy exports less attractive for producers and thereby ensure adequate domestic supply. in the summer of the following year the price started to fall again leading to a reintroduction of the export subsidies for dairy products in January 2009.25
EXPORT OF FAIR TRADE ORGANIC HOM
MALI (JASMINE RICE) FROM THAILAND
26in Thailand, rice is the most important staple food and export product. Thailand is the sixth biggest rice producing country in the world and produces 18.6 million tonnes rice per year. in comparison to other rice producing coun-tries such as china, india or vietnam, Thailand uses less rice for its own markets and exports more, around 9.6 million tonnes per year, which is about one third of the rice exported worldwide.
isaan is a poor region of Thailand, and agriculture is the largest sector of the economy. in this region, it was mainly the merchants and processors that made a profit from the rice exports, rather than the farmers. That is why, in the early 1990s, the Green net cooperative was founded by small scale farmers. it produces organic rice for domestic use and for export, if the domestic use is satisfied. in the past farmers had sold their rice to other cooperatives or to independent buyers, but they suffered from rapidly changing market prices, sometimes falling significantly from one day to the other. The Green net cooperative takes
a fair trade approach, with the farmers receiving prices 20% above the market price. Green net has also given farmers a stronger position in the market, and has helped farmers move from conventional to organic farming. This saves money, as none has to be spent on expensive con-ventional pesticides and fertilisers. furthermore, farmers no longer get sick from handling toxic pesticides.
local farmers also produce rice, water melons, bananas and other fruits and vegetables for the local market. The combination of selling these products on the local market and selling rice with Green net to foreign markets gua-rantees a stable income and prevents farmers from being entirely dependent on exporting rice.
The organic fair trade rice from the Green net producers is grown and processed entirely in the region. Once the rice is planted it takes between 90 and 120 days for it to be ready to harvest. The rice is flailed and dried on the field. dehusking, cleaning and sorting takes place in the farmer-owned rice mill, and it is then packed in Green net’s packing complex. This ensures that more of the added value from the exported rice stays within the country.
G
lobal resource consumption equals global resource extraction: the world economy uses around 60 billion tonnes of resources each year to produce the goods and services which we all consume.Large differences in per capita consumption. In Europe, around 36 kg of resources are extracted per person per day, excluding the unused resource extraction, whereas 43
kg are consumed per person per day (see Figure 9). Euro-peans therefore need resources imported from other world regions to maintain their level of consumption.
Consumption is even higher in other world regions. An average North American consumes around 90 kg per day; inhabitants in Oceania about 100 kg per day. On average, in comparison to Europe, people in these continents have
There are huge differences in per capita consumption of natural resources between different
countries and world regions. people in rich countries consume up to 10 times more natural
resources than those in the poorest countries. The most resource-intensive areas of life in europe
are housing, food and transport. These three areas make up around 70% of our total resource
consumption.
5. cOnsumpTiOn Of resOurces
1 Full Rucksack 15 kg of Resource Consumption Per Capita and Day — — North America
Latin America
Europe Asia
Oceania Africa
48,2 p.Day
43
88 43
14
100
43
14,40 kg/Day
10
34
88
larger houses, eat more meat and drive bigger cars. These differences in lifestyle increase resource consumption. Far fewer resources are consumed in other world regions. In Asia, resource consumption is about equal to resource extraction at around 14 kg per person per day. The average resource consumption of an African is only 10 kg per day (compared to the extraction of 15 kg per day).
This means in Europe we consume three times as many resources as an inhabitant of Asia and more than four times as much as an average African. Inhabitants of other rich countries consume up to 10 times more than people in developing countries. The difference would be even greater if unused resource extraction were included in these calculations.
The consumption basket of a European. Let us now take a closer look at the resource consumption of an average European. As Figure 10 illustrates, three consumption areas together make up more than 60% of resource use: housing and infrastructure, eating and drinking and mobility. Around one third of resource consumption is caused by housing and infrastructure. Natural resources are mainly needed to construct buildings and infrastructure, such as roads, railways and airports. Furthermore, we need elec-tricity for lighting and cooling, and various energy sources (oil, gas, wood, etc.) for heating and providing hot water.
Eating and drinking accounts for around one quarter of resource use. It includes food and beverages purchased in shops and consumed in hotels and restaurants. The food and drink industry requires a lot of resources (such as agri- cultural products, machinery, energy, etc.) to produce the goods we buy in shops. In addition, the retail network uses a lot of transport and cooling. All these resource uses are part of this consumption category.
Mobility contributes around another 7% to our resource consumption. This includes the fuel we purchase for driving cars, the kerosene for airplanes and ferries and
Figure 10: Distribution of European
the electricity for railways and public transport. All means of transport also require huge amounts of resources in manufacture: cars, ships and airplanes need a large number of metals, such as steel, aluminium and copper, as well as plastics, glass and textiles. These resource requirements are also included in this category.
The remaining part of around 40% consists of a large variety of other consumption areas, such as electronics (computers, cameras, etc.), books and paper products. Ecological rucksacks of products. We can also calculate the so-called “ecological rucksack” of single products. The ecological rucksack comprises all resources used to pro-duce the product, to transport it between factories and from factory to the consumer. The rucksack of a product also includes the material and energy used by the shop selling it (its construction, maintenance, heating and cooling, etc.), the energy and materials needed to use the product (electricity or fuel, for example) and finally every-thing that is required for safe dismantling and/or disposal.27
Adding up the resource use caused by all products would equal global resource consumption, which is 60 billion tonnes a year (or 100 billion tonnes including unused resources).
If we buy products that weigh a total of 7 kg, the actual “ecological rucksack“ of these products may be as much as 60 kg (see Figure 11). A car of 1.6 tonnes has a rucksack of 70 tonnes, while a CD has a rucksack of around 1.6 kg. Even a computer download uses resources, because of the huge material and energy consumption of both the computer and the global internet.28
Purchase: 7 kg / P20.–
60 kg
Purchase: 7 kg / P20.–
Figure 11: Exemplary ecological rucksacks related to a purchase of 7 kg of products
I
ncreasing the efficiency of production of goods and services is one key driver for economic development and growth. Traditionally, enterprises focused on labour costs and aimed to increase labour productivity, i.e. economic output produced per worker or employee. In the EU, for example, labour productivity increased by more than 50% between 1980 and 2005.29Relative de-coupling, but absolute increase.Resource
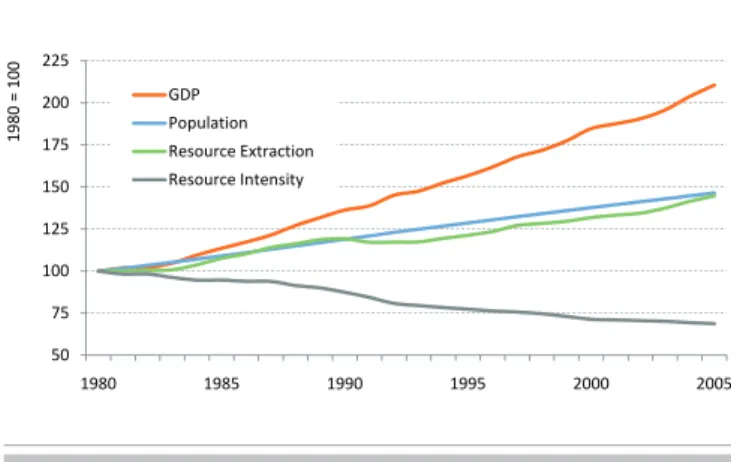
efficiency, which measures the economic value produced per unit of natural resources, has improved in the past. We therefore need fewer resources to produce a Euro or Dollar of Gross Domestic Product (GDP) than in the past. Figure 12 illustrates this trend and shows the development of GDP, population, resource extraction and resource intensity in the world economy between 1980 and 2005.
As described in Chapter 3, world-wide resource extraction grew by around 50% between 1980 and 2005. As Figure 12 shows, growing resource extraction was closely correlated
with global growth in population. World economic output (GDP) increased by 110% in the same time period. As GDP growth was higher than growth in resource extraction, a so-called “de-coupling” of resource extraction from eco- nomic growth was achieved. Thus, the world economy today uses around 30% fewer natural resources to produce one Euro or Dollar of GDP than 30 years ago. As a consequence, the resource intensity of the global economy is declining.
This is a positive trend and shows that we are improving our resource efficiency in relative terms. However, Figure 12 clearly illustrates that the absolute amount of resource extraction and resource use is still rising at a global level. Economic growth is therefore outweighing the gains in resource efficiency. A similar trend can be observed for Europe, where resource productivity increased by more than 30% between 1990 and 2004. However, GDP also grew by the same order of magnitude and no absolute reduction of resource use was achieved.30
Resource efficiency differs significantly between
world regions.World regions use very different amounts of
resources to produce their GDP. How many resources are required depends on several factors: the types and amounts of resources available in the different world regions, the imports and exports of resources (see Chapter 4), the technologies as well as their economic structure, i.e. which economic activities contribute mostly to GDP.
Figure 13 illustrates the resource intensity of each con-tinent in 2000 (unfortunately, more recent global data is not currently available). As an average, around 1.4 kg of natural resources (not including unused resources) were needed in the year 2000 to produce each Dollar of GDP.
in europe, as well as globally, we use fewer and fewer resources to produce one unit of economic
value. we have therefore achieved a relative improvement in resource efficiency. however, absolute
levels of resource use continue to grow, as we are producing and consuming ever increasing
amounts of products and services. economic growth therefore more than outweighs the gains in
resource efficiency.
6. resOurce efficiency
Figure 12: Relative de-coupling of economic growth from resource use, 1980 to 2005 (ix)
Africa is the continent with the highest resource intensity, with countries needing almost 7 kg of domestic resources to produce one Dollar of GDP. This is due to the fact that resource-intensive economic activities, such as mining and agriculture, are dominant in the African economy and the technologies these countries use are less efficient than those in other world regions. However, Africa is a net-exporter of resources (see Figures 6 and 7 in Chapter 4), so many of the resources Africa extracts are consumed in other countries. Therefore, resource consumption in Africa is less resource intensive than resource extraction (less than 5 kg).
Natural resources also play an important role in the econo-mies of Latin America and Oceania (in particular, Australia). Consequently, their resource intensity is also above the world average. These countries also have high exports of resources to other world regions. Consequently, resource intensity of extraction (around 3 kg per Dollar) is higher than resource intensity of consumption (around 2 kg per Dollar). The reverse trends can be observed for Europe and North America. With less than 1 kg of resource use per Dollar, these economic regions are relatively more resource efficient, as
service sectors are the largest component of GDP. Services, such as banking or health care, are less resource intensive than mining, agriculture or manufacturing. However, Europe and North America need resources from other world regions to maintain their economic system. Resource intensity is therefore higher for resource consumption than for resource extraction.
The “rebound effect”: eating up efficiency gains. The
remarkable technological progress we have witnessed over recent decades, which has allowed us to use raw materials and energy ever more efficiently, will not solve the environ-mental problems related to resource use. One key reason for this is the so-called “rebound effect”.31 When enterprises
use less energy and fewer materials to produce their pro- ducts and services, the production costs decrease. Lower production costs, in turn, lower the price of the product or service. And lower prices for consumers mean that – with the same budget – consumers can purchase more of the cheaper product or other products. Rising resource efficiency therefore often increases the demand for natural resources, as the case study on mobile phones illustrates. This rebound effect therefore means that there isn’t an overall reduction in resource consumption.
Figure 13: Resource extraction (darker column) and resource consumption (lighter column) in kg per US$ of GDP, 2000 (xii)
MObILE PHONES: RELATIVE
IMPROVEMENTS, bUT AbSOLUTE GROWTH
mobile phones have gone through a rapid technological improvement ever since the first commercial portable phone entered the market in 1983. The material intensity of mobile phones has decreased significantly, due to im-proved design and the development of new technologies. The 1983 model weighed about half a kilo, seven years later an average mobile phone was about 200 grams lighter and in 2005 a mobile phone weighed only a fifth of the first model: around 110 grams.32 The price ofmo-bile phones also declined rapidly, with the 1983 model costing about us$ 3,500, whereas today many mobile phones are distributed as a free addition to a mobile phone contract.
nowadays mobile phones are smaller and lighter, but at the same time significantly more people possess mobiles and change them more frequently to stay up-to-date with new technologies. in 2002, approximately one billion mobile phones were in use worldwide and this number is expected to expand to more than 2.5 billion by the end of the year 2009.33 an average consumer replaces their
mobile phone every one and a half years which has led
to an estimated stockpile of about 500 million obsolete mobile phones in 2005.34
an average mobile phone (without battery) consists of plastics (around 60%), metals (around 25%) and ceramics (around 15%).35 mobile phone production requires a large
number of different metals: copper, iron, nickel, silver, zinc and smaller amounts of aluminium, gold, lead, manganese, palladium, platinum and tin.36 The obsolete mobile
stockpile in 2005 therefore weighed at least 56,000 tonnes and consisted of 7,900 tonnes copper, 178 tonnes silver, 17 tonnes gold, 7,4 tonnes palladium and 180 kg platinum. less than one % of this material is recycled, due to low recycling rates for mobile phones.37 it is
estimated that around one billion mobile phones will be sold in 2009.38 in order to manufacture these phones
more than 15,000 tonnes copper, 350 tonnes silver, 30 tonnes gold and 14 tonnes of palladium will need to be extracted.
The technological improvement in mobile phones has made them less material intense, but their increasing sales volume and short life time has increased the absolute material use for mobile communication.
S
cenarios tell us stories about how the future might look. In recent years, significant progress has been made in the development of scenario modelling, which allows us to simulate different scenarios of the future: of economic growth, of the development of international trade, but also of environmental pressures posed by the economy on global ecosystems.“business-as-usual”: growing without limits?Figure 14
presents the results of such a future scenario, illustrating the trends in worldwide extraction of resources until the year 2030. The scenario is a so-called “business-as-usual” scenario and illustrates how many resources would be extracted world-wide if the world economy continues its current development path. An increase in extraction can be seen to occur in all resource categories. As a result, worldwide extraction of natural resources in the year 2030 could be as high as 100 billion tonnes, which means almost a doubling of extraction compared to 2005. Various assumptions are made in order to create this “business-as-usual” scenario. Resource consumption in the industrialised countries will not decrease significantly compared to today, world population will grow considerably, and emerging and developing countries will increase their per-capita resource consumption, as they aspire to the same material welfare as people in the Western world are already enjoying.
High prices and peak extraction of non-renewable resources. The results in Figure 14 assume that the future demand for resources can be met. However, in the light of such strong growth scenarios, one has to ask whether such growth will actually be possible or whether the world eco-nomy will face physical limits to grow in the (near) future. The rapidly increasing demand for resources has already caused an unprecedented boost in resource prices, parti-cularly since 2003. Although the economic crisis of 2008 led to a downturn in resource prices, it is generally ex-pected that the age of cheap resources is over. Countries with large raw material deposits (or those companies who own these deposits) will profit from this situation, and will be able to export resources at higher prices, while countries or regions with relative resource scarcity will be negatively affected. These countries will face increasing competition for resources in the future, and they will have to pay high, and probably increasing, prices.
Additionally, for various commodities, the peak of extrac-tion has already been reached or is about to be reached. This means that future extraction of these materials will decrease and their availability will be restricted. In the case of oil, about half of the world’s reserves have been used al-ready and peak-oil is expected between 2015 and 2030.39
For natural gas, the peak will probably occur within the next 30 years. The reserves of coal seem to be extensive, however the use of coal has a highly negative impact on the world’s climate. Climate policy measures might therefore be a more restrictive factor on coal use than its availability.