Centre Number
Candidate Number
Write your name here
Surname
Other names
Total Marks
Paper Reference
Edexcel GCE
Biology
Advanced Subsidiary
Unit 1: Lifestyle, Transport, Genes and Health
Monday 16 May 2011 – Morning
Time: 1 hour 30 minutes
You do not need any other materials.
6BI01/01
Instructions
t
Use black ink or ball-point pen.
t
Fill in the boxes at the top of this page with your name,
centre number and candidate number.
t
Answer all questions.
t
Answer the questions in the spaces provided
–
there may be more space than you need.
Information
t
The total mark for this paper is 80.
t
The marks for each question are shown in brackets
– use this as a guide as to how much time to spend on each question.
t
Questions labelled with an asterisk (*) are ones where the quality of your
written communication will be assessed
– you should take particular care with your spelling, punctuation and grammar, as
well as the clarity of expression, on these questions.
t
Candidates may use a calculator.
Advice
t
Read each question carefully before you start to answer it.
t
Keep an eye on the time.
2
*P38170A0228*
Answer ALL questions.
Some questions must be answered with a cross in a box . If you change your mind about an
answer, put a line through the box
and then mark your new answer with a cross
.
1
Molecules are transported into and out of cells by several mechanisms.
(a) Read through the following passage that describes some of these mechanisms,
then write on the dotted lines the most appropriate word or words to complete
the passage.
(4)
Some molecules move across a cell surface membrane by passing down a
concentration gradient, through the phospholipid bilayer. The movement of some polar
molecules across the membrane involves carrier and channel
. . . .
molecules. When this movement occurs down a
concentration gradient, the process is called
. . . .and
when it occurs against a concentration gradient the process is called
. . . .
.
Energy in the form of
. . . .is used in the movement of
(b) A student wanted to sweeten some strawberries, so she sprinkled some sugar on
top of them, one hour before eating them. The student noticed that the sugar
that she had sprinkled on them was no longer visible and that there was some
juice at the bottom of the bowl.
Appearance on adding sugar
Appearance one hour after adding sugar
The student thought that the juice was the sugar dissolved in water and that the
water had come from the fruit.
In order to test this hypothesis, she weighed some fresh strawberries and
sprinkled them with sugar. One hour later she rinsed off the juice and reweighed
the strawberries. The mass of the strawberries before adding the sugar was 77 g.
The mass after rinsing off the juice was 70 g.
(i)
Calculate the percentage decrease in the mass of the strawberries.
Show
your
working.
(2)
4
*P38170A0428*
(ii) Suggest
one
possible source of error in the student’s procedure that could
make this value for the percentage decrease in the mass of the strawberries
inaccurate.
Explain how this source of error would affect the value for the percentage
decrease in the mass of the strawberries.
(3)
Source of error
. . . . . . . . . . . .Effect on value and explanation
. . . . . . . . . . . . . . . . . . . .(iii) Using your knowledge of cell transport mechanisms and the properties of
water, explain how the juice is formed from the water that came from the
fruit.
(3)
. . . . . . . . . . . . . . . . . . . . . . . . . . . . . . . . . . . . . . . .
2
Galactosaemia is a genetic disorder that affects an individual’s ability to metabolise
the monosaccharide galactose.
Dairy products contain the disaccharide lactose, which is broken down into galactose
and glucose during digestion. If the galactose is not broken down further this may
result in damage to the brain, kidneys or liver.
(a) The diagram below shows the structure of a galactose molecule and a glucose
molecule.
(i)
In the space below, draw a diagram to show the products formed when these
two molecules join together to form lactose.
(3)
CH
2
OH
H
OH
H
HO
H
H
OH
OH
H
CH
2
OH
H
OH
H
HO
H
H
OH
OH
H
6
*P38170A0628*
(ii) Name the chemical reaction that joins the galactose and glucose molecules
together.
(1)
. . . .
(iii) Name the bond that joins the galactose and glucose molecules together.
(1)
(b) The pedigree diagram below shows the inheritance of galactosaemia in a family.
The normal allele is represented by G and the defective recessive allele by g.
Place a cross in the box next to the correct letter that completes each of the
following statements.
(i)
An allele is a
(1)
A
form of a gene
B
length of DNA
C
part of a gene
D
protein
(ii) If John is heterozygous for galactosaemia, Jane’s genotype must be
(1)
A
GG
B
Gg
C
gg
D
impossible to tell
(iii) Samir’s genotype must be
(1)
A
GG
B
Gg
C
gg
John
Elsie
Samir
Angela
Jane
Heather
Andy
Sahan
Alina
Sasha
Unaffected male
Unaffected female
Galactosaemic male
8
*P38170A0828*
(c) (i)
Use a genetic diagram to calculate the probability that Sahan and Alina’s first
child will be heterozygous (a carrier) if Sahan is heterozygous.
(4)
Answer
. . . .(ii) What is the probability that their second child would also be a carrier?
(1)
. . . . . . . .
3
Cystic fibrosis is a genetic disease that can affect many body systems, including the
digestive system. In a carrier of this disorder, preimplantation genetic diagnosis can
be used to detect the presence of an allele for cystic fibrosis.
*(a) Explain how cystic fibrosis affects the digestive system.
(4)
. . . . . . . . . . . . . . . . . . . . . . . . . . . . . . . . . . . . . . . .
(b) Explain how preimplantation genetic diagnosis is performed to detect cystic
fibrosis.
(3)
10
*P38170A01028*
(c) Discuss either one
ethical issue or one social issue relating to the use of
preimplantation genetic diagnosis.
(2)
. . . . . . . . . . . . . . . . . . . . . . . .
12
*P38170A01228*
4
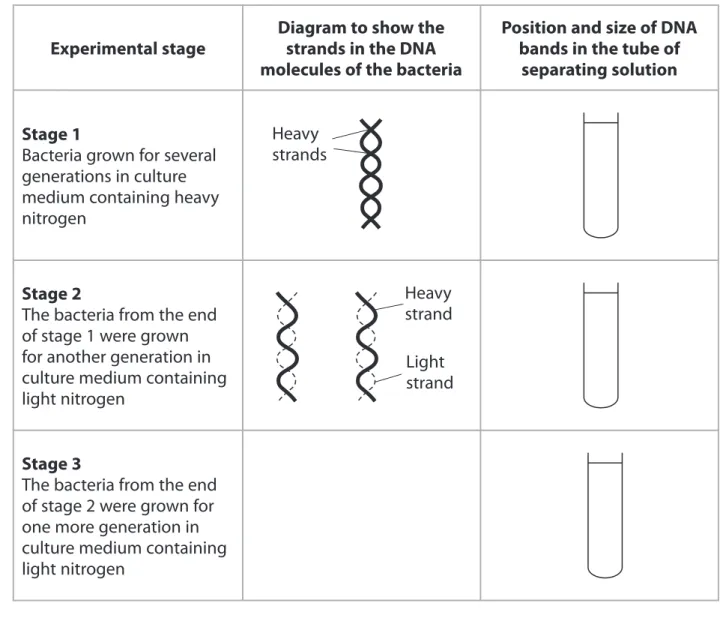
In the late 1950s, Meselson and Stahl performed some important experiments. These
experiments provided evidence to support the idea that new DNA was synthesised by
semi-conservative replication.
(a) Name an enzyme involved in DNA replication.
(1)
. . . .
(b) Meselson and Stahl’s experiments involved growing bacteria in culture media
containing either heavy nitrogen (
15
N) or light nitrogen (
14
N). The DNA was then
extracted from the bacteria. The DNA was analysed as shown in the diagram
below.
Separating solution
Light DNA
Heavy DNA
Separating solution
The table below summarises the three stages of Meselson and Stahl’s experiment
and their results.
Complete the table by drawing, in the appropriate boxes, diagrams of the DNA
molecules and mark the position and size of the DNA bands in the tubes.
(6)
Experimental stage
Diagram to show the
strands in the DNA
molecules of the bacteria
Position and size of DNA
bands in the tube of
separating solution
Stage 1
Bacteria grown for several
generations in culture
medium containing heavy
nitrogen
Heavy
strands
Stage 2
The bacteria from the end
of stage 1 were grown
for another generation in
culture medium containing
light nitrogen
Heavy
strand
Light
strand
Stage 3
The bacteria from the end
of stage 2 were grown for
one more generation in
culture medium containing
light nitrogen
14
*P38170A01428*
5
The risk of developing cardiovascular disease (CVD) can be reduced in several ways.
Lowering blood cholesterol levels and lowering blood pressure are two ways of
reducing CVD.
(a) (i)
Complete the diagram below by giving three other ways in which the risk of
CVD may be reduced. Write your answers in the empty boxes.
(3)
(ii) Explain how lowering blood cholesterol levels can reduce the risk of CVD.
(2)
. . . . . . . . . . . . . . . . . . . . . . . .
Lowering blood
pressure
Reducing the
risk of CVD
16
*P38170A01628*
(b) Risk calculators can be used to estimate the probability that a person will develop
CVD. Many of these calculators start by asking for the age and gender of the
person using them. Explain why information about age and gender is important
in estimating the risk of developing CVD.
(2)
. . . . . . . . . . . . . . . .
(c) The graph below shows the relative death rate from CVD in some countries in
Western Europe.
(i)
Compare the relative death rates from CVD in Finland, Denmark and Sweden.
(3)
. . . . . . . . . . . . . . . . . . . . . . . .
Finland
UK
Germany
Denmark
Portugal
Sweden
Spain
Italy
France
0
20
40
60
80
100
(ii) The map below shows the number of deaths from CVD in one year in Western
Europe.
Describe two differences between the data presented in the map and the
data shown in the graph.
(2)
1
. . . . . . . .2
. . . . . . . .Finland
UK
Germany
Denmark
Portugal
Sweden
Spain
Italy
France
500 000 and above
100 000 – 499 999
10 000 – 99 999
1000 – 9999
less than 1000
18
*P38170A01828*
(iii) Suggest
one reason for the differences between the data presented in the
map and the data shown in the graph.
(1)
. . . . . . . . . . . . . . . . . . . .
6
The sequence of amino acids in a polypeptide chain is determined by the sequence of
bases in DNA. This sequence of bases is used as a template to synthesise messenger
RNA (mRNA).
(a) Describe the structure of an amino acid.
(2)
. . . . . . . . . . . . . . . .
(b) Describe how mRNA is synthesised.
(4)
20
*P38170A02028*
(c) The table below shows the amino acids coded for by the codons on mRNA.
Three-letter codons of mRNA and the amino acids specified by the codons
AAU
AAC
AAA
AAG
Asparagine
Lysine
CAU
CAC
CAA
CAG
Histidine
Glutamine
GAU
GAC
GAA
GAG
Asparatic acid
Glutamate
UAU
UAC
UAA
UAG
Tyrosine
Stop
ACU
ACC
ACA
ACG
Threonine
CCU
CCC
CCA
CCG
Proline
GCU
GCC
GCA
GCG
Alanine
UCU
UCC
UCA
UCG
Serine
AGU
AGC
AGA
AGG
Serine
Arginine
CGU
CGC
CGA
CGG
Arginine
GGU
GGC
GGA
GGG
Glycine
UGU
UGC
UGA
UGG
Cysteine
Stop
Tryptophan
AUU
AUC
AUA
AUG
Isoleucine
Methionine
CUU
CUC
CUA
CUG
Leucine
GUU
GUC
GUA
GUG
Valine
UUU
UUC
UUA
UUG
Phenylalanine
Leucine
The diagram below shows part of a messenger RNA molecule.
(i)
Place a cross in the box next to the complementary sequence of bases
found on the strand of the DNA molecule, from which part of this mRNA
molecule was synthesised.
(1)
A
G G T A A G C G C C T
T
B
G G U A A C G C G G A A
C
A A C G G A U A U U G G
D
A A C G G A T A T
T G G
(ii) Place a cross in the box next to the sequence of amino acids found in the
polypeptide chain that is coded for by this part of the mRNA molecule.
(1)
A
proline lysine alanine valine
B
proline phenylalanine alanine valine
C
glycine lysine arginine glutamine
D
proline lysine alanine glutamine
(iii) Place a cross in the box next to the final codon on this mRNA molecule if
GUU is the last codon for an amino acid.
(1)
A
AGU
B
ACU
C
UCA
D
UGA
22
*P38170A02228*
7
When vegetables are cooked in boiling water, they may lose some of their nutrients.
The graph below shows the effect of cooking on the content of three vitamins and
two minerals found in carrots.
(a) Using the information in the graph, compare the effects of cooking on the content
of vitamins and minerals found in carrots.
(3)
. . . . . . . . . . . . . . . . . . . . . . . . . . . . . . . .
7
6
5
4
3
2
1
0
Vitamin C Vitamin A Vitamin E Manganese
Zinc
Nutrient type
Raw carrot
Cooked carrot
Nutrient c
o
nt
ent of carr
*(b) It has been suggested that cooking food in a microwave oven does not reduce the
nutrient content of foods by as much as cooking in boiling water.
A student wanted to test this idea on the vitamin C content of carrots.
Describe an investigation that the student could carry out to compare these two
methods of cooking on the vitamin C content of carrots.
(5)
24
*P38170A02428*
8
Many different diets are available for people who want to lose weight. There is a lot
of confusion over the merits of each one.
A scientist carried out an investigation to compare the effects of diet P and diet Q, on
volunteers.
The changes in mass of two groups of volunteers on each of these diets were
monitored over a 12-month period.
The graph below shows the mean changes in mass for each group of volunteers.
(a) (i)
Compare the mean change in mass, over the first 6 months, for these two
groups of volunteers.
(3)
. . . . . . . . . . . . . . . . . . . . . . . . . . . . . . . .0
–1.0
–2.0
–3.0
–4.0
–5.0
–6.0
–7.0
Diet P
Diet Q
Length of time on diet / months
0
2
4
6
8
10
12
M
(ii) Suggest why there was an increase in the mean mass of the volunteers on
both diets between 6 months and 12 months.
(1)
. . . . . . . .
(iii) State two variables that the scientist needed to control in this investigation.
(2)
1
. . . .2
. . . .(b) Suggest why exercise is usually included as part of a weight loss programme.
(3)
. . . . . . . . . . . . . . . . . . . . . . . . . . . . . . . .