THE INFLUENCE OF CHROMATIN STATE ON PLURIPOTENCY, TRANSLOCATIONS, AND GENE REGULATION IN HUMAN CELLS
Zhuzhu Z. Zhang
A dissertation submitted to the faculty of the University of North Carolina at Chapel Hill in partial fulfillment of the requirements for the degree of Doctor of Philosophy in the
Curriculum of Bioinformatics and Computational Biology.
Chapel Hill 2014
Approved by: Terry Magnuson Terrence S. Furey Gregory E. Crawford Yufeng Liu
ABSTRACT
ZHUZHU Z. ZHANG: The influence of chromatin state on pluripotency, translocations, and gene regulation in human cells
(Under the direction of Terrence S. Furey)
A human body consists of more than a thousand cell types, each having a unique identity and function. Despite their distinct functions, all the different cells contain the same genetic information encoded in the human genome. One of the fundamental questions in biology is- how does a single genome provide the instruction for different cell types? We have learned that only a small part of the genomic information is used in each cell, and that the usage of the genome varies in different cells. The precise
regulation of the genome usage is the key to cell identity.
The usage of the genomic information highly depends on whether the DNA sequence containing specific information is directly accessible to DNA-binding proteins such as transcription factors that read and translate the encoded information. Most of the genomic DNA wrapped around histone proteins, forming the nucleosomes. Most DNA-binding proteins cannot bind to their target DNA sequences if a nucleosome is present. Therefore, the nucleosome-depleted regions, “open chromatin”, represent regions of the genome that are accessible and the genomic information that is used in the cell. In this dissertation, I study the landscape and function of open chromatin, and its role in defining cell identity and function.
reestablishment of pluripotency in terminally differentiated cells by reprogramming the cell fate (Chapter II). Induced pluripotent stem cells (iPSCs) are reprogrammed from differentiated somatic cells. Compared to their naturally existing counterpart embryonic stem cells (ESCs), iPSCs have very similar but in many cases slightly altered developmental potential when differentiating into other cell types. The cause of the different development potential is poorly understood. In this study, I show that the regulatory landscape defined by open chromatin is highly similar between hESCs and hiPSCs but differs at a set of key development genes. More importantly, the chromatin differences do not appear to affect the transcription profiles at the pluripotent state, but instead impact the regulation of transcription upon differentiation. These results suggest that the accessibility of genomic information controlled by chromatin structure does not only regulate the cell identity at its current state, but also influence the precise
regulation of its developmental potential.
In addition, I describe a high-throughput method I developed for functional annotation of the regulatory elements marked by open chromatin (Chapter III). Using this approach, I
ACKNOWLEDGMENTS
I am deeply grateful to the many people who have made this dissertation possible. First, I would like to sincerely thank my mentors, Dr. Terry Furey and Dr. Greg Crawford. I could not have finished this dissertation without your immeasurable support, guidance, and encouragement. I also thank Dr. Jason Lieb for providing an environment rich with resources, exciting ideas, and engaging science. I am thankful to the members of my committee, Dr. Terry Magnuson, Dr. Yufeng Liu, and Dr. Joe Ibrahim, for the helps and suggestions on my scientific training, and especially Dr. Terry Magnuson and Dr. Yufeng Liu for their advice on my career development. I have had the privilege to work with many other amazing scientists, including but not limited to Josh Chenoweth and Paul Tesar on the stem cell project, Elliott Margulies and Hatice Ozel Abaan on the high-throughput functional assay, Tom Misteli and Bharat Burman on the
chromosomal translocation project, and Wei Sun and Naim Rashid on various statistical topics. Your knowledge and scientific visions taught me to think and do science.
scientifically. I am grateful to all my friends, especially Janet Doolittle, Alicia Midland, Meng Jin, Saijun Xue, and “XiaoZei”, for your company and moral support. I thank Laurie Mesibov for showing me how kind and strong a soul could be. I would also like to thank the experience of graduate school itself. Unquestionably it has been the most significant and meaningful years in my professional and personal life. It has taught me how to be a scientist, and more importantly, how to be the best of myself.
Last but not least, I cannot possibly say enough to thank my parents Siji Zhang and Yisheng Song. You are the BEST parents and friends, you made who I am today. You have been so loving and supportive; you are always there for me. Even in the roughest times, I am
comforted knowing that you are by my side. I am so sorry that I have been away all these years. I hope you know that I really love what I do, and I am forever indebted to you for your
TABLE OF CONTENTS
LIST OF TABLES ... xii
LIST OF FIGURES ... xiii
LIST OF ABBREVIATIONS AND SYMBOLS ... xv
CHAPTER I: INTRODUCTION ... 1
1.1 Chromatin dynamics and transcription regulation ... 2
1.1.1 Open chromatin is a hallmark of active regulatory elements ... 2
1.1.2 Genome-wide mapping of open chromatin ... 4
1.2 Chromatin in human pluripotent stem cells ... 6
1.2.1 iPSCs differ from ESCs in subtle but potentially important ways. ... 6
1.2.2 Complete reconfiguration of chromatin structure during reprogramming is fundamental to the pluripotent identity of iPSCs. ... 9
1.3 Functional annotation of regulatory elements in the human genome ... 10
1.3.1 Functional annotation of the human genome requires developing high-throughput methods to efficiently predict and test regulatory element function on a genome-wide scale. ... 10
1.3.2 Enhancers activate gene expression in an orientation-independent manner ... 12
1.4 Chromosomal translocations in oncogenesis ... 12
1.4.1 Chromosomal translocations are genetic hallmarks of most cancer cells ... 12
CHAPTER II:INCOMPLETE REPROGRAMMING OF DNASE HYPERSENSITIVE SITES IN HUMAN IPS CELLS IS ASSOCIATED WITH ALTERED REGULATION OF DEVELOPMENTAL GENES UPON DIFFERENTIATION ... 15
2.2 INTRODUCTION ... 16 2.3 RESULTS ... 18 2.3.1 Human ESCs and iPSCs have very similar accessible chromatin profiles ... 18 2.3.2 Approximately 4% of DHS sites are differentially accessible between
hESCs and hiPSCs ... 19 2.3.3 dDHS sites often map in clusters ... 23 2.3.4 dDHS sites occur more often than expected in super-enhancers ... 25 2.3.5 hESC, hiPSC, and memory dDHS sites display differences in basal
chromatin state prior to reprogramming ... 27 2.3.6 hESC and hiPSC dDHS sites contain KLF4 motifs, and most memory
dDHS sites contain an AP-1 motif ... 31 2.3.7 Clusters of differential DNase Hypersensitive sites are connected
to loci encoding key developmental transcription factors ... 32 2.3.8 hESC and hiPSC dDHS sites are connected to distinct sets of key
developmental genes ... 34 2.3.9 Genes highly connected to dDHS sites are differentially regulated
upon differentiation ... 35 2.4 DISCUSSION ... 42
2.4.1 Differential DNase sites occur in clusters, an arrangement of
regulatory elements seen at key lineage-specific genes across cell types ... 43 2.4.2 Complete chromatin reconfiguration at a given locus varies
according to the local chromatin environment. ... 43 2.4.3 Chromatin that does not properly open or that remains improperly
closed in iPSCs harbors features inherently resistant to reprogramming ... 45 2.4.4 Imcompletely reprogrammed sites may become functionally relevant
2.7 SUPPPLEMENTAL DATA ... 56
CHAPTER III: INITIAL DEMONSTRATION OF A STRATEGY FOR EN MASSE FUNCTIONAL CHARACTERIZATION OF HUMAN ENHANCER ELEMENTS ... 62
3.1 OVERVIEW ... 62
3.2 INTRODUCTION ... 63
3.3 RESULTS ... 65
3.3.1 A high-throughput method to test enhancer function of FAIRE-enriched DNA fragments. ... 65
3.3.2 3,428 DNA elements associated with orientation-independent enhancer activity were identified ... 69
3.3.3 Fragments positive for enhancer function tend to lie distal to transcription start sites ... 73
3.3.4 Genes close to identified enhancer elements were relatively highly expressed ... 74
3.3.5 DNA motifs in identified enhancer elements ... 74
3.4 DISCUSSION ... 77
3.5 METHODS ... 80
CHAPTER IV: SPECIFIC HISTONE MODIFICATION PATTERNS MARK TRANSLOCATION BREAKPOINTS ... 84
4.1 OVERVIEW ... 84
4.2 INTRODUCTION ... 85
4.3 RESULTS ... 88
4.3.1 Systematic comparative analysis to identify chromatin features that are enriched at recurrent chromosomal translocation sites in hematopoietic malignancies ... 88
4.3.2 Translocation genes are enriched for H3K4me1 in CD34+ cells ... 90
4.4 METHODS ... 98
4.5 SUPPLEMENTAL DATA ... 102
CHAPTER V: DISCUSSION AND PERSPECTIVES ... 106
LIST OF TABLES
Table 3.1. Sequencing depth, number of mapped reads, and enriched FAIRE
LIST OF FIGURES
Figure 1.1. Open chromatin regions ... 3
Figure 1.2. DNase I hypersensitivity and FAIRE detect open chromatin regions ... 5
Figure 2.1. Experiment description and data overview ... 20
Figure 2.2. Approximately 4% DHS sites are differentially open ... 22
Figure 2.3. dDHS sites occurred in clusters. ... 24
Figure 2.4. dDHS regions show differences in local chromatin environment in differentiated somatic cells prior to reprogramming. ... 29
Figure 2.5. dDHS sites clustered around developmental genes. ... 33
Figure 2.6. Incomplete chromatin reconfiguration may foreshadow altered gene regulation upon differentiation. ... 37
Figure 2.7. Incompletely reprogrammed DHS sites around GABR locus foreshadows altered expression after in vitro differentiation. ... 40
Figure 2.8. hiPSC and hESC lines have similar expression profiles. ... 56
Figure 2.9. Identification of hESC-, hiPSC-, and fibroblast-specific DHS sites. ... 56
Figure 2.10. Differential DHS (dDHS) sites and dCOREs cluster nonrandomly across the genome and are connected to developmental genes. ... 57
Figure 2.11. The local chromatin environment in differentiated somatic cells prior to reprogramming - AG04450. ... 58
Figure 2.12. Motif enrichment, genomic location, and gene connectivity of dDHS sites. ... 59
Figure 2.13. Location of dDHS sites surrounding key developmental genes. ... 60
Figure 2.14. Differential DHS sites at gene loci foreshadow expression misregulation upon in vitro differentiation. ... 61
Figure 3.1. Experiment design for high-throughput characterization of enhancer activities of open chromatin regions isolated by FAIRE. ... 67
Figure 3.2. Collecting GFP-positive cells in fluorescence activated cell sorting (FACS). ... 69
Figure 3.3. Most enhancer positive regions appeared to be distal regulatory elements that drove the expression of nearby genes. ... 72
Figure 4.1. Comparison of histone modifications and DNase hypersensitivity signals
in 74 translocation genes and their 5076 control genes. ... 91 Figure 4.2. Comparison of histone modifications in individual translocation genes. ... 93 Figure 4.3. Histone modification levels in 10 windows around the breakpoint in
genes HOXA11 and RARA ... 97 Figure 4.4. Comparison of histone modifications and DNase hypersensitivity signals in
breakpoint regions of 19 translocation genes and control regions of their control genes. ... 104 Figure 4.5. Histone modification levels around the breakpoint in gene ABL1 ... 105 Figure 5.1. Schematic representation of reporter constructs to be employed for
LIST OF ABBREVIATIONS AND SYMBOLS
ChIP: chromatin immunoprecipitation
DHS: DNase I hypersensitivity
ENCODE: The Encyclopedia of DNA Elements
FAIRE: formaldehyde-assisted isolation of regulatory elements
FISH: fluorescence in situ hybridization
kb: kilobase
Mb: megabase
PCA: principle components analysis
RNA-seq: RNA-sequencing
RPKM: Reads per kilo base per million
RRBS: reduced representation bisulfite sequencing
TF: transcription factor
CHAPTER I: INTRODUCTION
An adult human body contains more than 1013 cells [1] that consist of thousands of
different cell types each with a specific identity performing a specialized function. All cells inherit and share the same genome that is contained in the zygote. Therefore, a fundamental question in biology is – how does a single genome encode the information required to produce the diversity of cell types? More specifically, how is the information accessed and used in different cell types, and how is this access regulated?
To further understand the regulatory role of chromatin dynamics at the nucleosome level in determination and specification of cell identity and function, I examined genome-wide
chromatin states in human embryonic stem cells (hESCs) and induced pluriopotent stem cells (hiPSCs). More specifically, I investigated how subtle differences in the open chromatin landscape between the two human pluripotent cell types may lead to different regulation of transcription during cellular differentiation (Chapter II). In addition, I developed a high-throughput method to test the function of regulatory elements dictated by open chromatin on a genome-wide scale in a single experiment (Chapter III). Finally, I explored the role of chromatin structure and predisposition of specific histone modifications in chromosomal
translocation prior to oncogenesis (Chapter IV). As an introduction to this dissertation, I review the function and identification of open chromatin, detail our current understanding of epigenetic reprogramming during hiPSCs production, discuss technologies and obstacles of functional annotation of human regulatory elements, and close with a brief description into chromosomal translocation in oncogenesis.
1.1 Chromatin dynamics and transcription regulation
1.1.1 Open chromatin is a hallmark of active regulatory elements
from chromatin in eukaryotic cells [14] [5,15]. Other factors that influence the nucleosome stability and positioning include the inherent properties of DNA sequence [16], the activity of chromatin remodeling complexes such as SWI/SNF (SWItch/Sucrose NonFermentable) [17], transcriptional initiation and elongation by RNA polymerases [18], and the post-translational modification of histone proteins [19-21] and incorporation of histone variants [19,22,23]. In any given cell type, those mechanisms work together to establish an overall chromatin architecture in which regions of open chromatin dictate the accessible part of genome and active regulatory elements. Genome-wide mapping and characterization of open chromatin in different cell types can provide insights in how the variation in accessibility and utilization of genomic information contribute to the specification of different cell identities and functions.
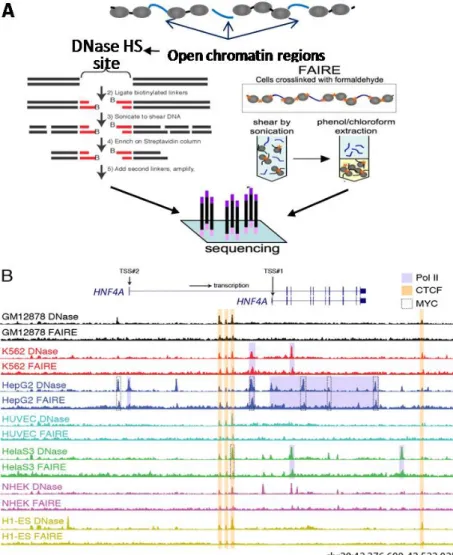
Figure 1.1. Open chromatin regions. In most cases, a DNA-binding protein (light blue sphere)
1.1.2 Genome-wide mapping of open chromatin
Regions of open chromatin can be identified by deoxyribonuclease (DNase I)
Hypersensitive site mapping by preferential digestion of nucleosome-free regions [2-4,6,24,25], or FAIRE (Formaldehyde-Assisted Isolation of Regulatory Elements) which probes open chromatin through differences in formaldehyde cross-linking efficiency between nucleosomal and non-nucleosomal DNA [7,14,26-28].
DNase I is an endonuclease that cleaves DNA at the phosphodiester linkages of its backbone. When the DNA is nucleosomal as it is in chromatin, regions with nucleosome depletion is cut preferentially by DNase I which is commonly referred as hypersensitive to DNase I cleavage [2-4,6]. DNase I hypersensitivity (DHS) was originally reported at the
transcription start sites (TSSs) of heat shock genes upon activation in Drosophila, and has since been used to detect regions of open chromatin and the underlying regulatory elements. DHS sites mapping can be carried at individual loci or genome-wide via coupling with microarrays [24,25,29] or, as in most recent studies, with high-throughput sequencing [7,8,25,30,31].
FAIRE (Formaldehyde Assisted Isolation of Regulatory Elements) [14,26,28] uses differences in formaldehyde cross-linking efficiency between nucleosomal and non-nucleosomal DNA to not only detect but also isolate the nucleosome-depleted DNA. Formaldehyde crosslinks proteins and DNA in direct contact [32,33]. Within each nucleosome core on average 146 bp DNA wraps around an octamer of histone proteins, providing approximately 10 to 15 histone-DNA interaction sites [34] for potential crosslinking by formaldehyde. In contrast, most histone- DNA-binding proteins bind to DNA sequences of 5 to 15 bp [35,36], resulting few potential
first cross-linked with formaldehyde, sheared by sonication, and then a phenol-chloroform extraction is performed in which nucleosome-free fragments preferentially segregate and are enriched in the aqueous phase. The genomic DNA fragments in the aqueous phase can then be mapped by microarrays [14,29] or high-throughput sequencing [7,27,31].
Figure 1.2DNase I hypersensitivity and FAIRE detect open chromatin regions that identify
More recently, a new assay for probing open chromatin regions, ATAC-seq, was reported based on direct in vitro transposition of sequencing adaptors into native chromatin [37].
Transposons have been shown to preferentially integrate into nucleosome-depleted regions of the genome [38]. In ATAC-seq, adaptors for high-throughput sequencing are integrated into regions of open chromatin by hyperactive Tn5 transposase. The adaptor-tagged genomic regions can then be amplified and sequenced. ATAC-seq is an exciting new method for mapping open chromatin, as its simple two-step protocol requires less time than DNase I or FAIRE and is reported to perform on as few as 500 cells [37], while DNase I [30] and FAIRE [28] typically require at least 1 million cells.
1.2 Chromatin in human pluripotent stem cells
1.2.1 iPSCs differ from ESCs in subtle but potentially important ways.
Pluripotent stem cells possess the unique capacity to indefinitely self-renew and to develop into all cell types in an adult body. They can potentially be used for tissue replacement after injury and regenerative medicine for curing disease such as Parkinson’s. The naturally occurring pluripotent stem cells are embryonic stem cells that are derived from an early-age embryo [39]. In 2006, an artificial type of pluripotent stem cells, induced pluripotent stem cells, were
generated from mouse somatic cells by forced expression of a defined set of factors [40]. In 2007, human iPSCs were generated using similar strategies [41,42]. For use in regenerative medicine and disease research, iPSCs are proposed to have two advantages over their natural counterpart: they avoid the ethical concerns regarding the use of human embryos, and they can be derived in a patient-specific manner to avoid immune rejection after transplantation.
modification patterns [56-58], teratoma formation [40-42,59,60], and ability to differentiate into all germ layers [40-45,61-64]. Viable and fertile adult mice have been produced from mouse iPSCs, demonstrating their pluripotent potential [65-67]. On the other hand, studies have also reported genetic and epigenetic differences between iPSCs and ESCs.
Alterations in the differentiation potential. Human iPSCs have been reported to have lower efficiency than ESCs in differentiation to neural [68,69] and blood lineages [70]. In addition, Human iPSCs have been suggested to have altered developmental potency [68,69,71-74]; in many cases they have skewed differentiation potential towards the cell lineage of their cells of origin [71-73,75]. For example, iPSCs derived from human pancreatic islet beta cells were shown to differentiate more readily into insulin producing cells [73]. Most importantly, mice produced from mouse iPSCs seemed to have a higher death rate, with some displaying physical abnormalities [65,74]. In addition, Zhao et al. reported that in contrast to mouse ESCs, mouse iPSCs trigged an immune reaction after implanted in mice [76].
Alterations in genomic DNA sequence. Compared to human ESCs, studies show that human iPSCs have more novel copy-number variations (CNVs) [77-79], and ten-times higher predicted mutation frequency [80].
Transcriptional activities. iPSCs and ESCs have very similar global expression [81]. Nonetheless, a set of genes including some developmental genes were reported to be
modifications [56], and only partially correlate with the DNA methylation patterns at the promoters of these genes [72].
Epigenetic abnormalities. Despite the global similarities of DNA methylomes and histone modification patterns in iPSCs and ESCs [47,48,72,85-88], aberrant methylation of CG dinucleotides [8,31,72,88-101] and incomplete reinstating of non-CG methylation[99-101], an epigenetic feature seen only in pluripotent cells, were observed. The methylation inconsistencies between iPSCs and ESCs are associated with epigenetic memory of somatic progenitors [71-73,102] and de novo methylation aberrations, which appears to impact developmental potentials [69,71-73,102]. Residual somatic DNA methylation patterns and aberrant de novo methylations in iPSCs were reported to transmit to differentiated cells and contributed to transcription
variation upon differentiation [101].
A few common themes regarding the genetic and epigenetic stabilities of ESCs and iPSCs have emerged [103]. First, these genetic and epigenetic abnormalities represent both cell-of-origin memories [71,73,83,104] and features that are unique to iPSCs [73,81]. Some of the abnormalities seem to be common in several independently derived iPS cell lines [93,94,99,101], while others tend to be laboratory-[84,88] or technique- specific [83,105], thus are likely
stochastic rather than functional variations. Second, the observed differences between iPSCs and ESCs can arise at different stages of reprogramming and subsequent culture of iPSCs [77-79]. Notably, some lesions, for example novel CNVs, seem to be selected against and disappear in higher-passage iPSCs [78], indicating they are not permanent. Third, regions prone to
Taken together, these data indicate that iPSCs differ in subtle but potentially important ways from ESCs. Closer inspection of these differences is needed to understand how they may potentially affect the regulatory program that controls the pluripotent cell identity.
1.2.2 Complete reconfiguration of chromatin structure during reprogramming is
fundamental to the pluripotent identity of iPSCs.
The pluripotent stem cell state is under the control of a transcriptional program which is likely implemented in the context of a particularly “open” chromatin state [106,107] that is unique to pluripotent stem cells. The chromatin in embryonic stem cells is at a more open state when compared with chromatin in somatic cells [55,108,109]. This globally open state of chromatin is considered important for the maintenance of pluripotency, as it allows DNA
regulatory elements openly accessible to transcriptional regulators [106,110]. Reprogramming of somatic cells to pluripotent stem cells requires reconfiguration, especially re-opening, of
chromatin. Incomplete re-opening of chromatin during reprogramming may leave an epigenetic memory of the original cell type, and inaccurate re-opening may result in aberrant gene
expression. Thereby, genome-wide characterization of the chromatin structure in iPSCs in comparison to ESCs and parental somatic cells is essential to understand the cell identity of iPSCs.
Genome-wide maps of nucleosomes with histone H3K4me3 and H3K27me3
1.3 Functional annotation of regulatory elements in the human genome
1.3.1 Functional annotation of the human genome requires developing high-throughput
methods to efficiently predict and test regulatory element function on a genome-wide scale.
DNA regulatory elements are short non-coding regions that can be bound by sequence-specific regulatory factors that contribute to the regulation of the expression of genes. Promoter, enhancer, insulator and silencer are major categories of regulatory elements. The annotation of the human genome has suggested the existence of a large number of regulatory elements. As part of the effort of the Encyclopedia of DNA Elements (ENCODE) consortium, over 100,000
putative regulatory elements are defined by open chromatin in each of the more than hundred human cell types and tissue samples [7,8,29,31]. The number of new sites identified has not yet saturated even as the number of cell lines analyzed has increased [7,8,31]. Given the variety of cell types present in human, the total number of regulatory elements in human genome is likely on the order of 106 [8,31,111]. While DNase I, FAIRE, ChIP and other methods have made identification of putative regulatory elements routine, those methods do not provide information regarding the functional activity of each element. The rapidly increased list of putative regulatory elements has created an urgent need for genome-scale methods that can efficiently annotate the functions of these putative elements.
Regulatory elements have been discovered and characterized by gene-centric studies and systematic large-scale approaches. In gene-centric studies, reporter and transgenic assays are commonly used and rather accurate. However, these experiments are labor-intensive, and the can only test ~10 elements in a single experiment [112-124]. Systematic approaches include
I hypersensitive site mapping [7,8,24,25,29-31], FAIRE [7,14,27,31], and ChIP [131-135]. Computational predictions often exhibit high false positive and false negative rates [136,137], and thus the identified candidates need to be validated by experimental methods. The function of each individual element identified by DNase hypersensitivity of FAIRE is unknown and
currently often inferred computationally. Data from ChIP experiments for chromatin marks that are specifically associated with promoters, enhancers, insulators or silencers can be used to directly identify these elements. For example, monomethylation of histone H3 at lysine residue 4 (H3K4me1) [29,31,137] and transcriptional coactivator p300 [24,31] binding have proven
predictive for enhancer activity of genomic elements. Taken together, although a large number of putative regulatory elements can be identified by existing large-scale approaches, compatible large-scale assays that can functionally test these putative elements need to be developed.
Traditionally, regulatory elements have been functionally characterized one or a few at a time through serial transfection of individual reporters [112,117,118,121-124], but more recently DNA elements have been characterized using systematic large-scale approaches [95,97,98,138]. One such high-throughput functional method was designed to characterize promoter regions in the human genome [138]. In this study, random fragments from sheared genomic DNA were cloned into a GFP-based promoter reporter vector and tested for their ability to drive GFP
tested enhancers were synthesized from known or predicted enhancer sequences. Such synthesis-based approaches are costly and require exact DNA sequences of tested elements, thus it is hard to adapt these to the genome-wide annotation of thousand of native enhancers in a given human cell type of which many are unknown elements.
1.3.2 Enhancers activate gene expression in an orientation-independent manner
Unlike promoters that are typically immediately upstream of genes, enhancers can be distant-acting regulatory elements that enhance transcription levels of genes by acting on their promoters. They can be located upstream, downstream or within their target genes, and can modulate expression independent of their orientation [139,140]. They do not need to be
particularly close to the targeted genes, and sometimes are found extremely far from their targets [140-142], or even on a different chromosome [143,144]. Enhancers have been shown involved in many developmental and disease-relevant processes [140,145-147].
1.4 Chromosomal translocations in oncogenesis
1.4.1 Chromosomal translocations are genetic hallmarks of most cancer cells
Chromosomal translocations have been reported in several forms of human cancer [61-64,148-151] and are implicated in approximately 20% of cases of cancer morbidity [150,151]. Translocations can lead to tumorigenesis by activating oncogenes [151-154], creating fusion transcripts [151,153,155-157], or disrupting normal gene activity resulting in malignant
Chromosomal translocations are genetic hallmarks of most cancer cells, and some translocations are responsible for malignant transformation [61-64,148]. In several types of cancers, translocations are the causative agent of disease by producing or activating oncogenes responsible for malignant transformation [151,153,155-157]. On a molecular level,
translocations require the formation of DNA double-strand breaks (DSBs) at two or more genomic loci, followed by the illegitimate joining of broken chromosomal ends through DNA repair. Depending on the chromosome breakpoints, a translocation can result in the disruption or misregulation of normal gene function [158,159]. These molecular rearrangements, in many cases, are considered to be the primary cause of various cancers [61-64]. Indeed, over the past few decades, clinical cytogeneticists have been able to link specific chromosome breakpoints to clinically defined cancers, including subtypes of leukemias, lymphomas, and sarcomas [61-64,148-151]. Virtually all of the translocations observed in tumors have arisen through somatic events, so these are not inherited in families [149-151]. Translocations in some lymphomas and leukemias lead to the juxtaposition of promoter or enhancer elements from one gene with the intact coding region of another gene [151-154]. In other cases such as in Chronic myelogenous leukemia (CML) and many of the acute leukemias, translocations result in the recombination of the coding regions of two different genes [151,153,155-157]. This results in a fusion protein that might have a new function.
1.4.2 The mechanisms by which translocations consistently recur between certain sites of
the genome are largely unknown.
CHAPTER II:
INCOMPLETE REPROGRAMMING OF DNASE HYPERSENSITIVE SITES IN HUMAN IPS CELLS IS ASSOCIATED WITH ALTERED REGULATION OF
DEVELOPMENTAL GENES UPON DIFFERENTIATION
2.1 OVERVIEW
Human induced pluripotent stem cells (hiPSCs) are similar to human embryonic stem cells (hESCs) in many respects, but can have altered differentiation potential and DNA
methylation patterns. A central unanswered question is how completely chromatin in hiPSCs is reconfigured to resemble that of blastocyst-derived hESCs, and whether any imperfections in the chromatin remodeling process are functionally relevant. To address these questions, we mapped DNaseI hypersensitive (DHS) sites using DNase-seq, which identify regions of nucleosome depletion and transcription factor binding, in seven samples: three human ESC lines, two human iPSC lines, and their two matched parental fibroblasts. Over 95% of DHS sites were shared between hESCs and hiPSCs, but we detected thousands of reproducible differential DHS (dDHS) sites. We show that dDHS sites that are not completely reprogrammed are associated with
different levels of active and repressive chromatin marks in the parental cells prior to
show differential expression in the examined hiPSCs and hESCs upon differentiation into mesendodermal or neuroectodermal lineages. Thus, regulatory elements susceptible to
incomplete reprogramming in hiPSCs can be anticipated by the chromatin state in the parental cell, and flaws in regulatory element reprogramming foreshadow gene regulation upon hiPSC differentiation. While we do not claim that the exact set of dDHSs found here exists between any given hESC and hiPSC line, we predict that any set of dDHS sites will share the properties of the set we describe here.
2.2 INTRODUCTION
iPSCs and ESCs are similar in many respects, including cell morphology, expression of pluripotency markers, histone modification patterns, teratoma formation, and ability to
differentiate into all germ layers [41-44,47,169-171]. However, there are also many differences [77-80,99-101], and recent studies suggest that some of these differences may be rooted in a failure to fully recapitulate an ESC chromatin state in iPSCs. For example, despite the global similarity of human iPSC and ESC DNA methylomes, aberrant methylation of CpG islands and incomplete restoration of methylation at non-CG mega-regions were observed in hiPSCs [99-101]. The methylation inconsistencies between iPSCs and ESCs are associated with epigenetic memory of somatic progenitors [71-73,102] and de novo methylation aberrations, which appears to impact developmental potentials [69,71-73,102]. Residual somatic DNA methylation patterns and aberrant de novo methylations in iPSCs were transmitted to differentiated cells and
SOX2, KLF4 and c-MYC target genes [172]. Thus, understanding the extent to which chromatin is correctly reconfigured at gene regulatory elements is fundamental to understanding how iPSCs are formed, how any underlying differences could lead to changes in transcriptional programs upon differentiation, and how these differences impact developmental and therapeutic potential.
In this study we report genome-wide mapping and characterization of DNaseI hypersensitive (DHS) sites in human ESCs (hESCs), human iPSCs (hiPSCs), and matched parental fibroblast lines. DHS sites represent regions of nucleosome depletion and transcription factor binding to DNA, and therefore is a powerful readout of the regulatory state and potential of a given cell type [6,8,25]. While over 95% of DHS sites were shared between hESC and hiPSC lines, we identified thousands of differential DHS (dDHS) sites. Compared to completely reprogrammed genomic regions, DHS sites that were present in ESCs but were not fully
reprogrammed to an open state in iPSCs displayed lower levels of active chromatin marks and higher levels of repressive marks in the parental cell line, indicating a likely mechanism behind sub-optimal reprogramming. Differential DHS (dDHS) sites such as these were often found near each other, forming dCOREs (differential Clusters of Open Regulatory Elements), and also occurred preferentially in “super-enhancers”, which were recently identified in hESCs and shown to be important for ES cell identity and function [31]. Clusters of dDHS sites were also significantly enriched around key developmental genes, including SOX, ZIC, PAX, HOX, FOX,
and HMX gene family members. Interestingly, the transcriptional output of those genes was indistinguishable between undifferentiated hESCs and hiPSCs, but after differentiation towards mesendodermal or neurectodermal lineages, many such genes displayed differential expression profiles. Our study shows that chromatin sites in somatic cells that are resistant to
reprogramming in iPSCs foreshadow differences in regulation of gene expression upon
differentiation. DNase-seq screening of undifferentiated hiPSC lines may identify those that are unable to efficiently differentiate into specific somatic cell lineages and reveal new insight into the genetic and epigenetic mechanisms that regulate early human development.
2.3 RESULTS
2.3.1 Human ESCs and iPSCs have very similar accessible chromatin profiles
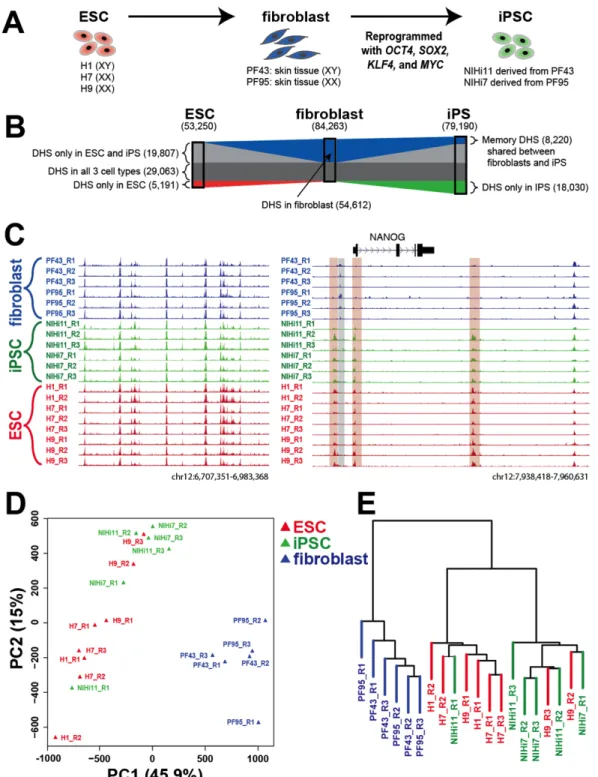
To assess the completeness of chromatin reconfiguration during the reprogramming of human somatic cells, we examined the landscape of DNaseI hypersensitive (DHS) sites across the genome in seven samples: three human embryonic stem cell (hESC) lines (H1, H7, and H9), two human induced pluripotent stem cell (hiPSC) lines, and their two matched parental
fibroblasts (Figure 2.1.A-C). To ensure reproducibility, three biological replicates were analyzed from each line (two replicates of H1; see Methods). DHS sites mark most transcription factor binding sites and overall chromatin accessibility [6,8,25], and therefore provide a powerful indicator of global chromatin reprogramming. We also measured RNA levels in all samples using Affymetrix human exon arrays.
As expected, the accessible chromatin profiles of hiPSCs closely resembled those of hESCs, but were distinct from their parental fibroblasts (Figure 2.1.B). For example, three DHS sites surrounding NANOG, a key transcriptional regulator of pluripotency, were shared only by hESC and hiPSC lines, while a separate DHS site near NANOG was present only in fibroblasts
(Figure 2.1.C). Among the 79,190 DHS sites that were common to all hiPSC lines and the
53,250 DHS sites that were common to all hESC lines, 48,870 sites were shared between them
(Figure 2.1.B). Of these, 29,063 DHS sites were also present in parental fibroblasts, leaving
sites were shared between hiPSCs and their fibroblast progenitors and were not found in hESCs. This indicates that the chromatin of hiPSCs is far more similar to hESCs than to their cell type of origin.
We also examined similarity among the samples by analyzing the DHS signal intensity using principle component analysis (PCA) (Figure 2.1.D) and hierarchical clustering (Figure
2.1.E). Similar analyses were performed using RNA expression data (Supplemental Figure
2.1.A-B). In each analysis, the hESC lines grouped together with the hiPSC lines in both
chromatin and gene expression space and were well separated from the parental fibroblast lines. This analysis confirmed that the genome-wide chromatin landscapes of hiPSCs are more similar to those of hESCs, and both are comparatively different from the landscapes of the parental fibroblast cells. This general similarity in DHS sites between hiPSCs and hESCs is consistent with what was previously observed using alternate methods such as DNA methylation and histone profiling [88,99,101,173].
2.3.2 Approximately 4% of DHS sites are differentially accessible between hESCs and
hiPSCs
Differentially methylated regions exist between ES and iPS cells [99,101]. Some of these regions reflect methylation marks that were not erased from somatic cells during the
reprogramming process (called “memory” marks), while others were de novo methylation events specific to iPSCs.
Figure 2.1.Experiment description and data overview. A) Experimental design. DNase-seq and expression analysis was performed on three human ESC lines, two skin fibroblast lines, and two iPS lines that were derived from the skin fibroblasts. Human iPS cell lines were generated with pMX-based retroviral vectors carrying OCT4, SOX2, KLF4, and MYC [41].Three
fibroblasts. C) Representative DNase-seq data (left) from all three cell types shows data is of high quality. Region surrounding NANOG locus (right) shows DHS sites that are similar between hiPSC and hESC lines (orange boxes), and were different to DHS sites found only in fibroblast lines (gray box). Biological replicates (R1, R2, and R3) were shown for each cell line. A DHS sites downstream of NANOG was detected in all cell lines. The y-axis for each DNase-seq dataset was fixed at a constant normalized read depth. D-E) Replicates of hiPSC lines clustered with replicates of hESC lines and were separated from their parental fibroblast lines in chromatin space by both PCA clustering (D) and hierarchical clustering (E). (See also Figure S1)
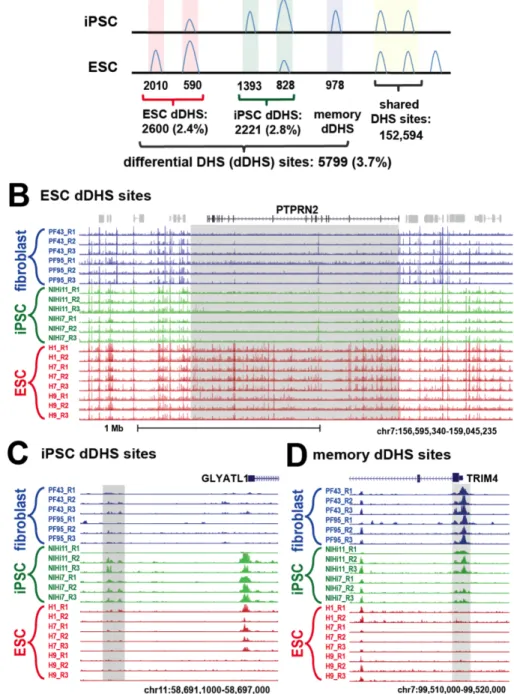
Figure 2.2 Approximately 4% DHS sites are differentially DHS (dDHS) between hESCs
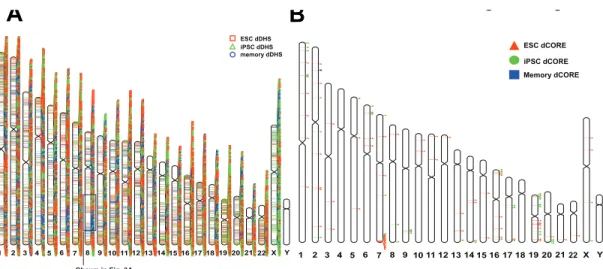
and hiPSCs. A) Genome-wide analysis identifies 5,799 hESC, hiPSC, and memory dDHS sites.
Specifically, we identified 2,600 hESC dDHS sites that were identified only hESCs or were more open in hESCs, 2,221 hiPSC dDHS sites that were identified only in hiPSCs or more open in hiPSCs, and 978 memory dDHS sties that were open in both iPSCs and their parental fibroblasts but not in hESCs. B) A cluster of hESC dDHS sites (gray box) at PTPRN2 locus. C) Example of hiPSC dDHS site upstream of GLYATL1 gene. D) Example of memory dDHS site at TSS of
2.3.3 dDHS sites often map in clusters
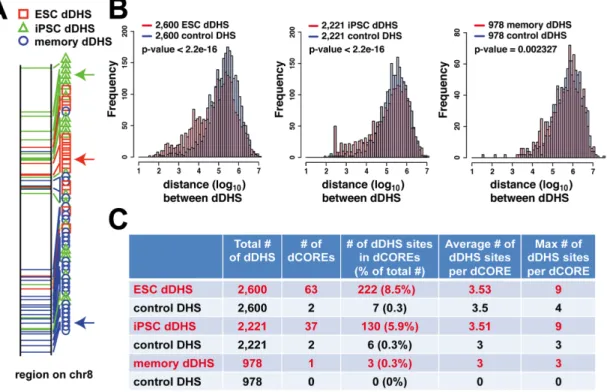
We noticed a large cluster of dDHS sites at the PTPRN2 gene locus that span a 1Mb genomic region (Figure 2.2B). In this region, 69 of the 72 DHS sites were identified as hESC dDHS sites, while none of these were hiPSC dDHS sites. It has been previously suggested that clusters of dDHS in close proximity might act together to influence gene expression or other chromosomal functions [7,27]. To systematically determine whether dDHS sites tended to cluster together in the genome, we plotted the location of all dDHS sites on individual chromosomes and observed that clusters of dDHS sites grouped together in a non-random
manner (Supplemental Figure 2.3A). For example, we found large domains of similarly defined hESC dDHS sites (Figure 2.3A, red arrow), hiPSC dDHS sites (Figure 2.3A, green arrow), and memory dDHS sites (Figure 2.3A, blue arrow).
To provide a more detailed characterization of dDHS domains, we next analyzed the distance between each pair of dDHS sites within each of the three categories. A significant percentage of both hESC dDHS sites (8.5%) and hiPSC dDHS sites (5.9%) were within 10kb of another hESC dDHS site or hiPSC dDHS site, respectively (Figure 2.3B). In contrast, we found very few pairs of memory dDHS sites (0.3%) within 10kb of each other. Permutated dDHS sites rarely (< 0.3%) clustered together (see Methods). We thereby defined a dCORE (differential Clusters of Open Regulatory Elements) as a stretch of dDHS sites in which each dDHS site was within 10kb of another dDHS site of the same type. In this manner, 63 hESC dCOREs, 37 hiPSC dCOREs, and 1 memory dCORE were identified (Figure 2.3C). In contrast, only 2 clusters were identified when considering sets of permutated dDHS sites (see Methods). dCOREs were
number of hESC and hiPSC dCOREs relative to clusters of permuted dDHSs sites, these
dCOREs likely represent functionally linked differences in chromatin states between the two cell types.
Figure 2.3.dDHS sites occurred in clusters. A) Distribution of hESC, hiPSC, and memory
dDHS sites on a representative locus on chromosome 8. Note that dDHS sites appear to cluster by dDHS type. B) Distribution of dDHS sites for each chromosome (top) and relative numbers of hESC dDHS vs. hiPSC dDHS (bottom). C) A higher than expected proportion of hESC dDHS sites and hiPSC dDHS sites cluster were within 10kb of their closest hESC dDHS site or hiPSC dDHS sites, respectively. Most memory dDHS sites did not cluster. D) Clusters of dDHS of the same type define dCOREs. Each dCORE consists of at least three dDHS sites of the same type that are within 10kb of another dDHS site. (See also Supplemental Figure 2.3)
approximately 1.7 MB, and 25 non-CG mega-DMRs (after liftover) that cover approximately 29MB [99]. 20 (32%) of 63 hESC dCOREs and 8 (11%) of 72 hiPSC dCOREs overlapped with CG-DMRs, and 9 (14%) of hESC dCOREs overlapped with non-CG mega-DMRs. The overlaps were statistically significant (p-values < 2.2e-16) given the overall coverage of CG-DMRs and non-CG mega-DMRs. Notably, the PTPRN2 locus described above (Figure 2.2B) contained a non-CG mega-DMR [99], and was differentially methylated at its nearby CpGs in 9 of 17 hiPSC lines relative to 7 hESC lines analyzed by Ruiz et al. [101]. In total, 7 hESC lines were used in the two DNA methylation studies, and 22 individual hiPSC lines derived from 9 distinct parental cell lines with varied reprogramming efficiencies using 3 different protocols. Therefore, we believe that overlapped regions between DMRs highlighted in the DNA methylation studies and dCOREs identified in this study are likely features common to hiPSC lines and are biological significant. It suggests that, despite the variation in the epigenetic landscape among hiPSC lines, incomplete reconfiguration of the epigenetic state is shared by hiPSCs at a set of megabase-sized genomic regions such as dCOREs. As stated above, we predict that analysis of open chromatin in additional hiPSC lines will identify a different but partially overlapping set of dDHS sites, with the overlapping sites frequent in those shared megabase-scale regions.
2.3.4 dDHS sites occur more often than expected in super-enhancers
[176,177]. To explore whether dDHS sites overlapped super-enhancers, we examined the 684 super-enhancers identified in H1 hESCs [176].
Of all 158,393 DHS sites identified in hESCs and hiPSCs, 1,955 (1.2%) overlapped with 655 (95%) H1 super-enhancers. Using this as our baseline for the expected proportion of overlap, we found that a significantly higher proportion of hESC dDHS sites (n=75, 2.8%; p = 2.33e-10) overlapped with H1 super enhancers (n=65, 9.5% of all H1 super-enhancers). A higher
proportion of hiPSC dDHS sites (n=42, 1.9%; p-value 0.0058) also overlapped with H1 ESC super-enhancers (n=32, 4.7%). While these numbers may seem small on an absolute scale, this is to be expected given the small number and genomic coverage of super enhancers. In fact, these overlapping dDHS/super-enhancer sites have outsized significance not only statistically but biologically, occurring near key developmental genes such as SOX2, SOX2-OT (Supplemental
Figure 2.6), ZIC2, ZIC5 (Supplemental Figure 2.7), SOX11, and SOX21 (Supplemental
Figure 2.7). Furthermore, 6 of 63 ESC dCOREs (9.5%) and 2 of 37 iPSC dCOREs (5.4%)
overlapped with H1 super-enhancers. In contrast, fewer than expected memory dDHS sites (n=2, 0.2%; p-value 7.20e-05) overlapped with H1 super-enhancers (n=2, 0.3%).
less often than expected in H1 enhancers, but more often than expected in fibroblast super-enhancers.
2.3.5 hESC, hiPSC, and memory dDHS sites display differences in basal chromatin state
prior to reprogramming
We asked why chromatin remodeling failed or was incomplete at some genomic regions, while throughout most of the genome chromatin accessibility in hiPSCs was indistinguishable from hESCs. To test whether specific genomic features are associated with impaired
reprogramming, we compared the intensity of histone modifications and transcription factor binding at dDHS sites where reconfiguration was incomplete and genomic regions that were successfully reprogrammed. Since reprogramming was initiated from the fibroblast lineage, we used ENCODE ChIP-seq data on the skin fibroblast cell line NHDF-Ad and the primary
fibroblast cell line AG04450 [31] to characterize the chromatin status at different types of dDHS sites in fibroblast cells prior to reprogramming. We examined histone modifications or variants associated with active chromatin (H3K9ac, H3K27ac, H3K4me1, H3K4me2, H3K4me3, H3K36me3, H3K79me2, H4K20me1, and H2A.Z), repressed chromatin (H3K9me3,
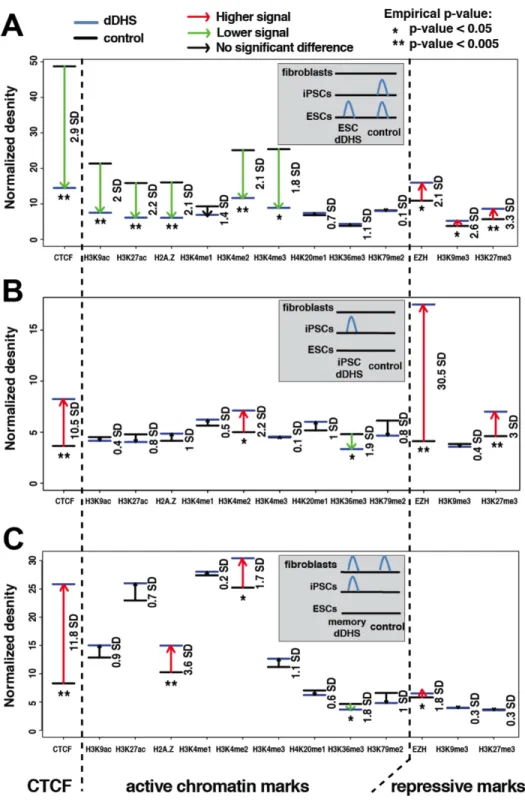
H3K27me3, and the poly-comb complex protein EZH2), and the binding of insulator protein CTCF. We compared ChIP signals in fibroblast cells at hESC dDHS sites (Figure 2.4A;
Supplemental Figure 2.4A), hiPSC dDHS sites (Figure 2.4B; Supplemental Figure 2.4B), and
memory dDHS sites (Figure 2.4C; Supplemental Figure 2.4C) to their relevant control regions (see Methods).
increased levels of all repressive marks analyzed (p-value < 0.02) (Figure 2.4A; Supplemental
Figure 2.4A). This indicates that hESC dDHS sites that failed to reprogram were in a more
closed chromatin state in fibroblasts, possibly resulting in less accessibility to transcription factors or chromatin remodelers that are required to reprogram the chromatin state of fibroblasts. The trend was consistent for ChIP-seq data from both the NHDF-Ad and primary AG04450 fibroblast cell lines (Supplemental Figure 2.4A). This observation is consistent with the
Figure 2.4dDHS regions show differences in local chromatin environment in differentiated
somatic cells prior to reprogramming compared to controls. ChIP-seq data from NHDF-Ad
fibroblasts (see gray inset for pictorial representation). Direction of significant enrichment is shown by red (higher) and green (lower) arrows. Asterisks indicate significant p-values based on random permutation analysis (* p-value < 0.05; ** p-value < 0.005). Black arrows indicate trends that did not reach significance. Relative to control sites, hESC dDHS sites had lower levels of active histone marks and higher level of repressive histone marks. B) hiPSC dDHS (blue line) were compared to control DHS sites (black line) that were identified in a previous study but are not present in any of the three cell types. Relative to control sites, hiPSC dDHS sites had higher levels of both active histone marks and repressive histone marks. C) Memory dDHS (blue line) were compared to control DHS sites (black line) that were only present in fibroblasts. Relative to control, memory dDHS sites had higher levels of active histone marks. (See also Supplemental Figure 2.4)
To our surprise, hiPSC dDHS sites displayed higher levels of active H3K4me2 chromatin marks (p-value < 0.01), repressive EZH2 and H3K27me3 chromatin marks (p-values < 0.001), and insulator protein CTCF (p-value < 0.001) in ChIP-seq data from NHDF-Ad fibroblast cells
(Figure 2.4B; Supplemental Figure 2.4B). Higher levels of both active chromatin marks
(H3K27ac and H3K4me3) and repressive chromatin marks (H3K27me3) were also observed in AG04450 ChIP-seq data (Supplemental Figure 2.4B). For this comparison, hiPSC dDHS sites were measured against genomic regions previously identified as a DHS site in at least one of >100 samples from various cell types [180] but that did not represent a DHS site in hESCs, hiPSCs, and fibroblasts (see Methods). In other words, the hiPSC dDHS sites, which were closed in somatic cells and then inappropriately opened during reprogramming, had higher levels of either repressive or active histone marks in the starting somatic cell. This conclusion was made in comparison to regions of closed chromatin in somatic cells that remained properly closed during reprogramming. The presence of either chromatin state in fibroblasts may make these regions more amenable to chromatin remodeling than other regions of closed chromatin.
Compared to fibroblast DHS sites that were successfully closed in iPSCs, memory dDHS sites had higher levels of H2A.Z (p-value < 0.001) and H3K4me2 (p-value 0.03) active
level of EZH2 (p-value 0.02) in ChIP-seq data from NHDF-Ad fibroblast cells (Figure 2.C;
Supplemental Figure 2.4C). Similar trends were observed in ChIP-seq data from the primary
fibroblast cell line (Supplemental Figure 2.4C). This indicates that compared to DHS sites that closed during reprogramming, the memory dDHS sites that were more resistant to being
reconfigured to a closed state harbored more active chromatin marks prior to reprogramming.
2.3.6 hESC and hiPSC dDHS sites contain KLF4 motifs, and most memory dDHS sites
contain an AP-1 motif
To test whether the identified dDHS sites contained unique sequence features we
performed de novo motif analysis on each class of dDHS sites. The motif for KLF4 was detected in both hESC dDHS sites and hiPSC dDHS sites (Supplemental Figure 2.5A), indicating a possible role for one of the four reprogramming factors in over- or under-reprogramming certain regulatory elements. In addition, the DNA motif for AP-1 was significantly enriched in memory dDHS sites (Supplemental Figure 2.5A). AP-1 is a transcription activator complex composed of Fos and Jun family members, and has been shown to function as a pioneer factor that facilitates access to chromatin [181]. Approximately 70% of all memory sites contained an AP-1 motif. In addition, 55% of FOSL2 and 44% of JUND ChIP-seq sites overlapped with memory sites (see
Methods), which were significantly higher than the < 10% overlap of FOSL2 and JUND
ChIP-seq sites with hESC dDHS sites and hiPSC dDHS sites (p-value < e-100). The enrichment of the AP-1 motifs and binding sites in memory dDHS suggests that AP-1 may contribute to the
2.3.7 Clusters of differential DNase Hypersensitive sites are connected to loci encoding key
developmental transcription factors
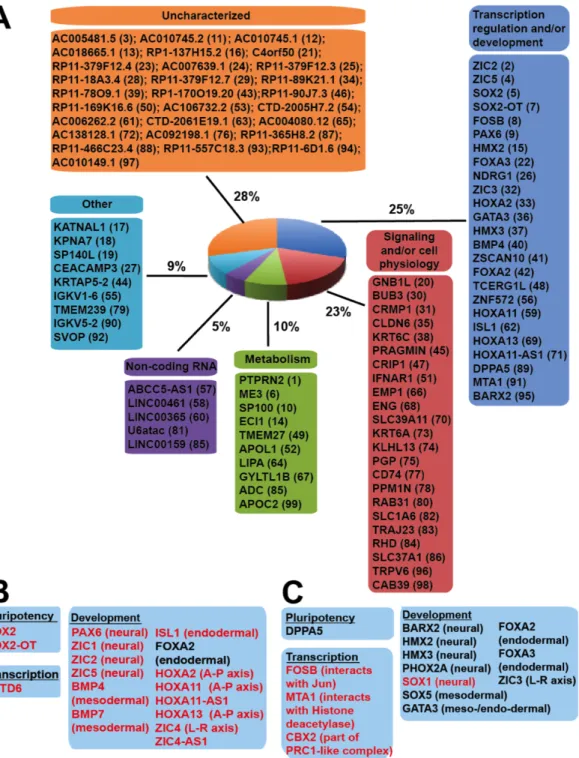
We sought to identify genes that were connected to more dDHS sites than expected and thus were potentially differentially regulated in hESCs and hiPSCs. For each gene we counted the number of connected DHS and dDHS sites. To determine enrichment of dDHS connections compared to the background frequency, we calculated FDR-adjusted p-values using the exact binomial test (see Methods). All genes were ranked by their FDR-adjusted p-values, and smaller p-values indicate greater enrichment of dDHS sites connected to a gene. The top 100 ranked genes based on these p-values are listed in Figure 2.5A (see Table S3 for the complete list).
We manually grouped the top 100 genes that were enriched for dDHS site connections into six general categories based on GO term annotations (see Methods, Figure 2.5A). The most prominent feature of this list was 25 genes that were transcription factors and other key
regulators of early embryonic development. This includes SOX2, one of the four reprogramming factors that is also critical in early neural differentiation, and PAX6, a master transcription factor that is important for the development of the eye, nose, central nervous system and pancreas. Additional developmental genes represented in the top 100 that were enriched for dDHS sites were HOXA, ZIC, FOXA and HMX gene family members (Supplemental Figure 2.6,
Supplemental Figure 2.7).
2.3.8 hESC and hiPSC dDHS sites are connected to distinct sets of key developmental genes
Each of the top 100 connected genes appeared to be enriched for either hESC dDHS sites or hiPSC dDHS sites but not both (Fig. 5B-C). For example, of the 9 dDHS sites mapped in the ~110 kb HOXA gene locus, all were comprised of only hESC dDHS sites. Similar enrichment for hESC dDHS was found at SOX2, ZIC2 and ZIC5 (Fig. 5B), while SOX1, SOX5 and ZIC3
above on hESC, hiPSC, and memory dDHS sites separately. We found 78 genes enriched for hESC dDHS sites, 193 genes enriched for hiPSC dDHS sites, and 344 genes enriched for dDHS memory sites (FDR-adjusted p < 0.05) (see Table S4 for the complete list). Only 2 genes were held in common between the hESC and hiPSC enriched gene sets, indicating that each class of dDHS generally associates with a distinct set of genes. Similarly, hESC dCOREs and hiPSC dCOREs were connected to different sets of developmental genes (Fig. S3C-F; see Table S5 for the complete list), including several of the genes enriched for hESC dDHS and hiPSC dDHS sites (Fig. 5B-C, highlighted in red). Consistent with this, each class of dDHS site were functionally distinct (Table S6). hESC dDHS-associated genes were strongly enriched for GO categories related to development. In contrast, genes enriched for hiPSC and memory dDHS sites were not significantly associated with specific GO terms. Thus, DNase sites that are open in ESCs but not iPSCs tend to be connected to genes with developmental functions, while DNase sites that are open only iPSCs but not ESCs are not functionally coherent.
2.3.9 Genes highly connected to dDHS sites are differentially regulated upon differentiation
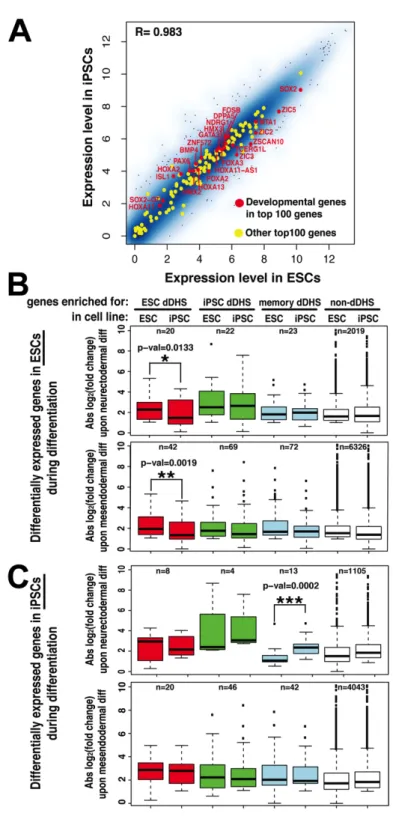
Previous studies have shown that RNA transcript levels in hESCs and hiPSCs are very similar [41,88]. We also found that overall transcript abundance in hESCs and hiPSCs was highly concordant based on our exon array data (R = 0.98, Pearson correlation). In addition, all 494 genes that were highly connected to any type of dDHS site had less than two-fold
Figure 2.6. Incomplete chromatin reconfiguration may foreshadow altered gene regulation
upon differentiation. A) Global expression is highly similar between hiPSC and hESC lines
(n=20), these genes displayed significantly lower fold changes in gene expression during hiPSC differentiation compared to hESC differentiation (red box plots, p-values indicated).
Differentially expressed genes around hiPSC dDHS (green boxes), memory dDHS (blue boxes), or non-dDHS sites (white boxes) do not display differences in fold expression changes. C) Comparison similar as (B) but based on genes that are differentially expressed during hiPSCs differentiation into neuroectoderm (top) and mesendoderm (bottom). Genes enriched for hiPSC dDHS (green boxes) and memory dDHS (blue boxes) were improperly regulated in hiPSCs during neurectodermal differentiation, but not mesendodermal differentiation. (See also Figure S6, Figure S7)
To test whether genes connected to hESC dDHS (sites only open in ESCs) were differentially regulated during hiPSCs differentiation, we compared the fold change in RNA levels of these genes during mesendodermal and neurectodermal differentiation between hESCs and hiPSCs (Figure 2.6B). We found that genes enriched for hESC dDHS (sites open only in hESCs not hiPSCs) had significantly lower fold-changes in hiPSCs compared to hESCs during both neurectodermal (p-value 0.0133) and mesendodermal (p-value 0.0019) differentiation (red bars, Figure 2.6B and examples in Supplemental Figure 2.7A). Genes connected to hiPSC dDHS sites, memory dDHS sites, and those not significantly connected to dDHS sites had similar changes in RNA abundance in hiPSCs and hESCs.
Conversely, we tested whether genes connected to hiPSC dDHS sites (sites open only in hiPSCs) would be upregulated during differentiation of hiPSCs (Figure 2.6C). We identified 1,130 and 4,151 differentially expressed genes upon neurectodermal or mesendodermal
small numbers per group, as predicted by our hypothesis, genes enriched for hiPSC dDHS sites and memory dDHS sites displayed a greater fold change in expression during neurectodermal differentiation in hiPSCs compared to hESCs (Figure 2.6C, green and blue bars and examples
in Supplemental Figure 2.7B). In contrast, genes associated with hESC dDHS sites and genes
without dDHS enrichment showed similar changes in transcription levels in hiPSCs and hESCs. Interestingly, during mesendodermal differentiation, transcript level changes were similar in hESCs and hiPSCs for all groups of genes, including those enriched for hiPSC dDHS or memory dDHS sites (Figure 2.6C, bottom). This suggests that hiPSC dDHS sites may influence
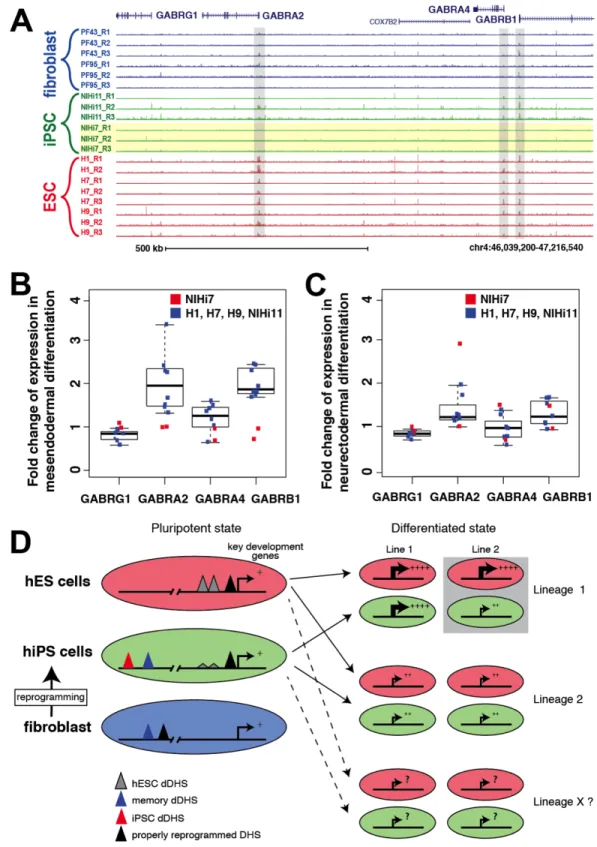
Figure 2.7. Incompletely reprogrammed DHS sites around GABR locus foreshadows
altered expression after in vitro differentiation. A) Locus on chromosome 4
showing that these genesare not upregulated in NIHi7 (red box) after mesendodermal
differentiation. Other pluripotent cell lines differentiated into mesendodermal lineage express higher levels of these genes. C) Expression data showing no change in expression for these genes in any hiPSC or hESC after differentiation towards neuroectoderm. D) Schematic diagram depicting hESC dDHS sites (gray triangles) having a functional impact in individual hiPSC lines on gene expression of key developmental genes only after differentiation. While this diagram indicates a deficiency in a single cell lineage (gray box), analysis of additional cell lineages (dotted line) will be needed to understand the full impact of dDHS sites.
In addition to differentiation lineage-specific differences between hiPSCs and hESCs, we also detected lineage-specific differences between the two hiPSC lines. For example, differential chromatin accessibility was observed in only one of the hiPSC lines (NIHi7) surrounding the
GABR locus. DHS sites were present at the TSSs of GABRA2, GABRA4, and GABRB1 in all hESC lines and hiPSC line NIHi11, but were missing in hiPSC line NIHi7 (Figure 2.7A). During mesendodermal differentiation, the expression of these three genes were up-regulated in the hESC cells lines and NIHi11, but was not changed in NIHi7 (Figure 2.7B). In contrast, during neurectodermal differentiation these genes exhibited no change in expression for any of the cell lines (Figure 2.7C). Thus, genes lacking appropriate DHS sites in specific hiPSC lines exhibit altered gene regulation that are only detected upon differentiation into certain lineages. This supports our hypothesis that a lack of DHS sites at a given locus in all or a subset of individual hiPSCs can foreshadow improper gene regulation during in vitro differentiation
(Figure 2.7D).
2.4 DISCUSSION
Here we report a genome-wide comparison of chromatin accessibility between human ESCs, fibroblasts, and iPSCs derived from these fibroblasts. While DHS sites of reprogrammed hiPSCs are remarkably similar to hESCs, approximately 4% of DHS sites exhibited differential accessibility. These dDHS sites are associated with genes that include key developmental factors. Despite the high transcriptional concordance in undifferentiated cells, we observed that some of these dDHS-enriched developmental genes were inappropriately regulated during differentiation (see Figure 2.7D). Our data are consistent with the hypothesis that chromatin landscape required for gene regulation in somatic lineages pre-exists in undifferentiated pluripotent stem cells [183].
In human iPSC studies, especially those for their potential usage in regenerative
medicine, it is critical to screen for and use fully reprogrammed iPSC clones. However, typically only a small fraction (less than 1%) [184] of transfected cells turn into fully reprogrammed iPSC clones. To date, immunohistochemistry, transcription profiling, and DNA methylation assays at promoters of key pluripotent markers are routinely used for primary validation and
characterization of iPSC lines. Our study shows that the different chromatin architecture in iPSCs may have little impact on gene transcription at pluripotent states but can significantly influence the regulation of gene transcription including some key developmental factors upon differentiation. We do not expect that every hiPSC and/or hESC line will have the exact same set of “signature” dDHS sites. Instead, each pluripotent line will likely have its own set of chromatin differences that share characteristics similar to the ones described here. Therefore, evaluation of open chromatin configurations may be useful for identification of iPSCs with specific
2.4.1 Differential DNase sites occur in clusters, an arrangement of regulatory elements seen
at key lineage-specific genes across cell types
We found 9% and 6% of hESC and hiPSC dDHS sites, respectively, in clusters
(“dCOREs”) that span tens of kilobases. Similar observations of clustered regulatory elements have been reported in pancreatic islets [27]. More recently, blocks of active regulatory element super-enhancers that were typically >10kb in length were described in mouse and human ESCs, as well as in 86 diverse human cell types [176-178]. Approximately 10% of ESC dCOREs overlapped with super-enhancers identified in H1 hESCs. Therefore dCOREs likely represent a regulatory paradigm that exists across different cell types and is specifically associated with genes that control and define cell identity. The presence of dCOREs suggests that
reprogramming of chromatin architecture at individual elements within these clusters may occur in a coordinated fashion. In addition, given the cell type-specific nature of super-enhancers, we speculate that the dCOREs in different hiPSC lines may vary depending on their cell types of origin. Future studies that characterize dDHSs and dCOREs between iPSC lines generated from different cell types can facilitate the understanding of the process and mechanism of chromatin reprogramming and potentially help improve the reprogramming efficiency and fidelity.
2.4.2 Complete chromatin reconfiguration at a given locus varies according to the local
chromatin environment.
the first 48 hours of induction of the Yamanaka reprogramming factors OCT3/4, SOX2, KLF4 and c-MYC (OSKM), O, S, and K act as pioneer transcription factors and bind to DNase1 resistant distal elements that lack covalent histone modifications [179]. These distal elements subsequently gain the H3K4me2 mark during reprogramming as the somatic enhancer signature is transformed into the ESC signature [186]. These events precede promoter activation and large-scale transcriptional changes that ultimately delineate somatic cells from iPSCs.
It is therefore important to identify and characterize determinants of differential DHS accessibility between iPSC and ESC to truly understand the nature of reprogramming, the characteristics of iPSCs, and to ultimately improve the efficiency and fidelity of in vitro
reprogramming. We showed that the complete reconfiguration of chromatin structure might depend on the local chromatin environment of the starting cell population. This supports reports showing that chromatin modifying enzymes or drugs improve the efficiency of iPSC induction. For instance, addition of the chromatin-associated transcriptional repressor UTF1 to
conventional Yamanaka factors (OCT3/4, SOX2, KLF4 and C-MYC) significantly improved the formation of iPSC clones [187]. In addition, either treatment with inhibitors of DNA
methyltransferase (DNMT), or knocking down the MBD3 subunit of the NuRD repressor complex increased reprogramming efficiency [172,174]. It is possible that optimizing
2.4.3 Chromatin that does not properly open or that remains improperly closed in iPSCs
harbors features inherently resistant to reprogramming
Both hESC dDHS sites and memory dDHS sites are regions at which the chromatin accessibility in hiPSC lines mimicked their progenitor lines and differed compared to hESC lines. It is possible that those genomic domains are generally more resistant to chromatin reconfiguration during reprogramming. It is not clear whether these refractory sites contribute to the low efficiency of iPSC generation in particular, or whether these loci are also problematic in other somatic reprogramming approaches.
Regions that are refractory to pioneer reprogramming factor binding have also been identified [179]. These megabase-sized regions are enriched for H3K9me3 and termed OSKM-Differentially Bound Regions (OSKM-DBRs). In the small proportion of somatic cells that reprogram following OSKM induction these OSKM-DBRs become accessible. Our study showed that genomic regions not reprogrammed to match the DHS profiles in hESC were enriched for repressive H3K9me3 and EZH2 in somatic skin fibroblasts. Therefore, a subset of dCOREs identified by DNaseI hypersensitivity may reflect OSKM-DBRs.
Genetic differences between the hESC and hiPSC lines we analyzed might also
contribute to the differences in chromatin accessibility between these samples. Recent analysis of DHS in 70 lymphoblastoid cell lines has revealed DNase I sensitivity quantitative trait loci (dsQTLs) [188]. The stringent criteria we used to identify dDHS makes it likely that very few of the dDHS regions identified in this study are due to dsQTLs. Future studies using iPS cells from larger numbers of individuals will be important to distinguish the precise contribution of dsQTLs and their impact on reprogramming potential.
2.4.4 Imcompletely reprogrammed sites may become functionally relevant only upon
differentiation of iPS cells.
Pluripotent stem cells are revealing new insights into the chromatin regulatory mechanisms that control development. DHS sites that define the landscape of differentiated cells are remarkably well represented even before the initiation of differentiation. A recent study that produced DHS maps from ESCs and 48 definitive somatic cell types concluded that definitive cell types share on average 37% of the DHS sites found in undifferentiated ESCs [183]. Therefore, during development, the majority of ESC DHS sites are lost, and smaller numbers of lineage-restricted DHS sites are activated de novo.
In this study we examined a limited number of hESCs and hiPSCs cell lines and found that ~4% of the DHS sites showed differential accessibility between the two cell types. Despite these chromatin differences, transcript levels between hESCs and hiPSCs were almost