Adhesion measurements methods
Laurence Podgorski, Véronique Georges, Nicolas Condomines, Jean-Denis Lanvin
CTBA Technical Centre for Wood and Furniture
Allée de Boutaut BP 227, F-33028 Bordeaux Cedex, France e-mail : [email protected]
Although it makes a considerable contribution to the overall performances of coatings, the wood-coating interface is still not widely known and is difficult to study. It is especially difficult to investigate adhesion phenomena because measuring the adhesion of a coating is generally achieved using an empirical and qualitative test namely the cross-cut test as described in EN ISO 2409. EN927-3 and prEN927-6 also refer to this test to characterize the adhesion of coatings after a natural weathering test and artificial weathering test respectively. However EN ISO 2409 (1992) specifies that the cross-cut test is a test method for assessing the resistance of paint coatings to separation from substrates when a right-angle lattice pattern is cut into the coating penetrating through to the substrate, but is not to be regarded as a means of measuring adhesion. This standard also specifies that where a measurement of adhesion is required, the Pull-off test method described in EN ISO 4624 has to be used.
The aim of this paper is thus to compare several methods used to characterize adhesion and to study the influence of different parameters on the results.
Adhesion measurements as described in EN ISO 2409: Cross-cut test
In this method a right angle lattice pattern is cut into the coating penetrating through to the substrate using a specific cutting tool. The cuts are made at 45° to the direction of the grain. A transparent pressure-sensitive tape is then placed over the lattice and is rubbed with a fingertip to ensure good contact. The tape is removed by pulling it off steadily at an angle as close as possible to 60°. The cut area of the test coating is examined and is classified from 0 (good adhesion) to 5 (bad adhesion) by a visual comparison with the illustrations in the standard, depending on the amount of flaked coating. Although this test seems to be easy and fast, many parameters may have an influence on the results, for example:
-pressure applied on the cutting tool when making the lattice -pressure applied on the adhesive tape
-angle between the lattice and the wood grain -peeling angle during the test
-pull-off speed
To investigate the influence of these parameters on the results, two operators have made the test using the same samples. Operator 1 was a technician with a long experience in wood coatings and adhesion test according to this standard. Operator 2 had no experience in both fields. Twenty four samples were tested by these two operators, including three wood species (oak, scots pine, moabi), two stains (waterborne and solventborne), two paints (waterborne, solventborne). To ensure a more reproducible contact between the tape and the coating than the one obtained with a fingertip, the tape has been rubbed with a mass of 2Kg.
Results are presented in Figure 1 where each result come from three adhesion tests.
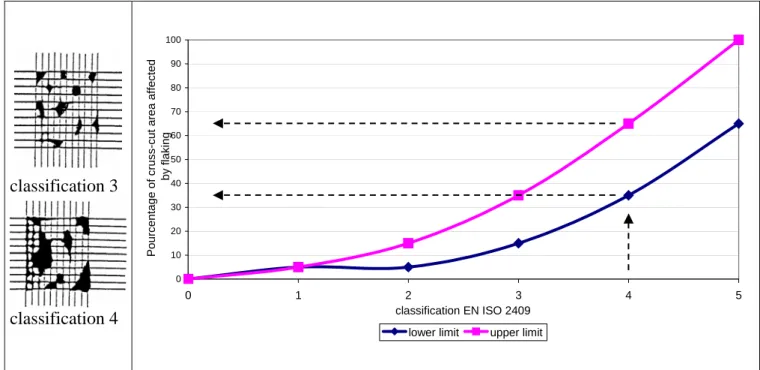
Figure 1 shows that there is no influence of the operator on the results, even if the test are made by a non experienced person. This is due to the important interval between the lower limit and the upper limit of each classification score, especially for classification 3 and 4, as shown in Figure 2. The interval is too big to qualify the adhesion with accuracy.
0 1 2 3 4 5 1 2 3 4 5 6 7 8 9 10 11 12 13 14 15 16 17 18 19 20 21 22 23 24 test N° Cl assi fi cati o n E N I S O 2409 Operator 1 Operator 2
Figure 1: Influence of the operator in adhesion test according to EN ISO 2409
classification 3
classification 4
0 10 20 30 40 50 60 70 80 90 100 0 1 2 3 4 5 classification EN ISO 2409 Pour centage of cr uss-cut ar ea affected by flak inglower limit upper limit
Figure 2 : Variation of the lower and upper limits of each classification code in EN ISO 2409
Amongst the parameters that may influence the results, the peeling angle and the pull-off speed are of great importance.
Figure 3: Peeling test with a peeling angle θ
Concepts of fracture mechanics and energy balance lead to the calculation of the free energy release rate G corresponding to the fracture energy of the assembly. Under the assumption that the flexible part (here the tape) keeps its shape during the test, the energy required to separate the tape from the coated wood is :
G = (F/b) (1-Cos θ)
The influence of the peeling angle on the peeling load is represented in Figure 4.
Figure 4 : Influence of the peeling angle on the peeling load
uring the peeling test it is impossible to keep constant the peeling angle and to keep it as close as
mal load The intensity of the load is low and the repeatability is good since the
0 0,2 0,4 0,6 0,8 1 1,2 1,4 1,6 1,8 2 45 50 55 60 65 70 75 80 85 90 95 100 105 110 115 120 125 130 135 140 145 150 155 160 165 170 175 180
Peeling angle (theta in degree)
1-co
s(th
eta)
a peeling angle of 120° corresponds to the angle of 60° described in EN ISO 2409 for the tape removal
D
possible to 120° as specified in EN ISO 2409. The experience shows that the peeling angle varies from 120° at the beginning of the test to 90° at the end. Therefore the peeling load may have a variation of 50% during the test which can affect the quantity of coating removed by the tape.
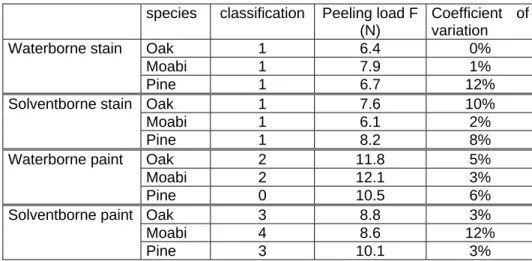
In order to improve this qualitative test, a dynamometer has been used to measure the maxi necessary to remove the tape.
Results are shown in Table 1.
coefficient of variation is low. The advantage of coupling a dynamometer is to give a quantitative measurement to the cross-cut test. The analysis of some curves F= f(t) with an acquisition software has shown that the peeling speed is about 2500mm/s i.e. 2.5m/s. This is very high compared with the traditional tensile test machines which generally operate up to 200mm/s. One main aim of this study
species classification Peeling load F Coefficient of (N) variation Oak 1 6.4 0% Moabi 1 7.9 1% Waterborne stain Pine 1 6.7 12% Oak 1 7.6 10% Moabi 1 6.1 2% Solventborne stain Pine 1 8.2 8% Oak 2 11.8 5% Moabi 2 12.1 3% Waterborne paint Pine 0 10.5 6% Oak 3 8.8 3% Moabi 4 8.6 12% Solventborne paint Pine 3 10.1 3% Table 1 : Maximal peeling load compared with EN ISO 2409 classi
dhesion measurements as described in EN ISO 24624: Pull-off test
he minimum
n the samples used before for EN ISO 2409 (cross cut test), nine pull-off tests have been performed. fication
A
This standard specifies a method for assessing the adhesion of a coating by measuring t
tensile stress necessary to detach the coating in a direction perpendicular to the substrate as shown in Figure 5. The PosiTest pull-off adhesion tester wich operates according to this standard has been used. It measures the force required to pull a specific diameter of coating away from its substrate using hydraulic pressure. The method involved bonding dollies (diameter 20mm) to the test piece with an Araldite® adhesive. After the adhesive is cured the test area of the coating is separated from the area surrounding the dolly by cutting with a specific tool. The hydraulic pump allows a pumping until the dolly is pulled from the coating as represented in Figure 6. A pressure gauge gives directly the pull-off strength in MPa. The ideal situation is when the rupture is observed at the interface between wood and coating. But sometimes only a portion of coating is removed and a visual analysis of the fracture pattern is recommended.
O
Table 2 compares the mean value and the coefficient of variation (CV) calculated with all results, and the one calculated after excluding extreme values and test with too much wood removed (cohesive failure of the substrate).
igure 5: Pull off test according to F
EN ISO 24624
Figure 6: Example of the system used to pull off the dolly in the PosiTest equipment
All values Without extreme values Coating
(2 coats)
Wood species Mean Pull-off strength (MPA) CV (%) Mean Pull-off strength (MPA) CV (%) Oak 5.7 16 5.8 6 Moabi 5.5 14 5.5 8 Waterborne stain Pine 5.2 18 5.2 11 Oak 5.7 13 5.8 8 Moabi 5.7 12 5.7 6 Solventborne stain Pine 3.9 9 4.0 4 Oak 4.0 12 3.9 11 Moabi 4.2 7 4.3 6 Waterborne paint Pine 2.9 22 2.8 18 Oak 3.2 15 3.2 6 Moabi 4.0 13 3.9 8 Solventborne paint Pine 2.9 20 2.8 16
Table 2: Results of pull-off test according to EN ISO 24624
Table 2 shows that the PosiTest method is a quantitative and reliable method because taking the deviant values into account does not affect the final result.
Comparison between the cross-cut test (EN ISO 2409) and the pull-off test (EN
ISO 24624)
A set of control samples have been used for this comparison as well as a set of samples that have been artificially weathered (6 weeks on a degradation wheel).
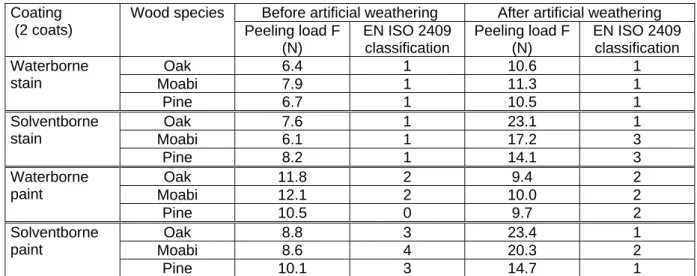
Table 3 presents the results obtained with the cross-cut test and the peeling load measured with the dynamometer, before and after artificial weathering. Table 4 shows the results obtained with the pull-off test before and after artificial weathering. Before artificial weathering EN ISO 2409 in Table 3 shows a good adhesion for the stains and a rather bad adhesion for the paint. This is probably explained by the viscosity of the tested products. The solid contents were 40%, 30%, 54% and 70% for the waterborne stain, the solventborne stain, the waterborne paint and the solventborne paint respectively. In the case of a polymer with a high viscosity the interfacial contact is low and some cavity may be created due to some trapped air at the interface as shown in Figure 7.
Figure 7: Influence of the viscosity on the contact surface
After weathering, the solventborne paint shows a better adhesion probably due to the post-curing effect during the weathering.
For all coatings the peeling load has changed due to the weathering. Except for the waterborne paint, the weathering leads to an increase in the peeling load. The dynamometer method detects changes for all coatings as opposed to the classification of the standard which does not detect any changes for the waterborne stain for example.
Table 4 shows that the PositTest method gives results in agreement with those obtained with EN ISO 2409 : when the pull-off strength decreases the classification score increases (see solventborne stain on moabi and pine), and when the pull-off strength increases the classification score decreases.
Before artificial weathering After artificial weathering Coating (2 coats) Wood species Peeling load F (N) EN ISO 2409 classification Peeling load F (N) EN ISO 2409 classification Oak 6.4 1 10.6 1 Moabi 7.9 1 11.3 1 Waterborne stain Pine 6.7 1 10.5 1 Oak 7.6 1 23.1 1 Moabi 6.1 1 17.2 3 Solventborne stain Pine 8.2 1 14.1 3 Oak 11.8 2 9.4 2 Moabi 12.1 2 10.0 2 Waterborne paint Pine 10.5 0 9.7 2 Oak 8.8 3 23.4 1 Moabi 8.6 4 20.3 2 Solventborne paint Pine 10.1 3 14.7 1
Table 3: Comparison between the cross-cut test and the peeling load before and after weathering Mean Pull-off strength (Mpa)
Coating (2 coats)
Wood species Before weathering After weathering Oak 5.9 5.6 Moabi 5.8 5.8 Waterborne stain Pine 5.6 3.5 Oak 5.8 5.9 Moabi 5.7 4.8 Solventborne stain Pine 4.0 3.7 Oak 4.3 5.2 Moabi 3.9 5.2 Waterborne paint Pine 2.9 2.9 Oak 4.0 4.5 Moabi 3.3 5.5 Solventborne paint Pine 2.6 3.9 Table 4: Pull-off strength and nature of failure before and after weathering
Conclusions
The aim was to compare several methods to characterize the adhesion of coatings on wood. EN ISO 2409 (cross-cut test) and EN ISO 24624 (Pull-off test) have been investigated. Furthermore the peeling test described in EN ISO 2409 has been improved using a dynamometer to quantify the maximal load necessary to remove the tape.
The cross-cut test can be seen as a rudimentary and empirical test. This qualitative method is still useful. The classification score is the same whatever the operator, because for each score the scale is so large that it includes all possible source of errors encountered during the test. Coupling the removal of the tape with a dynamometer could be an improvement of the method to control the peeling load and have a quantitative measurement. However a system to keep the peeling angle constant during the test would be necessary to limit the variability in the results. Further experiments should be carried out to find a correspondence between the peeling load and the percentage of cross-cut area affected by flaking. An image analysis system would be useful to better quantify this area. This could allow the creation of intermediate classification score and would give a more accurate test.
The Pull-off test method is a quantitative method. The pull-off strength is directly known. This method gives results in agreement with those obtained with the cross-cut test. Therefore the two standards are complementary and should be used in parallel to gain more information and knowledge about the coating adhesion and the wood-coating interface.
Acknowledgments
The financial support of the Agence de l’Environnement et de la Maîtrise de l’Energie (ADEME) is gratefully acknowledged. Special thanks to Daniel Mercier (CTBA) for cross-cut tests.