Improved Seismic Response of RC Frame Structures by Using Fluid
Viscous Dampers
Qasim Shaukat Khan*, Asad Ullah Qasi
1, and Muhammad Ilyas
*Civil Engineering Department, University of Engineering and Technology, Lahore, [email protected]
Abstract
In modern era passive control devices are used to improve the seismic response of structures during large magnitude earthquakes. In this research an analytical study is carried out on commercial FEM program SAP 2000 by modeling five, seven and nine storey RC frame structures. Response to four earthquake ground motions on modeled frame structures is studied and is effectively controlled by varying the characteristic properties of Fluid viscous dampers (FVD). Response in terms of frequency, displacement, velocity, acceleration, storey drift, base shear and energy dissipation is studied. Quantitatively in the modeled frames damage in terms of percentage change in global stiffness and natural frequency is determined. Qualitatively damage in terms of performance levels as per ATC-40 and FEMA-440 is considered. With an increase in Additional Stiffness Ratio of FVD corresponding increase in natural frequency and reduction in dynamic response is observed. FVDs significantly improve structural performance level of frames from Completely Damage to Immediate Occupancy/Operational Level during large magnitude earthquakes.
Key Words
: Fluid Viscous Dampers (FVD); Additional Stiffness Ratio (ASR); Structural Performance; Effectiveness of FVD1. Introduction
In recent years, an effort is being made to develop and improve the structural control devices to reduce seismic impact in buildings and bridges. Full scale implementation of active control systems is difficult as it is expensive and less reliable. Passive supplemental damping systems such as base isolation, viscoelastic dampers and tuned mass dampers are widely used in structures to reduce the dynamic response. Semi-active damping systems i.e. variable-orifice fluid dampers, controllable friction devices, variable-stiffness devices, smart tuned mass dampers and tuned liquid dampers, are more effective in mitigating dynamic response than active and passive damping systems [1].
During an earthquake, seismic energy is input into the structure which results in increased vibrational response. Mechanical devices e.g. dampers are provided throughout the height of structure to increase the damping hence reduce the response either by absorbing or dissipating energy [2]. These mechanisms include sliding friction, movement of piston within a viscous fluid or
deformation of viscous elastic materials. Friction dampers dissipate specifically kinetic energy through sliding of plate/surfaces. It can be equivalent to 30% critical damping ratio. Viscoelastic dampers use shear deformation of viscoelastic material to suppress vibrations. Equivalent damping varies from 1 to 17%. Yielding metallic dampers use the hysteretic properties of metals i.e. mild steel, lead, nickel and titanium to dissipate strain energy. They increase the strength and stiffness of the structure. FVDs are based on principle of flow of fluid through orifices to dissipate strain energy in the form of heat by convection and conduction [3, 4].
Variable orifice dampers operate by controlling the resistance to flow in a hydraulic damper. This concept was first proposed in bridges by Feng and Shinozuka (1990). Studied analytically and experimentally by number of researchers e.g. Kawashima and Unjoh (1994) [5], Sack and Patten (1993) [6], Patten et al. (1996) [7], Symans and Constantinou (1999) [8], Nagarajaiah (1994) [9]. Numerous examples of structures using hydraulic variable orifice dampers are 11 storeys Kyobashi center, 21 storeys Daiichi Hotel Ohita Oasis Tower, 5
storeys Kajima Shizuoka Building, 9 storeys Keio University Engineering Building [1].
Structural damage is categorized as local and global. Global damage detection techniques are based on variation in dynamics of structures such as stiffness, mass, damping and vibration modes [10]. Vibration based methods incorporate modal parameters as indicators of damage detection. Structural damage results in a reduction in structure stiffness and in the modal parameters of building structures [11]. Approximately 5% change in natural frequency is considered essential for damage detection [12].
To improve seismic response FVD is provided as a diagonal brace. Analytical and experimental studies have shown that FVD has an advantage over other dampers as it substantially increases the damping within the structure. It also provides additional stiffness which significantly improves the strength and energy dissipation capacity during strong winds and moderate earthquakes. In mathematical modeling of FVD, energy dissipation capacity depends upon its damping coefficient & non-linearity is defined by the damping exponent[13]
Xu and Chen (2007) [11, 14] also studied the performance of friction dampers by varying stiffness ratios in bare frame structures. To control the response of RC frames, FVDs are studied here by changing the stiffness ratios in low to medium rise RC frames. Five, seven and nine storey frames with time period 0.49, 0.64 and 0.79 seconds respectively are modeled by using commercial software SAP 2000 version 14.4 [15]. Hence these modeled frames lie in intermediate period range, a velocity sensitive region of the response spectrum and damping effect is more pronounced in intermediate period systems [15].
Beams and columns of a structure contribute towards damping characteristics, inertial mass and elastic stiffness of structures. The effective lateral storey stiffness of frame structure is computed by considering beam stiffness as intermediate between rigid and flexible and is determined by considering stiffness of columns in a storey (K1, K2 ) as , given in Eq. 1. [16].
3 c
c 2
1 Storey
h 7
EI 96 K K
K (1)
The effective lateral structural stiffness of modeled frames is computed using Eq. 2, considering the stiffness of columns (Kstorey) of one storey in series with the columns of other stories [16].
N . ST 3
. ST 2 . ST 1 . ST
Bldg K
1 ... K
1 K
1 K
1 K
1
(2)
FVDs add stiffness and damping to the structure resulting in reduction in peak response and decrease base shear force. In the modeled frames a mechanical device i.e. FVD is modeled throughout the height of the frame structure [17].
2.
Mathematical Equation for Fluid ViscousDamper (FVD)
Energy dissipated per cycle by Linear/Non-Linear FVD is a function of different parameters i.e. Damping Coefficient (Cd), velocity of piston (V) and Damping exponent (α) [2, 3, 17], as given in Eq.3.
) V sgn( V C
F d (3)
Previous research has shown that FVDs having damping exponent 0.5 dissipates 31% more strain energy than FVDs with exponent 2.0 resulting in reduced dynamic response and improved structural behavior. It is recommended in structures which are subjected to large magnitude velocity shocks [3]. Energy dissipated by Non-Linear FVD is more than that of Linear FVD and increases as velocity exponent decreases. To determine the damage degree in modeled frames pushover analysis is carried out. It gives lateral load capacity and failure mechanism of structure. Performance of modeled frames is defined in terms of performance levels as given in FEMA-440 and is summarized in table 1 [18].
3. Illustrative Model Frames
Three single bay concrete frame structures
of five, seven and nine storey are modeled on
computer software SAP 2000 version 14.4.
Bay width of modeled frames (7.30m) is kept
twice of the storey height (3.65m). Beam and
column dimensions (610mm x 610mm) are
same but reinforcement ratio is kept different
in beams and columns. Further strong column
weak beam mechanism is considered
in design. Storey mass is concentrated at the floor level [16]. Modeled frame structures with and without FVDs areTable 1: Structural performance Indicator (FEMA-440)
Operational Level
Very limited damage to non-structural components, no safety hazard for occupants.
Immediate Occupancy
Non-structural components are damaged. Slight disruptions to the building occupants.
Life Safety Minor damage is done to
structural components. No possibility of falling or tipping of non-structural components. Possibility of secondary hazards due to fire and release of injurious chemicals exist.
Collapse Prevention
Structure undergoes major damage and safety of occupants is at risk but no possibility of complete failure.
Collapsed Level
Structure undergoes significant damage and high possibilities of injuries to inhabitants exist due to destruction of non-structural components.
Damaged Level
Strength and stiffness of structure is reduced. Possibility of life hazards to inhabitants is high. Completely
Damaged Level
Load bearing elements of building are damaged. No margin of safety in aftershocks and highest possibilities of life threat to the occupants.
subjected to North-South component of El-Centro (1940) 0.313g, Kobe (1995) 0.821g, Northridge (1994) 0.42g and Tabas (1978) 0.34g earthquakes, downloaded from PEER Strong motion database [19]. Variation in seismic response in terms of displacement, velocity, acceleration, frequency, storey drift and base shear is determined. Reduction in global structure stiffness and frequency after an earthquake is considered as damage indicators in frame structures. Material properties of Concrete considered are compressive strength (fc’) 27.5MPa, modulus of elasticity (E) 34474MPa, Poisson’s ratio (µ) 0.2 and weight per unit volume 23.5 KN/m3. Gravity loadings include self-weight of 150mm thick slab (360-kg/m2), immovable partition load (200-kg/m2), floor finish (300 kg/m2) and live load (250 kg /m2). Total mass assigned to each joint is (26.81 KN-sec2/m).
Link support properties of FVD are self-mass (0.1751 KN sec2/ m), effective stiffness (0.2 to 1.2 times the initial stiffness of frame structures) and damping coefficient. Initial elastic stiffness of modeled frame structures is determined from non-linear static analysis (Pushover Curve) and damping coefficient is determined from Eq.4. Damping coefficient is a function of structure mass, stiffness and damping ratio. In this research damping ratio is taken as 5% of the critical value and mass of frame structure is computed by using total gravity dead loads.
Mass * K Stiffness 2
. Coeff .
Damp i (4)
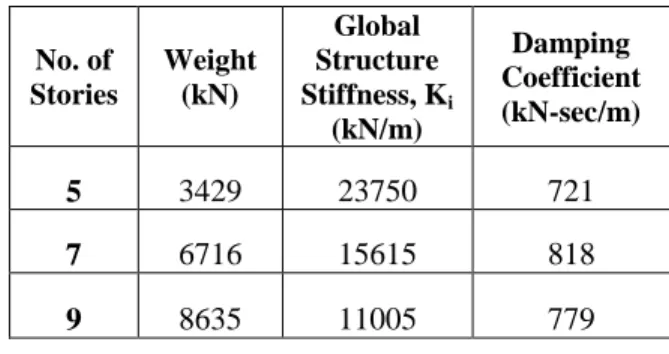
Table 2: Weight, Global Structure Stiffness and
Damping coefficients of five, seven and nine story frames obtained from Pushover Analysis
Initial slope of the pushover curve is used as actual stiffness of the frame. Additional Stiffness is provided by FVDs. Additional Stiffness Ratio (ASR) is defined here as ratio of the stiffness provided by FVD to actual global stiffness of the structure and is summarized in-Table 2. [6] Total Structure stiffness is taken as sum of actual structure stiffness and FVD stiffness.
Table 3: Summary of increase in global structure stiffness due to ASRs for five, seven and nine storey modeled frames.
Additional Stiffness Ratio (ASR)
Structure Stiffness kN/m
5-Storey 7-Storey 9-Storey
0.2 4750 3123 2201
0.4 9500 6246 4402
0.6 14250 9369 6603
0.8 19000 12492 8804
1.0 23750 15615 11005
1.2 28500 18738 13206
No. of Stories
Weight (kN)
Global Structure
Stiffness, Ki
(kN/m)
Damping Coefficient (kN-sec/m)
5 3429 23750 721
7 6716 15615 818
4. Results and Discussion
Non-Linear static and dynamic analysis is carried out to determine the structural response of modeled frames with and without FVDs. A percentage increase in natural frequency with FVD is defined as ratio of difference of frequency with and without ASR to frequency without ASR.
100 ASR
wit hout .
Freq
ASR wit hout .
Freq ASR wit h . Freq
f
(5)
Increase in natural frequency for five, seven and nine storey frame is shown in Fig. 2. The effective lateral stiffness of modeled frames increases with increase in ASR. Hence, with an increase in structural stiffness its natural frequency increases. The effect is more pronounced in five storey frame than in seven and nine storey frames as the effective structural lateral stiffness is inversely proportional to number of stories, Eq. 2.
0 2 4 6 8 10 12 14
0 0.2 0.4 0.6 0.8 1.0 1.2
R
el
a
ti
v
e
incr
ea
se
in
ith
na
tura
l
fr
equency
(%
)
Additional Stiffness Ratio (ASR) 5-Storey 7-Storey 9-Storey
Fig.2: Relative increase in natural frequency versus (ASR) of FVDs
Effectiveness of FVDs is defined as the ratio of percentage difference between vibrational response without and with FVD to vibrational response without FVD.
100 FVD wit hout sponse
Re
FVD wit h sponse Re
FVD wit hout sponse Re FVD ess
Effect iven
Effectiveness of FVD in frames is determined by using Eq.6 and is shown in Fig.3. Displacement, velocity and acceleration response has reduced with addition of FVDs. It is noticeable that with an increase in ASR effectiveness of FVD increases. Effectiveness of FVD for five-storey (28%) frame
0 5 10 15 20 25 30
0 0.2 0.4 0.6 0.8 1 1.2
Effecti
v
enes
s
o
f F
V
D
( %
)
Additional Stiffness Ratio (ASR)
Displacement Response
5-Storey 7-Storey 9-Storey
Fig. 3(a) Effectiveness of FVD in reducing Displacement Response against ASR for five, seven and nine storey frames
0 5 10 15 20 25 30
0.0 0.2 0.4 0.6 0.8 1.0 1.2
Effect
iv
enes
s
o
f
FV
D
( %
)
Additional Stiffness Ratio (ASR)
Velocity Response
5-Storey 7-Storey 9-Storey
Fig. 3(b): Effectiveness of FVD in reducing Velocity Response against ASR for five, seven and nine storey frames
0 5 10 15
0.0 0.2 0.4 0.6 0.8 1.0 1.2
Effectiv
eness
o
f
F
V
D
( %
)
Additional Stiffness Ratio (ASR) Acceleration Response
5-Storey 7-Storey 9-Storey
Fig.3 (c) Effectiveness of FVD in reducing Acceleration Response against ASR for five, seven and nine storey frames
than in nine-storey (12%) indicates that FVD is (45%) more effective in damage reduction in low rise than in medium rise structures.
Dynamic response of five storey frames in terms of displacement, velocity and acceleration is shown in Fig.4. Peak response of frames increases from lower to higher floors. Increase in response at consecutive stories is more significant at lower floors than at higher floors indicating higher possibilities of damage concentrations at lower floors.
0 1 2 3 4 5
0 25 50 75 100
F
lo
o
r
N
o
.
Peak Displacements (mm)
El-Centro Kobe Northridge Tabas
Fig.4(a): Peak Displacement responses of five storey frame with FVD (ASR = 1.2) against four different ground motions
0 1 2 3 4 5
0 25 50 75 100
F
lo
o
r
N
o
.
Peak Velocity (mm/s)
El-Centro Northridge Kobe Tabas
Fig.4(b): Peak Velocity responses of five storey frame with FVD (ASR = 1.2) against four different ground motions
0 1 2 3 4 5
0 1000 2000 3000 4000
F
lo
o
r
N
o
.
Acceleration (mm/sec2)
El-Centro Kobe Northridge Tabas
Fig.4(c): Peak Acceleration responses of five storey frame with FVD (ASR = 1.2) against four different ground motions
Highest response is given by Tabas earthquake. Its PGA is lesser than that of Northridge and Kobe which indicates that frequency content of the Tabas matched with the fundamental period of the five storey frame resulting in greater resonance as compared with other earthquakes studied.
Reduction in displacement, velocity and acceleration response of the nine storey frame with increase in ASR of FVDs is shown in Fig.5. With increase in ASR the peak response at all floor levels is reduced as the damping and stiffness of frame structure is increased. The same response was also observed for five and seven storey frames. However, for brevity of discussion only nine storey has been presented. The details about response of five and seven storey frame can be seen in reference 4. It is an indicator of effectiveness of damper in controlling the excessive response during severe shaking.
0 1 2 3 4 5 6 7 8 9
0 100 200 300 400 500
Fl
o
o
r
No
.
Peak Displacements (mm)
ASR 0.2 ASR 0.4 ASR 0.6
ASR 0.8 ASR 1.0 ASR 1.2
Fig.5 (a): Peak displacement responses of nine story frames against ASRs for Kobe Earthquake
0 1 2 3 4 5 6 7 8 9
0 20 40 60 80 100
F
lo
o
r
N
o
.
Peak Velocity (mm/sec) ASR 0.2 ASR 0.4 ASR 0.6 ASR 0.8 ASR 1.0 ASR 1.2
Fig.5 (b): Peak Velocity responses of nine storey frames against ASRs for Kobe Earthquake
0 1 2 3 4 5 6 7 8 9
0 1000 2000 3000 4000
F
lo
o
r
N
o
.
Peak Acceleration (mm/sec2)
ASR 0.2 ASR 0.4 ASR 0.6
ASR 0.8 ASR 1.0 ASR 1.2
Fig.5 (c): Peak Acceleration responses of nine storey frames against ASRs for Kobe Earthquake Storey drift ratio of five, seven and nine storey frames with FVDs having ASR = 1.2 is shown in Fig.6. Drift response increases from bottom to top stories. However, there is a larger variation in storey drifts between two consecutive stories at lower floors than at upper floors which indicates that increase in displacement response at lower stories is more as compared to upper stories. It is evident from the performance levels studied that more damage is concentrated at intermediate storeys. Hence, it can be stated that possibility of damage due to loss of storey stiffness is more at lower stories in low rise frames and at intermediate stories in medium rise frames.
0 1 2 3 4 5
0 5 10 15
F
lo
o
r
N
o
.
Storey Drift Ratio
El-Centro Kobe Northridge Tabas
0 1 2 3 4 5 6 7
0 5 10 15
F
lo
o
r
N
o
.
Storey Drift Ratio
El-Centro Kobe Northridge Tabas
0 1 2 3 4 5 6 7 8 9
0 5 10 15 20
F
lo
o
r
N
o
.
Storey Drift Ratio
El-Centro Kobe Northridge Tabas
Fig.6: Story drifts of Five, Seven and Nine stories with FVD (ASR = 1.2) for four different ground motions
Effectiveness of FVDs in reducing the displacement response by dissipating energy in form of hystersis loop is shown in Fig.7. It is computed by determining the area enclosed by the hystersis loop. Smaller loops indicate lower and larger loops indicate higher energy dissipation capacity, hence reduced damage concentration at the critical sections within the frames. FVD’s modeled in frames at lower stories are significantly more effective in energy dissipation than dampers at intermediate stories (60%). However, dampers at intermediate stories are substantially more effective than dampers at top stories (40%). FVD is used as a bracing member and the lateral cyclic load generates axial tension/compression in the damper. The relationship between axial force and axial deformation is drawn in Fig.7.
-200 -150 -100 -50 0 50 100 150 200 250 300
-0.020 -0.010 0.000 0.010 0.020
Axi
a
l
For
ce
(KN)
Axial Deformation (m)
FVD Floor-1 FVD Floor-2 FVD Floor-3 FVD Floor-4 FVD Floor-5
Fig.7a: Axial Force versus Axial Deformation relationship of FVDs installed at each storey of five storey frame for Tabas EQ
-400 -300 -200 -100 0 100 200 300 400
-0.03 -0.02 -0.01 0 0.01 0.02 0.03 0.04
A
x
ia
l
F
o
r
ce
(KN
)
Axial Deformation (m)
FVD Floor-1 FVD Floor-2 FVD Floor-3 FVD Floor-4 FVD Floor-5 FVD Floor-6 FVD Floor-7
Fig.7b: Axial Force versus Axial Deformation relationship of FVDs installed at each storey of seven storey frame for Northridge EQ
-200 -150 -100 -50 0 50 100 150 200 250
-0.02 -0.01 0 0.01 0.02 0.03 0.04 0.05
A
x
ia
l
F
o
rce
(KN
)
Axial Deformation (m)
FVD Floor-1 FVD Floor-2 FVD Floor-3 FVD Floor-4 FVD Floor-5 FVD Floor-6 FVD Floor-7 FVD Floor-8 FVD Floor-9
Fig.7c: Axial Force versus Axial Deformation relationship of FVDs installed at each storey of nine storey frame for El-Centro EQ Effect of ASR on base shear versus lateral displacement of five storey frame is shown in Fig. 8. Increase in ASR results in a decrease in displacement response. Lesser amount of damage/ yielding results in a decrease in energy dissipation. Lateral displacements and base shear is also determined from non-linear dynamic analysis.
-1000 -500 0 500 1000
-0.2 -0.15 -0.1 -0.05 0 0.05 0.1
Ba
se
Shea
r
(KN
)
Lateral Displacement (m)
No Damper 0.2 ASR 0.4 ASR
0.6 ASR 1.0 ASR 1.2 ASR
Fig.8a: Effect of ASR on Base shear versus Lateral Displacement response of five storey frame for Kobe EQ
-1000 -500 0 500 1000
-0.1 -0.05 0 0.05 0.1 0.15
Ba
se
Shea
r
(KN
)
Lateral Displacement (m)
No Damper 0.2ASR 0.4ASR
0.6ASR 1.0ASR 1.2ASR
Fig.8b: Effect of ASR on Base shear versus Lateral Displacement response of five storey frame for Tabas EQ
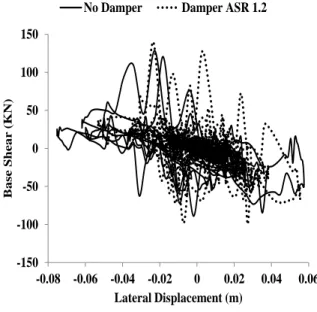
Effect of FVD and ASR on low and medium rise frames is shown in Fig.9. The increase in ASR
of FVDs reduces the displacement response and lesser hysteretic energy is dissipated. Since, area under the load deflection curve has decreased, hence the ductility demand of frame structure is reduced. Reduction in displacement response in five storey frame is less than that of nine storey frames.
-150 -100 -50 0 50 100 150
-0.08 -0.06 -0.04 -0.02 0 0.02 0.04 0.06
Ba
s
e
Shea
r
(KN)
Lateral Displacement (m) No Damper Damper ASR 1.2
Fig. 9(a): Base shear versus lateral displacement for five storey frames with and without FVD for Northridge EQ.
-200 -150 -100 -50 0 50 100 150
-0.2 -0.1 0 0.1 0.2 0.3
Ba
se
Shea
r
( KN
)
Lateral Displacement (m)
No damper Damper1.2 ASR
Fig. 9(b): Base shear versus lateral displacement for nine storey frames with and without FVD for El-Centro EQ.
Damage Indicator in terms of percentage change in stiffness of medium rise frames without and with FVD (ASR = 1.2) is shown in Fig.10. Change in stiffness is one of the indicators of damage in frame. Change in stiffness is determined from pushover curve. Structure stiffness changes after non-linear
dynamic analysis. One frame structure without FVD and rest with ASR ranging from 0.2 to 1.2 with an increment of 0.2 are modeled and nonlinear dynamic analysis with four different ground motions is performed. The figures show that percentage change in storey stiffness is more at lower stories than at upper stories, hence higher damage concentration is at lower stories than at upper stories. Storey drift also reinforces the damage indicator results. More than 50% damage concentration is at intermediate stories.
0 20 40 60 80
1 2 3 4 5 6 7
P
er
centa
g
e
cha
ng
e
in
Stiffnes
s
Floor No.
El-Centro Kobe Northridge Tabas
Fig. 10(a) : Damage Indicator in terms of percentage change in stiffness for seven storey frames.
0 20 40 60 80
1 2 3 4 5 6 7 8 9
P
er
centa
g
e
cha
ng
e
in
Sti
ffnes
s
Floor No.
El-Centro Kobe Northridge Tabas
Fig.10(b) Damage Indicator in terms of percentage change in stiffness for nine storey frames.
Damage Indicator in terms of percentage change in natural frequency for different earthquakes is shown in Fig.11.
100 ASR
) x .( Freq
ASR ) x .( Freq ASR ) 2 . 1 ( Freq . Freq change
% (7)
In Eq.7, (x) represents range of ASR from 0 to 1.2 with an increment of 0.2. It is obvious from the fig.11 that with an increase in ASR of FVDs the overall stiffness is improved and consequently natural frequencies of frames is increased. Since section yielding and corresponding damage results in lengthening of the fundamental period of the frame. Therefore, a decrease in spectral acceleration/lateral force with an increase in time period is evident. It can be concluded from damage indicator that dampers are more effective in low rise than in medium rise frames.
0 2 4 6 8 10 12 14
1.2 1.0 0.8 0.6 0.4 0.2 0.0
D
a
m
a
g
e
Indi
ca
to
r
interm
s of
per
centa
g
e
incr
ea
se
in n
a
tura
l
fr
equency
Additional Stiffness Ratio 5-Storey 7-Storey 9-Storey
Fig.11: Damage indicator in terms of percentage increase in natural frequency of modeled frames
In Fig.12 the performance level of five storey frames with and without FVD against Kobe earthquake is presented. The increase in ASR improves the performance level from collapse to immediate occupancy/operational level and hence damage is significantly reduced. These performance Levels are defined in FEMA-440. In this study lateral load is incremented until hinges are formed in frames at operational level to fully utilize the structure strength.
It is evident from the damage degree that the frame with FVD performed better. Since, it is observed that the damage for the same lateral displacement at the more lateral load is reduced.
Fig.12 Performance Level of Five storey Frame Without and
With FVD (a) (b)
Fig.12: (a) Performance Level of five storey frame without FVD, (b) Performance Level of five storey frame with FVD
Legends
1. Operational Level 2. Immediate Occupancy 3. Life Safety
4. Collapse Prevention 5. Collapsed
6. Damaged
7. Completely-Damaged d
5. Conclusions
In this study five, seven and nine storey frames are studied with FVDs. Based on this study following conclusions can be drawn.
1. The Performance of frame structure is significantly improved with an increase in ASR of FVDs. Damage level shifts from lower (damaged and collapsed level) to higher (life safety and immediate occupancy level) performance level.
2. Effectiveness of FVD with an increase in ASR of FVD is 45% more in low rise than in medium rise frames.
3. Strain energy dissipation of FVDs first increases about (60%) in low to medium rise frames and attains peak and then decreases to about (40%). 4. FVDs dissipate more energy at lower than at
upper stories. At lower and intermediate stories the energy dissipation capacity is 30% more than at upper stories.
5. In low rise frames more damage is at lower storeys (64%), while in medium rise modeled frames damage concentration is at intermediate storeys (65%).
6
References
[1] B.F.Spencer Jr and S. Nagarajaiah ; Journal of Structural Engineering, ASCE July (2003) 845-856.
[2] M. D. Symans, F. A. Charney ; FEMA Presentation on Seismic protective systems: Passive energy dissipation, presented at MBDSI in 2001and 2002.
[3] Fundamental Concepts of Earthquake Engineering ; Luis Esteva (1980) Ch-17 “Seismic Code Provisions”, Vol.1, 753-923. [4] Q. S. Khan ; Application of vibration control in
health monitoring of building structures, M.Sc. Thesis, CED, UET, Lahore (2011).
[5] K. Kawashima and S. Unjoh ; Seismic response control of bridges by variable dampers, Journal of Structural Engineering (1994), 2583–2601.
[6] R.L.Sack and W. Patten ; Semiactive hydraulic structural control.’’Proc., Int. Workshop on Structural Control, USC Publication Number CE-9311 (1993), 417–431.
[7] W.N.Patten,R. Sack and Q. He ; Controlled semiactive hydraulic vibration absorber for bridges.’’ Journal of Structural Engineering, (1996) 187– 192.
[8] M.D.J. Symans and M.C. Constantinou ; Seismic testing of a building structure with a semiactive fluid damper control system, Earthquake Engineering Structure Dynamics, (1999) 759–777.
[9] S. Nagarajaiah ; Fuzzy controller for structures with hybrid isolationsystem, Proc., 2nd World Conf. Structural Control, Wiley,New York, TA2 (1994) 67–76.
[10] J. Yan, L.Cheng, Z.Y.Wu, L.H.Yam ; Development in vibration based structural damage detection technique, Elsevier, Mechanical System & Signal Processing (2006) 2198-2211.
[11] Y.L.Xu, B. Chen ; Integrated vibration control and health monitoring of building structures using semi-active friction dampers: Part I-methodology, Elsevier, Engineering Structures, (2008) 1789-1901.
[12] O.S.Salawu ; Detection of structural damage through changes in frequency: a review, Elsevier, Engineering Structures, (1994) 718-723.
[13] M. D. Symans and M.C. Constantinou ; Passive Fluid Viscous Damping Systems for energy dissipation, ISET Journal of Earthquake Technology (1998) 185-206.
[14] Y.L.Xu and B.Chen ; Integrated vibration control and health monitoring of building structures using semi-active friction dampers: Part II-Numerical Investigation” Elsevier, Engineering Structures, (2008) 573-587. [15] SAP 2000 version 14.4, Computers and
Structures, Berkeley, California, USA, 2010. [16] Anil K. Chopra ; Dynamics of Structures
Theory and Applications to Earthquake Engineering, Third Edition, Pearson Education, 2007.
[17] W. H. Lin and A. K. Chopra ; Earthquake Response of Elastic SDOF systems with non-linear Fluid Viscous Dampers, Earthquake Engineering and Structural Dynamics.
[18] Applied Technology Council ; FEMA 440 Improvement of Non-Linear static seismic analysis procedures”, 2000.
[19] Peer.berkeley.edu/peer-ground-motion-database/site.