Sharif University of Technology
Scientia IranicaTransactions A: Civil Engineering www.scientiairanica.com
Performance-based multi-objective optimal design of
steel frame structures: Nonlinear dynamic procedure
A. Kaveh
, M. Fahimi-Farzam and M. Kalateh-Ahani
Centre of Excellence for Fundamental Studies in Structural Engineering, Iran University of Science and Technology, Narmak, Tehran, P.O. Box 16846-13114, Iran.
Received 30 January 2014; received in revised form 23 June 2014; accepted 28 June 2014
KEYWORDS Performance-based design;
Nonlinear dynamic analysis;
Steel frame structures; Seismic damage cost; Non-dominated sorting genetic algorithm;
Generalized regression neural network; Fuzzy c-mean clustering; Wavelet analysis.
Abstract. The main problem in performance-based structures is the extremely high computational demand of time-history analyses. In this paper, an ecient framework is developed for solving the performance-based multi-objective optimal design problem considering the initial cost and the seismic damage cost of steel moment-frame structures. The Non-dominated Sorting Genetic Algorithm (NSGA-II) is employed as the optimization algorithm to search the Pareto optimal solutions. For improving the time eciency of the solution algorithm, the Generalized Regression Neural Network (GRNN) is utilized as the meta-model for tness approximation, and a specic evolution control scheme is developed. In this scheme, in order to determine which individuals should be evaluated using the original tness function and which by the meta-model, the Fuzzy C-Mean (FCM) clustering algorithm is used to choose the competent individuals rather than choosing the individuals randomly. Moreover, the computational burden of time history analyses is decreased through a particular wavelet analysis procedure. The constraints of the optimization problem are considered in accordance with the FEMA codes. The results obtained from numerical application of the proposed framework demonstrate its capabilities in solving the present multi-objective optimization problem.
© 2015 Sharif University of Technology. All rights reserved.
1. Introduction
Performance-based engineering is an emerging philoso-phy for design, rehabilitation and maintenance of new and/or existing engineering structures. The aims are to overcome the limitations of the current design codes that are based on deterministic structural analyses, and prescriptive procedures intended to preserve life safety. The most distinctive feature of the new trend from conventional design practice is the explicit requirement of deformation-based structural performance under dierent hazard levels to achieve structural designs that
*. Corresponding author. Tel.: +98 21 77240104 E-mail addresses: [email protected] (A. Kaveh); [email protected] (M. Fahimi-Farzam); [email protected] (M. Kalateh-Ahani)
not only reliably protect human lives after rare ground motions, but also decrease damage after more frequent ground motions and, thereby, reduce lifetime costs [1]. The damage state associated with each hazard level is dened by deformation indices as a measure of distortion severity that a structure will experience during signicant earthquake events of that particular level. Thus, the concept of damage control can be incorporated in the design stage for reducing future economic losses, rather than just design a structure for severe damage states as required in conventional design codes [2].
In terms of nancial considerations, the total cost of a structure is not only dependent on its initial operation costs, but also the secondary costs such as maintenance, damage, and repair expenses have great impact on the entire expected cost of a structure in
its lifetime and should be included in decision making process [3]. In the literature, the entire expected life cost of a structure is known as life-cycle cost [2]. It is shown that an optimum design with respect to the minimum initial cost is far from being optimum with respect to the total cost corresponding to the lifetime of the structure; hence, an optimized seismic design is obtained when it can achieve balanced minimization of two general conicting objective functions: the present capital investment and future seismic risk [4].
Interstory drift is an excellent parameter for judging the ability of a structure to resist P instability and collapse. It is also closely related to plastic rotation demand, or drift ratio demand, on individual beam-column connection assemblies, and is therefore a good predictor of the performance of beams, columns and connections [5]. Wen and Kang [6], based on FEMA-227 data, proposed a relationship using the exceedance probability of the maximum interstory drift from the predened drift levels to evaluate the seismic damage cost, which has been successfully adopted in several researches in the last decade [2,3,7]. In this way, a structural analysis procedure is needed to be performed as part of the performance evaluation process to predict the values of maximum interstory drift that are indicative of the structure's performance when it is subjected to ground motion. The ability of the performance evaluation to estimate reliably the probable performance of the structure is dependent on the ability of the analysis procedure to predict the values of these response parameters within acceptable levels of condence. The linear procedures are the most unreliable approaches due to inherently so many uncertainties with their estimates of the structural deformation capacity. The nonlinear static procedure is more reliable than the linear procedures in predict-ing response parameters for structures that exhibit signicant nonlinear behavior, particularly if they are irregular. However, it does not accurately account for the eects of higher mode response. If appro-priate modeling is performed, the nonlinear dynamic approach is most capable of capturing the probable behavior of the real structure in response to ground motion, since all modes of vibration, geometric and material nonlinearities, and second-order eects can be directly included in the analysis [5]. Nevertheless, extensive computational demand has prohibited the widespread application of such analyses in practice. This problem will be resonated when these analyses are applied to iterative procedures such as optimization [8]. Performance-based design optimization is a com-bination of state-of-the-art performance-based seismic engineering and meta-heuristic algorithms into an au-tomated design environment where design optimization is implicitly built into the process [1]. In recent years, several studies have been conducted on this
subject. Ganzerli et al. [9] minimized overall material cost for a simple reinforced concrete portal frame with performance constraints on beam/column plastic rotations. Foley [10] discussed the application of structural optimization techniques in a performance-based design framework. Liu et al. [4] formulated the performance-based seismic design of steel special moment-resisting frame structures as a multi-objective optimization problem in which conicting design cri-teria that, respectively, reect the initial investment and the seismic repair cost, were considered as the objective functions. Fragiadakis et al. [7] proposed a methodology for the optimum design of steel structures using static pushover analysis in order to determine the level of damage for dierent earthquake intensities. Alimoradi et al. [11] provided a multi-objective opti-mization procedure for design of steel frames based on the probabilistic performance-based formulations and employing nonlinear dynamic analysis as the analytical basis; this procedure was tested for the design of a por-tal and a three-story frame. Kaveh et al. [3] presented a framework for the optimum seismic design of steel structures based on life-cycle cost considerations with the purpose of decreasing the computational burden of required pushover analyses during the optimization process to make the procedure feasible for the large-scale structures.
The aim of this study is to develop a practical and automated framework for the performance-based optimum design of steel moment-frame structures with an acceptable computational time. In this way, min-imization of life-cycle cost is considered by treating the initial and seismic damage costs as two separate objectives of the optimization problem. The meta-heuristic, employed here, belongs to a subclass of evolutionary algorithms. NSGA-II [12] is a popular, fast sorting and elitist multi-objective genetic algo-rithm that the wide application of this algoalgo-rithm in engineering problems proves its great abilities in cov-ering the Pareto front and solving the multi-objective optimization problems. However, the main problem in utilizing every evolutionary algorithm is the need to perform a large number of tness function evaluations. This problem is involved to a great extent in our specic optimization problem, because each tness function evaluation contains two time-history analyses that takes a long time even if advanced computers are employed. Consequently, the required computational time for this problem, especially for large structures, if no remedies are employed, may exceed several hundreds of hours, and this high computational time may convert the solution algorithm to an illogical one.
During the recent years, extensive studies have been performed on nding methods to reduce the computational burden of time-history analyses in the optimization procedures, which are classied in two
general categories. Firstly, studies on developing meta-models to quickly and precisely predict the time-history response of structures. Secondly, studies on producing surrogate records for original earthquake records that have larger time steps but have almost the same eects on the structures. Radial Basis Function (RBF) networks, emerged as a variant of articial neural net-works, have been successfully implemented as a reliable meta-model for predicting the response of structures under time-history loading. Fast training, reasonable accuracy and simplicity make RBF network a powerful tool for decreasing computational cost of time-history analyses in iterative procedures [8,13,14]. In the eld of producing surrogate records, wavelet analysis has been shown to be much eective. Wavelet transform can divide an earthquake signal into two parts: Low frequency approximation and high frequency detail part. Low frequency part is the most inuential part of the original signal on the response of structures. It can also be eectively used in dynamic analysis of struc-tures to decrease the number of points of earthquake record involved in the time-history loading [8,15,16]. In this study, both introduced remedies for computational eciency of time history analyses are employed in the proposed framework.
After this opening section, the paper is orga-nized as follows: Section 2 explains the concept of performance-based design and the details. Section 3 briey introduces the NSGA-II. Calculation of the seis-mic damage cost is explained in Section 4. In Section 5, the strategy employed for the tness approximation is presented. Section 6 illuminates the main ideas behind using wavelet analysis. The proposed framework is pre-sented in Section 7. Section 8 studies the performance-based design of a ten-story steel moment-frame and nally the paper is concluded with Section 9.
2. Performance-based design procedure
Minimization of life-cycle cost for an individual struc-ture can be achieved by optimizing performance under various seismic hazard levels. FEMA-350 [5], Recom-mended Seismic Design Criteria for New Steel Moment-Frame Buildings, evaluates structural performance at two levels of seismic hazard:
Maximum Considered Earthquake (MCE) ground motions with less than 2% probability of exceedance in 50 years;
Frequent Earthquake (FE) ground motions with 50% probability of exceedance in 50 years.
Under FEMA-350, each building and structure must be assigned to one of three Seismic Use Groups (SUGs). Buildings are assigned to the SUGs based on their intended occupancy and use. Most commercial,
residential and industrial structures, such as those studied in this paper, are assigned to SUG I. FEMA-350 states that all buildings should, as a minimum, be designed in accordance with the applicable pro-visions of the prevailing building code, i.e. AISC-LRFD specications [17], and for which it is desired to attain other performance than implied by the code, or for which it is desired to have greater condence that the building will actually be capable of attaining the desired performance, the performance evaluation procedure of this document may be followed. In the two-step procedure of FEMA-350 for the performance evaluation, at each step one performance objective is veried. Each performance objective consists of the specication of a structural performance level and a corresponding hazard level, for which that performance level is to be achieved. Performance objectives for SUG-I structures can be expressed as [5]:
Collapse prevention building performance level for earthquake demands that are less severe than the MCE ground motions;
Immediate occupancy building performance level for earthquake demands that are less severe than the FE ground motions.
Buildings meeting Immediate Occupancy (IO) level are expected to sustain minimal or no damage to their structural elements and only minor damage to their nonstructural components, so immediate reoccu-pancy of the building is safe. At Collapse Prevention (CP) level, buildings may pose a signicant hazard to life safety resulting from failure of nonstructural components. However, because the building itself does not collapse, gross loss of life could well be avoided. Many buildings, meeting this level, will be complete economic losses [5]. It should be noted that although nonstructural components damage is extremely important, the present methods for the estimation of potential seismic damage only consider structural components.
In order to evaluate the performance of a struc-ture through the mentioned seismic hazard levels, it is necessary, rst of all, to construct a mathematical model of the structure that represents its strength and deformation characteristics, and to conduct a time-history analysis to predict the values of various demand parameters at each hazard level. In a nonlinear dynamic analysis procedure, the response of a structure under a time-history loading is determined through numerical integration of the equation of motion for the structure, while structural stiness is altered during the analysis to conform to nonlinear hysteretic models of the structural components. In this study, for the structural modeling and analysis process, we utilize the advanced capabilities of OpenSees [18] in modeling
and analyzing the nonlinear response of structures. OpenSees® is an open-source software for simulating the seismic response of structural and geotechnical systems that has been developed as the computational platform for research in performance-based earthquake engineering at the Pacic Earthquake Engineering Research Center.
2.1. Ground motion characterization
FEMA-350 implies that the ground motion accelera-tion histories should be prepared in accordance with the recommendations of FEMA-273 [19]. For 2D structures, the analysis shall be performed with a suite of not less than three ground motion time his-tories, each containing a horizontal component. Time histories shall have magnitude, fault distances, and source mechanisms that are equivalent to those that control the design earthquake ground motion. Where three recorded ground motion time history data sets having these characteristics are not available, simulated time history data sets having equivalent duration and spectral content shall be used to make up the total number required. The acceleration time histories shall be scaled such that the average value of the 5%-damped response spectra for the suite of motions does not fall below the target response spectrum for the site for periods between 0:2T seconds and 1:5T seconds, where T is the fundamental period of the structure [19].
The performance evaluation procedure of FEMA-350 consists of two analysis steps, each associated with a given hazard level. Therefore, at each step, the analysis should be performed for a suite of ground motion records that have been scaled to the respective target response spectrum. FEMA-273 has presented equations for calculating the response spectrum of MCE ground motions in which the required seismic input data can be found on the ground-shaking hazard maps provided by this document. Based on FEMA-273, FE response spectrum for California region is dened as a spectrum that is 0.29 of the shaking intensity calculated for the MCE spectrum at each period.
In this study, only one ground motion is used at each hazard level to reduce computational demand. In addition, instead of using a real ground motion time history, in order to have a more appropriate record compatible with the seismic characterization of the site, the real earthquake record is adjusted and scaled using SeismoArtif® [20] to generate an articial earthquake record matched to the target response spectrum given in FEMA-273. SeismoArtif® is a software capable of generating articial earthquake records matched to a specic target response spectrum using dierent calculation methods and varied assumptions. In those cases, where access to real records is, for whatever reason, challenging or inappropriate, then a tool such
as SeismoArtif® will be of pertinence and usefulness. Even this method could be a good solution for time eciency improvement of time-history analyses by applying a spectrum matched record rather than at least three ground motion time histories considered by FEMA-273.
Since for the performance evaluation, only the maximum response of the structure is needed, in order to reduce the computational burden, the eective du-ration of the ground motion can be used in the analysis instead of considering the whole earthquake record [8]. The eective duration of a ground motion determines the start and end of the strong shaking phase that is the time interval between the accumulation of 5% and 95% of ground motion energy, where ground motion energy is dened by the Arias Intensity [21]. The end of the duration indicates the time that the maximum response will occur denitely until then; therefore in order to achieve a time ecient analysis, the record needs to be analyzed up to this time and further analysis is not necessary. The eective duration of an earthquake record can be easily computed by the available software like SeismoSignal® [22]. In this paper, the concept of the eective duration is applied with the dierence that here the start of the duration is considered to be from the start of the given earthquake record.
2.2. General requirements and performance evaluation
The seismic provisions of FEMA-350 for the design of new steel moment-frame structures implies that in order to check the validity of any design alternative, rst, the required strength of structural members and connections should be veried by the AISC-LRDF specications. Checks for strength can be found in any text book on the design of steel structures. In this study, the equivalent lateral force procedure of ASCE-7 [23] is used for seismic design of structures. Then, structures should be analyzed under the FE and MCE ground motions, respectively, and checked whether the acceptance criteria for IO and CP performance objectives are satised or not.
FEMA-350 presented a probabilistic procedure that evaluates structural performance in terms of condence levels for specied structural response pa-rameters, including, interstory drift ratio, column axial compression force and column (splice) tension force. These structural response parameters are related to the amount of damage experienced by individual structural components as well as the structure as a whole [5]. For each performance level, FEMA-350 spec-ies acceptance criteria (median estimates of capacity) for each of these response parameters. Acceptance criteria have been developed on a reliability basis, incorporating demand and resistance factors related to the uncertainty inherent in the evaluation process and
variation inherent in structural response, such that a condence level can be estimated with regard to the ability of a structure to meet the desired performance objectives [5]. If an evaluation indicates a high level of condence, for example 90 or 95% that a performance objective can be achieved, then this means it is very likely (but not guaranteed) that the building will be capable of meeting the desired performance. If lower condence is calculated, for example 50%, this is an indication that the building may not be capable of meeting the desired performance objective. If still lower condence is calculated, for example 30%, then this indicates the building will likely not be able to meet the desired performance objective [5].
Although column axial compression and tension, and connection drift ratio are important response measures in assessing performance of steel frames, due to the limitations of the current study, they are omitted from consideration. If one assumes global behavior limited by interstory drift as the controlling response parameter, as done in the present work, the FEMA-350 methodology requires at least 50% condence in attaining IO performance and 90% condence in meeting CP performance objectives. Consequently, for the mid-rise special steel moment frames considered in this study, the maximum allowable interstory drift ratio of 1.5% and 5% are followed at the IO and CP performance levels, respectively.
3. Optimization algorithm: NSGA-II
The NSGA-II algorithm and its detailed implementa-tion procedure can be found in [12]. Here under, a general description of NSGA-II is presented. Once the population is initialized, two tness values are assigned to each individual. Firstly, NSGA-II uses a \non-dominated sorting" algorithm for the tness assignment in which all individuals, not dominated by any other individuals, are assigned front number 1. Then all individuals only dominated by individuals in front number 1 are assigned front number 2, and so on. Secondly, a value called \crowding distance" is calculated for each individual that is a measure of how close an individual is to its neighbors. A higher tness value is assigned to individuals located on the sparsely populated part of a front [24].
Parent selection is made using a \binary tourna-ment selection" based on the assigned tness values. This selects, between two random individuals, the one with the lowest front number, if the two individuals are from dierent fronts. While the individuals are from the same front, the individual with the highest crowding distance is chosen. Next, the selected indi-viduals generate osprings using the genetic operators. The ospring population is combined with the current generation's population and replacement is performed
to set the individuals of the next generation. Since all the previous and current best individuals are included, elitism is ensured. The combined population is now sorted based on the non-domination rule. The new generation is lled by each front, subsequently, until the population size exceeds the given size. If by adding all the individuals from the ith front, the population size exceeds, then individuals in the ith front are selected based on their crowding distance in the descending order until the population is fullled. And then, this process repeats to generate the subsequent generations, until the termination criteria is met [24].
3.1. Genetic operators
The chosen genetic operators are the Dierential Evo-lution (DE) operator for crossover and the polynomial mutation. The role of crossover operator is to inherit some genetic materials of the parents to generate the osprings, whereas mutation alters one or more gene values in a chromosome from its initial state. Hence, the mutation and crossover operators are complemen-tary, that is, mutation maintains genetic diversity from one generation of a population of algorithm chromosomes to the next while the crossover operator preserves the heritability between generations [25].
Instead of the classical crossover operators of genetic algorithms, where parts of the parents are recombined, the DE operator is based on a linear combination in which the distance concept plays im-portant role. The algorithm of the DE operator can be described as [25]:
DE Crossover operator f
1. Select randomly a parent x and three other dierent individuals r1, r2 and r3 from the parents
popula-tion.
2. Pick a random index irand 2 f1; :::; ng, where n is
the dimensionality of the problem.
3. Generate an ospring x0 = fx0
1; :::; x0ng.
3.1 For each gene, pick a uniformly distributed number randi in the range [0,1].
3.2 3.2 If randi < CR or i = irand then set x0i =
Fix r3
i + F (r1i r2i)
, else set x0 i= xi.
g.
The parameter F 2 [0; 1] represents the dier-ential weight that controls the amplication of the dierence between individual r1 and r2, and is used to
avoid stagnation of the search process. The parameter CR 2 [0; 1] is called the crossover probability. As men-tioned, with probability CR, the ospring associated variable will be a linear combination of three randomly chosen solutions; otherwise the variable will inherit the value of its parent. The condition i = irandis included
to ensure that at least one variable of the ospring will be dierent from its parent.
After the crossover operator is performed, muta-tion takes place on the newly formed individual. In the polynomial mutation, the ospring is generated as follows [25]:
x00
i = Fix (x0i+ (ui li)i) ; (1)
where ui (resp. li) represents the upper bound (resp.
lower bound) for x0
i, the ith variable (gene) of parent.
The parameter i is computed from the polynomial
probability distribution: i=
8 < :
(2randi)
1
m+1 1 if randi< 0:5
1 (2(1 randi))
1
m+1 otherwise (2)
where m denotes the distribution index and randi is
a random number in [0,1]. Mutation should produce a minimal change and the size of mutation should be controllable. The parameter m provides these
features, e.g. taking m to be 20 limits the values
of i in [-0.4, 0.4]. Whenever a variable of the new
individual, during crossover or mutation, goes out of the boundary of acceptable domain, its value is reset to the value on the nearest boundary.
3.2. Constraints handling
In order to handle the given constraints, a relatively simple scheme is adopted. Whenever two individuals are compared, for sorting the population in dierent fronts, rst, they are checked for constraint violation. If both are feasible, the non-domination rule is directly applied to decide the winner. If one is feasible and the other is infeasible, the feasible dominates. If both are infeasible, then the one with the lowest amount of constraint violation dominates the other. This is the approach that has been utilized by [12,26] to handle the constraints.
4. Lifetime seismic damage cost
For a structure that is designed against probable earthquakes, ignoring the maintenance cost, the whole expected life cost of the structure is the total of initial cost and seismic damage cost. Initial cost of a new structure refers to the cost of the structure during the construction stage. For steel-framed structures, it is usually considered to be proportional to the total weight of its components [27]. Lifetime seismic damage cost, in general, refer to the potential damage cost from earthquakes that may occur during the life of the structure, including the cost of damage after an earth-quake, loss of contents, injuries or human fatalities, and other direct or indirect economic losses [2]. Yet, in structural engineering, often focus is on estimating the seismic structural damage or repair costs. Within a performance-based seismic design framework, damage
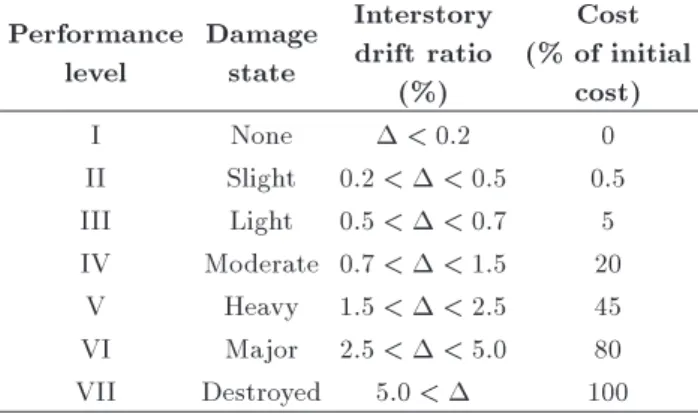
costs may be related to dierent levels of damage state violations [27]. In this study, seven damage states in terms of maximum interstory drift ratios (see Table 1 from [6]) are used to describe the respective performance levels. As provided in Table 1, the cost of exceedance of a damage state is obtained as a per-centage of the initial cost. Based on a Poisson process model of earthquake occurrences and an assumption that damaged buildings are retrotted to their original intact conditions after each major seismic attack, Wen and Kang [6] proposed the following formula for the expected lifetime seismic damage cost:
CLSD= v(1 e t) n
X
i=1
CiPi; (3)
where n is the number of damage states considered; t is the service life of a new structure or the remaining life of a retrotted structure; v is the annual occurrence rate of signicant earthquakes; is the annual momen-tary discount rate assumed to be constant and equal to 5%; Ci is the retrotting cost of ith damage state
violation, expressed in Table 1; and Piis the probability
of ith damage state violation, evaluated from:
Pi= Pi( > i) Pi( > i+1); (4)
in which i and i+1 are the drift ratios dening
the lower and upper bounds of ith damage state and Pi( > i) = 1=v: ln(1 Pi( > i)), where
Pi( > i) is the annual exceedance probability of the
maximum interstory drift ratio. It should be noted that v can be cancelled in the above equation if the seismic damage cost associated with the rst damage state, C1, is zero [4], which is the case in the cost function
formulations applied this study.
The damage states listed in Table 1 are reached when the corresponding maximum interstory drift ra-tios have exceeded the prescribed limitations. The annual exceedance probability of the ith damage state is obtained from a relationship of the form:
Pi( > i) = e i; (5)
Table 1. Structural performance and damage states in terms of interstory drift ratios, and corresponding costs.
Performance level
Damage state
Interstory drift ratio
(%)
Cost (% of initial
cost)
I None < 0:2 0
II Slight 0:2 < < 0:5 0.5 III Light 0:5 < < 0:7 5 IV Moderate 0:7 < < 1:5 20
V Heavy 1:5 < < 2:5 45 VI Major 2:5 < < 5:0 80 VII Destroyed 5:0 < 100
where the parameters and are obtained by the best t of the known pairs of pi and i [27]. In
accordance with FEMA-350, these pairs may corre-spond to the MCE and FE hazard levels with 2% and 50% probabilities of exceedance in 50 years that have known annual probabilities of exceedance, and the respective maximum interstory drift ratios i may be
obtained from time-history analyses under these hazard level ground motions. According to Poisson's law, the annual probability of exceedance of an earthquake with a probability of exceedance p in t years is given by
P = 1=t: ln(1 p) [27]. For calculation of Pi( > i)
in Eq. (4), the annual exceedance probability of the drift ratio dening the ith damage state, Pi( > i),
is directly read from the obtained tted curve. 5. Fitness approximation strategy
In the present optimization problem, tness function evaluation is the most time-consuming part of the solution algorithm. If all of the required tness function evaluations are performed by time-history analysis, it may need several hours even for small structures, since evolutionary algorithms usually need a large number of tness evaluations to obtain a good solution. The solution of this problem is the use of computation-ally ecient approximations of the tness function; a remedy utilized for solving optimization problems with expensive objective functions [28].
In many real-world problems, due to the lack of data and the high dimensionality of the input space, it is very dicult to obtain a perfect global functional approximation (meta-model) of the original tness function [28]. To alleviate this problem, two main measures can be taken. Firstly, the quality of the approximate model should be improved as much as possible, given a limited number of data. Several aspects are important to improve the model quality, such as selection of the model, the proper choice of input and output data sets employed for training of the model, and use of active data sampling. Secondly, the approximate model should be used together with the original tness function. In the most cases, the original tness function is available, although it is computationally very expensive. Therefore, it is very important to use the original tness function eciently. This is known as model management in conventional optimization or evolution control in evolutionary com-putation [28]. In the next two subsections, these two concerns are reviewed in our specic optimization problem.
5.1. Meta-model selection
Neural networks are adaptive statistical models, which can be trained and used for predicting the response of a function. A neural network consists of an
intercon-nected group of simple processing elements called ar-ticial neurons, which exhibit complex global behavior determined by pattern of connections between them. Advanced neural networks have shown to be eective in modeling most complicated non-linear relationships between inputs and outputs [28].
RBF neural networks have been successfully ap-plied as a reliable meta-model for predicting the time-history response of structures. The obtained results demonstrate that with respect to the model precision and the required computational time, the RBF net-works perform well [13,14]. In the present study, the generalized regression neural networks are exploited for predicting the nonlinear time-history response of structures in the optimization process. GRNN is an advanced variant of RBF networks that is also known as normalized RBF network. GRNN has a radial basis layer and a special extra linear layer that performs normalization on the output set. Normalization yields accuracy improvement even for small size inputs. De-tailed information about these networks can be found in [29].
Selection of the input data should be done in a manner that rstly it can represent the considered structure properly, secondly it should be a suitable representative of the structural behavior under lateral loads, and nally the trained network by these input data should be able to predict the nonlinear time-history response of the structure with an acceptable precision [3]. In this study, two alternatives for the input data are veried, the section numbers of the structural members and the natural frequencies. Among these two, natural frequencies result in the more accurate estimates of the desired parameters. Further, in large structures, the number of member groups is considerable that makes the training process complicated and time consuming. Additionally, the section numbers cannot be an acceptable representative of the structural behavior under lateral loads. In fact, the considered data should be capable of representing the stiness of the structure and it is well known that the natural frequencies are good representative of the structural stiness. On the other hand, the natural frequencies of a structure can be determined by a modal analysis in a really short time. These properties of natural frequencies make them a proper choice for the input data of the neural networks in our problem.
For selecting- the output data, it should be noted that the rst objective of the optimization problem, i.e. weight of the structure, does not need any kind of structural analysis and is easy to calculate. Whereas evaluation of the second objective, i.e. the lifetime seismic damage cost of the structure, as noted in the previous section, requires two time-history analyses. In this study, two parameters, the maximum interstory drift ratio of the structure under FE and MCE hazard
level ground motions, are considered as the output parameters of the network. In this way, by the use of a specic active data sampling technique that will be explained in the following, a GRNN can be trained to predict the output parameters of a new generated individual.
5.2. Evolution control
Application of approximate models in the evolutionary optimization procedures is not as straightforward as one may expect. One important point is that it is very dicult to construct a meta-model that is globally accurate due to the high dimensionality, ill distribution, and limited number of training samples [28]. There are three major concerns in using meta-models for the tness approximation. Primarily, it should be ensured that the evolutionary algorithm converges to the global optimum or a near optimum of the original tness function. Secondly, the computational cost should be reduced as much as possible. Thirdly, in the process of evolutionary optimization, the range of the solutions may change signicantly and the model trained by the initial data may converge to a false optimum. Therefore, it is quite essential in most cases that the approximate model be used together with the original tness function [28].
In addition, when approximate models are in-volved in evolution, it is very important to determine which individuals should be evaluated using the orig-inal tness function to guarantee a faster and correct convergence of the evolutionary algorithm [30]. In this paper, the Fuzzy C-Means (FCM) clustering algorithm is applied to group the individuals of a population into a number of clusters. For each cluster, only the representative of the cluster, the individual that is closest to the cluster center, will be evaluated using the expensive original tness function. The tness of other individuals in a cluster are estimated using a GRNN, which is specically constructed and trained for that cluster. This is the method that has been employed in [30] to choose the individuals to be evaluated by the original tness function rather than choosing the individuals randomly. However, in there, the k-means algorithm has been applied for member clustering.
FCM is a data clustering technique wherein each data point belongs to a cluster to some degree that is specied by a membership grade. These grades indicate the strength of the association between that data element and a particular cluster. Fuzzy clustering is a process of assigning these membership grades, and then using them to assign data elements to one or more clusters. See [31] for more information on this algorithm and its background.
The decision about the evolution control should be made based on the properties of the problem under consideration that can be achieved through trial and
error. In our specic problem, at each generation, once all individuals are generated by the genetic op-erators, FCM algorithm clusters them into k clusters and calculates the membership grades. Based on the maximum membership, grade of an individual is computed for which of the k clusters, that individual is assigned to one particular cluster. Therefore, every individual is assigned to a unique cluster. For each cluster, the individual that has the highest membership grade, which is the individual in the closest position to the cluster center, is selected as the representative of the cluster. Then, this individual is evaluated by the original tness function and its properties, i.e. its rst m natural frequencies and the values of maximum interstory drift ratio under FE and MCE hazard level ground motions, are stored in an archive. In this way, all the individuals that are evaluated by the original tness function from the start of the optimization process, are stored in the archive. Next, the tness of all the remaining individuals are evaluated by the meta-models that are trained using the data stored in the archive.
Since the present problem is a multi-objective optimization problem, the solutions on the Pareto front may dier signicantly with each other. Consequently, the trained network with these widely ranged input data has low precision in estimating the response or even may generate completely wrong answers. As much as the input data of GRNN are similar, its estimate of the response to an arbitrary solution is more accurate [29]. In order to improve the quality of the approximations, in the present study, a concept of active data selection is applied. In this approach, in order to evaluate the tness of all the remaining individuals in a cluster, rst, a membership grade is calculated for each solution stored in the archive to see the grade it belongs to that particular cluster. The membership grade of the ith solution stored in the archive, i.e. xi, for the nth cluster is obtained by:
!n(xi) = P 1 k j=1
d(centern;xi)
d(centerj;xi)
2; (6)
where k is the total number of clusters and d(centern; xi) denotes the Euclidean distance between
the center of the nth cluster and xi in the natural
frequency space. !n(xi) is a value between 0 and 1,
in which higher values denote that xi is more closer to
the center of the nth cluster and lower values show that xi may not belong to the nth cluster.
When the membership grades are computed for the whole archive, then p solutions with the highest grades are selected from the archive and a new GRNN is constructed and trained by these similar accurate solutions. Finally, the trained network is used for estimating the tness of all remaining individuals in the
nth cluster. In this way, only one GRNN is constructed and trained for each cluster, which is eective for time eciency improvement of the solution algorithm. It should be noted that the value of p should be determined in a way that, rst, the trained network should be able to estimate the response precisely; second, the network should not be over trained. In this study, the total number of clusters, k, the number natural frequencies stored in the archive, m, and the number of solutions used for training the network, p, are set to 0.1 number of osprings generated at each generation, 10, and 30, respectively.
6. Wavelet analysis
Wavelet analysis is an advanced mathematical set of tools and techniques for signal-processing, which has aroused great attention in many elds of science and engineering. By wavelet decomposition, we can denoise a signal from high-frequency components to understand the behavior of the primary signal better. The theory and methods of wavelet analysis are widely available in literature. In this paper, only its application in our specic problem is explained; the interested reader may refer to [32] for further information.
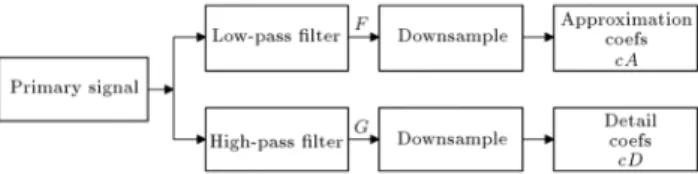
Wavelet transform is exploited for dividing data, functions and signals into dierent frequency compo-nents, where each of them is studied with a resolution matched to their scale [15]. Wavelet transform can be simply attained by a tree of lter banks as shown in Figure 1. In this gure, \downsampling" is an operation that keeps the even indexed elements of the input signal. The key scheme for lter banks is to cut up a signal into two parts; the rst is the low-frequency and the other is the high-frequency part. This scheme is achieved by a set of lters (a low- and a high-pass lter), which separate a signal into dierent frequency bands. The low-pass lter removes the high-frequency bands of the signal and produces an approximate description of the primary signal. By utilizing the high-pass lter, the low-frequency components of the signal are removed, and a signal including the details of the main signal is achieved [16]. In other words, by constructing a lter bank with these two lters, the primary signal is separated into an approximation and a detail signal. Output of the lter bank is two sets of coecients, (cA) and (cD), that include the low- and high-frequency contents of the main signal,
Figure 1. General algorithm for discrete wavelet transforms.
respectively. In Figure 1, the length of each lter is equal to 2N that N is the order of the wavelet function used as the lter. If n be the length of the primary signal, the signals F and G are of length n+2N 1. And then the coecients cA and cD are of length equals to oor n 1
2
+ N, almost half of the primary signal length [33].
Response of a structure under a given ground motion is mostly aected by the low-frequency con-tent of the earthquake record. This concon-tent can be eciently used in time-history analysis, as a surrogate for the original earthquake record, in order to decrease the number of points that are involved in the time-history loading and subsequently reduce the compu-tational demand of time-history analysis [15]. The decomposition process can be repeated for the low-frequency content to achieve the desired scale of the earthquake record. This multilevel decomposition is called the wavelet decomposition tree [16]. In this study, the decomposition process proceeds in three levels, see Figure 2, i.e. the approximate version of the earthquake record in the last step (cA3) is utilized in
the analysis. Therefore, the number of points involved is decreased to 0.125 of the primary record. It should be noted that when cA3is applied for the analysis, the
time-step needs to be updated by: dt = dt length(xg)
length(cA3): (7)
In the present problem, wavelet decomposition process is needed to be performed once before the start of the optimization procedure. In the phase of preparing the input data, the wavelet decomposition tree produces a surrogate record for the target ground motion time history; then, this record is used in all time-history analyses of the procedure instead of the original earth-quake record. Based on the results of our previous study [8], Daubechies wavelet function (Db2) is selected to operate as the lter and decompose the earthquake record. In order to verify the eciency of the proposed three-level wavelet decomposition method, 100 models for the structure of the numerical study were generated randomly and analyzed subjected to both the surrogate and the primary record. The mean value of the errors in estimating the drift ratios, using the surrogate record,
Figure 2. A three-level wavelet decomposition of earthquake record xg(t).
was 0.0328, calculated by the RRMSE measure, while the analysis time for this record was approximately 1/8 of that required by the primary record. These values conrm that by implementing the developed wavelet decomposition method, considerable improvement in computational eort will be achieved at the expense of only a small loss of accuracy.
7. The proposed framework
Now, all of the introduced components in the previ-ous sections are incorporated in a simple framework, which makes it feasible to perform the performance-based multi-objective optimal design of steel moment-frame structures. In this problem, all constraints are classied into two main groups:
Initial constraints: The constraints of this group are fullled by modifying the given solution. These con-straints are: (1) Column-beam moment ratio shall be satised at beam-to-column connections, based on the AISC seismic provisions [34]. This condition is checked at each joint, and if it is not fullled, the section number of the columns connecting to the joint is increased one number and then it is checked again. This procedure continues until all joints fulll this constraint. (2) Lower columns should have the same or larger section number than the upper columns. This constraint is checked from the last story and gradually modies the section of columns in order to satisfy this constraint. (3) The structure should be checked for the design strength following AISC-LRFD specications [17]. If the strength ratio of each member of structure is more than one, then its section number is increased by one; this process continues until all members fulll this constraint. The equivalent lateral force procedure of ASCE-7 [23] is considered for earthquake loading. Accord-ing to the ASCE-7, the seismic load combination is 1:2D + 1:0L + 1:0E, where D and L represent dead load and transient live load, and E represents earthquake load.
Final constraints: This group contains checking of the requirements specied in Section 2.2 for the performance evaluation. Based on FEMA-350 [5], in order to verify the acceptance criteria for the desired structural performance, the following load combi-nation shall be used to evaluate seismic demands, 1:0D + 0:25L + 1:0E2=50(E50=50), where E2=50 and
E10=50 represent earthquake eects at MCE and
FE hazard levels, respectively. For this group, the constraint violation is reported by a factor that guides the optimization process as mentioned in Section 3.2.
The main procedure, which is based on the NSGA-II algorithm, is as follows. The relevant section
to some steps are noted in brackets: Main procedure f
1. Set parameters.
2. Initialize the population.
2.1 Generate a random individual.
2.2 Evaluate the new individual.
3. Sort the initial population based on non-domination and calculate crowding distances.
4. Until termination criterion met.
4.1 Select parents using binary tournament selec-tion.
4.2 Generate osprings by performing crossover and mutation operators (Section 3.1).
4.2.1 Generate all the individuals. For each new individual do
4.2.1.1 Perform a modal analysis,
4.2.1.2 Compute the initial cost,
4.2.1.3 Check the initial constraints (Section 8).
4.2.2 Perform FCM clustering algorithm and cluster the individuals into k clusters (Section 5.2).
4.2.3 Perform evolution control strategy (Sec-tion 5.2).
4.3 Form an intermediate population from merging the current population with the osprings.
4.4 Sort the intermediate population based on non-domination and calculate crowding distances.
4.5 Perform replacement on the intermediate pop-ulation to determine the new poppop-ulation. g.
The rst step is done as follows: Set parameters f
1. Set the NSGA-II user dened parameters, e.g. population size, number of osprings, number of generations, etc.
2. Select the input parameters required for structural modeling, analysis and design procedure.
3. Generate an articial earthquake record matched to the MCE response spectrum (Section 2.1).
4. Dene eective duration of the articial earthquake record (Section 2.1)
5. Perform the wavelet decomposition method for the eective duration and generate a surrogate record (Section 6).
Evaluation of the new individual is obtained by: Evaluate f
1. Model the structure of the problem.
2. Perform two nonlinear time-history analyses under FE and MCE hazard level ground motions, respec-tively (Section 2).
3. Check the nal constraints (Section 7).
4. Compute the lifetime seismic damage cost (Section 4).
5. Store the new individual to the archive (natural frequencies, tness values, the factor representing amount of constraint violation).
g.
And, evolution control is performed as: Evolution control strategy f
1. For each cluster do
1.1 Find the representative individual, i.e. the individual with highest membership garde.
1.2 Evaluate the representative individual.
1.3 Calculate the membership grade for each solu-tion stored in the archive.
1.4 Select p solutions with the highest grades from the archive.
1.5 Train a GRNN with these selected solutions.
1.6 For each remaining individuals do
1.6.1 Estimate the output parameters by the trained GRNN.
1.6.2 Compute the lifetime seismic damage costs (Section 4).
g.
8. Numerical study
A computer program is developed by coding the proposed framework in MATLAB® [33] in which structural analysis is done by the combination of MATLAB® and OpenSees®. Actually, rst, the required data for analysis of the structure, including structural modeling and loading, are provided by MAT-LAB® and then by the use of these data, OpenSees® performs the analysis. Two dierent models are used in this study for analyzing the given structure. In the rst part of the analysis, an elastic model of the structure is constructed using \elastic Beam Column" element of OpenSees®, and then a linear static analysis is performed to nd the design strength of structural components under the LRFD load combination. In the second part, a nonlinear model of the structure is constructed with \elastic BeamColumn" elements
connected by \zeroLength" elements of OpenSees® that serve as rotational springs. The rotational springs capture the nonlinear behavior of the frame consistent with the concentrated plasticity concept. The rota-tional behavior of the plastic hinges follows a bilinear hysteretic response based on the modied Ibarra-Krawinkler deterioration model. Detailed information about this model and the modes of deterioration it sim-ulates can be found in [35,36]. In this study, the input parameters for the rotational behavior of the plastic hinges are determined using empirical relationships developed by Lignos and Krawinkler [36], which are derived from an extensive database of steel component tests. For the sake of simplicity, in this paper, cyclic deterioration is ignored in studying the nonlinear be-havior of the structures. Then, OpenSees® performs two nonlinear time-history analyses to calculate the drift ratios under MCE and FE hazard level ground motions. To model structural damping, Rayleigh damping model of OpenSees® is applied by assuming the damping ratio of 5% for the rst and second modes of free vibration of the structure. For FCM clustering, constructing the GRNNs and wavelet decomposition of the given earthquake record, fuzzy logic, neural network and wavelet toolboxes of MATLAB® are employed, respectively.
In what follows, a test problem is presented and solved using the developed program. The structure considered is a 2D ve-bay, ten-story steel moment-frame as shown in Figure 3. The nite element model of the frame consists of 110 members and in total 180 degrees of freedom. The columns and the beams are grouped into 13 sets, each corresponding to an independent design variable. The geometric characteristics and the group members are also shown in Figure 3. All members of the structure have I-shaped cross-sections, which are selected from a database of 129 W-sections, containing 23 W1000, 22 W920, 13 W840, 17 W690, 18 W530, 36 W360 sections. Details of these standard W-sections are available in the manuals of the American Institute of Steel Construction. It should be noted that this frame is designed as a special moment-frame based on the requirements specied in AISC seismic provisions [34].
The modulus of elasticity is equal to 2.1e6 kg/cm2
and the yield stress of steel is 2400 kg/cm2. The
frame is assumed to have rigid connections and xed supports. The permanent load is considered to be D = 400 kg/m2 and the transient live load is taken as L =
250 kg/m2. The gravity loads are contributed from an
eective area of 250 m2. The joint masses are computed
by the MATLAB® and is given as input data to OpenSees®. The load combination for computing joint masses from gravity loads is 1:0D + 0:2L. In distributing the gravity loads, it is assumed that all loads are distributed uniformly between all joints, while
Figure 3. A ten-story steel moment-frame structure: geometry and member grouping.
Figure 4. Loma Prieta ground motion (station: Gilroy Array #7, 1989): (a) Original record; (b) MCE response spectrum matched articial record; (c) articial record in the eective duration; and (d) scaled ltered record for MCE hazard level. the contribution of the outer joints in each oor is half
as much as the inner joints. In addition to the gravity loads, the self-weight of each element is divided into two equal mass portions and added to the mass of the each end joint.
The Loma Prieta ground motion, see Figure 4(a), is processed to be subjected to the frame in the horizontal direction. Details of this earthquake record
are available in the PEER Strong Motion database [37]. This real ground motion is adjusted and scaled using SeismoArtif® to generate an articial record matched to the 5% damped response spectrum of MCE ground motions for the Los Angeles area, California. The generated articial record is shown in Figure 4(b). The type of soil prole is assumed to be C in this example. The eective duration of the articial record,
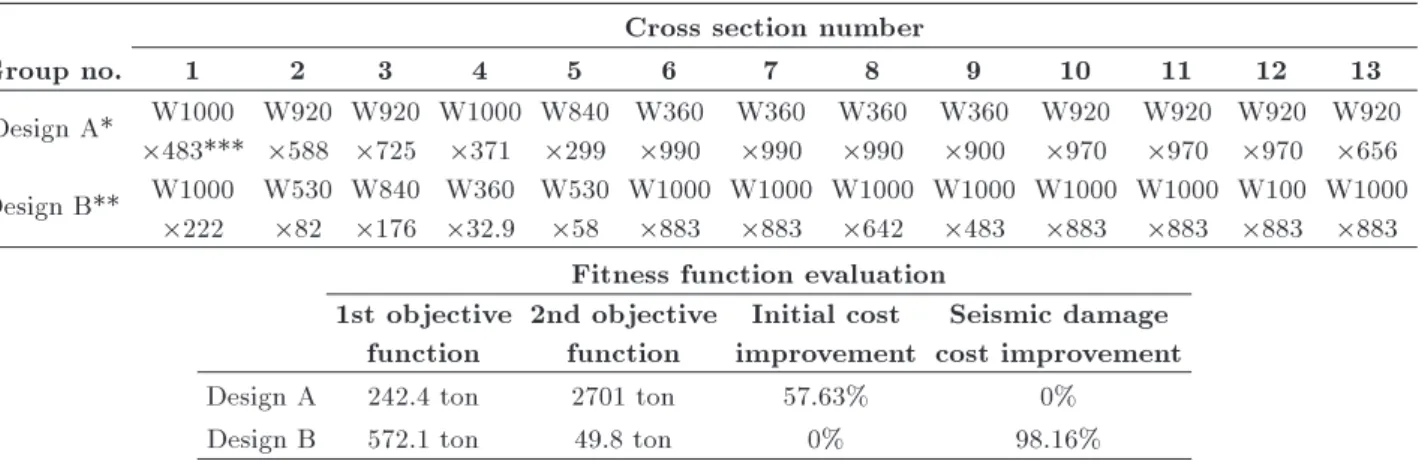
Table 2. Properties of two characteristic designs of the reported frame. Cross section number
Group no. 1 2 3 4 5 6 7 8 9 10 11 12 13
Design A* W1000 483***
W920 588
W920 725
W1000 371
W840 299
W360 990
W360 990
W360 990
W360 900
W920 970
W920 970
W920 970
W920 656 Design B** W1000
222
W530 82
W840 176
W360 32.9
W530 58
W1000 883
W1000 883
W1000 642
W1000 483
W1000 883
W1000 883
W100 883
W1000 883 Fitness function evaluation
1st objective function
2nd objective function
Initial cost improvement
Seismic damage cost improvement
Design A 242.4 ton 2701 ton 57.63% 0%
Design B 572.1 ton 49.8 ton 0% 98.16%
Indicates the design with minimum initial cost;
Indicates the design with minimum seismic damage cost; Units are in SI system.
Figure 5. Obtained Pareto fronts in three dierent runs for the reported frame.
calculated by SeismoSignal®, stops at second 17.5, which leads to 3500 points with a time step of 0.005, sec Figure 4(c). Implementation of the Db2 function for wavelet decomposition reduces the number of points to 440 with a time step of 0.0398 sec as displayed in Figure 4(d). This ltered record is a surrogate for the articial record that is used instead of it throughout the optimization.
Because of the stochastic nature of the solution algorithm, this problem was solved for three times. The obtained Pareto front curves are shown in Figure 5 for the seismic damage cost against the initial material cost (total weight of structural components). These Pareto fronts demonstrate the rank-1 solutions obtained at the last generation of the NSGA-II algorithm for each run of the program. Because seismic damage cost is dened as a ratio of initial cost, both values are in tons. In this example, a population of 200 individuals is em-ployed for optimization process and the main algorithm performs 250 generations. The total computing time
required for solving this multi-objective optimization problem by the developed program was approximately 14 hours using an Intel®CoreTMi7@2:0 GHz processor
equipped with 8 GBs of RAM. It is observed that this algorithm needs 25,000 tness function evaluation, in which around 1/8 of them are evaluated by the original tness function and others are estimated by the meta-model. It should be noted that without use of the employed meta-model, the solution process requires about 180 hours, and without the proposed three-level wavelet decomposition, it would have required roughly eight times more time.
In order to compare the properties of the dierent optimal designs achieved in the shown Pareto fronts, two characteristic designs are investigated. These designs are the extreme points corresponded to the single-objective optimal designs where minimization of the initial material cost and the seismic damage cost are the objective functions, respectively. The properties of these two designs are listed in Table 2. As is presented, while the initial material cost of design B compared to design A is increased by 57%, the corresponding seismic damage cost is decreased by 98%. The value of the factor computed for the designs A and B is 11.143 and 0.087, respectively.
9. Conclusions
A frame work, in accordance with FEMA-350 regu-lations, has been proposed for the performance-based multi-objective optimal design of steel moment-frame structures using a nonlinear dynamic analysis proce-dure. Minimization of life-cycle costs have been consid-ered by treating the initial cost and the seismic damage cost as two separate objectives of the optimization problem. Obtaining the Pareto front of the possible optimal designs of a structure for these objectives provides invaluable economical information that helps
investors or insurance companies to make the best decisions. This problem is more involved specically in large-scale construction projects. It should be noted that in the present study, we have tried to consider all the relevant constraints included in the guidelines and practical matters in a way that the results can be useful for all practical engineers in real-life projects.
In this paper, the NSGA-II genetic algorithm has been operated as the optimization algorithm enhanced by using a DE and a polynomial mutation operator. In order to employ more appropriate record compatible with the seismic characterization of the site, the given real earthquake record has been adjusted and scaled to generate an articial record matched to the target response spectrum of the site. Heavy computational demand is the main drawback in applying the nonlinear dynamic procedures. Two major remedies have been implemented to tackle this problem. Firstly, a WA has been applied to decrease the number of involved acceleration points of the given ground motion time-history up to 0.125 of its eective duration through a three-level wavelet decomposition process. By using the ltered record instead of the primary record, the solution algorithm would have required eight times less computation time. Secondly, a tness approximation strategy has been employed for predicting the time-history response of structures. For this purpose, the GRNN has been operated as the meta-model and a specic evolution control scheme has been developed. In this scheme, in order to determine which individuals should be evaluated using the original tness function and which by the meta-model, the Fuzzy C-Mean (FCM) clustering algorithm has been used to choose the competent individuals rather than choosing the individuals randomly. This approach guarantees a faster and correct convergence of the evolutionary algorithm.
A computer program has been developed based on the proposed frame work and operated for the design of a ten-story steel moment-frame structure. It has been demonstrated that by the use of this framework, a considerable improvement in computational eort can be achieved, besides providing a convenient Pareto fronts of possible optimal solutions. Also, the obtained results conrm that optimal design of similar structural problems can be performed for larger structures within acceptable amount of computational time.
References
1. Foley, C.M., Pezeshk, S. and Alimoradi, A. \Prob-abilistic performance-based optimal design of steel moment-resisting frames I: Formulations", J. Struct. Eng., 133(6), pp. 767-776 (2007).
2. Liu, M., Burns, S.A. and Wen, Y.K. \Optimal seismic design of steel frame buildings based on life cycle cost
considerations", Earthq. Eng. Struct. Dyn., 32(9), pp. 1313-1332 (2003).
3. Kaveh, A., Laknejadi, K. and Alinejad, B. \Performance-based multi-objective optimization of large steel structures", Acta Mech., 223(2), pp. 355-369 (2011).
4. Liu, M, Burns, S.A. and Wen Y.K. \Multiobjective optimization for performance-based seismic design of steel moment frame structures", Earthq. Eng. Struct. Dyn., 34(3), pp. 289-306 (2005).
5. FEMA-350 Recommended Seismic Design Criteria for New Steel Moment-Frame Buildings, Federal Emer-gency Management AEmer-gency, Washington (2000).
6. Wen, Y.K. and Kang, Y.J. \Minimum building life-cycle cost design criteria", J. Struct. Eng., 127(3), pp. 338-346 (2001).
7. Fragiadakis, M., Lagaros, N.D. and Papadrakakis, M. \Performance-based multiobjective optimum design of steel structures considering life-cycle cost", Struct. Multidiscip. Optim., 32(1), pp. 1-11 (2006).
8. Kaveh, A., Fahimi-Farzam, M. and Kalateh-Ahani, M. \Time-history analysis based optimal design of space trusses: The CMA evolution strategy approach using GRNN and WA", Struct. Eng. Mech., 44(3), pp. 379-403 (2012).
9. Ganzerli, S., Pantelides, C.P. and Reaveley, L.D. \Performance-based design using structural optimiza-tion", Earthq. Eng. Struct., 29(11), pp. 1677-1690 (2000).
10. Foley, C.M. \Optimized performance-based design for buildings", Recent Advances in Optimal Structural Design (Chapter 8). Burns SA (Ed.), ASCE (2002).
11. Alimoradi, A., Pezeshk, S. and Foley, C.M. \Prob-abilistic performance-based optimal design of steel moment-resisting frames II: Applications", J. Struct. Eng., 133(6), pp. 757-766 (2007).
12. Deb, K., Pratap, A., Agarwal, S. and Meyarivan, T. \A fast and elitist multi objective genetic algorithm: NSGA-II", IEEE Trans. Evol. Comput., 6(2), pp. 182-197 (2002).
13. Salajegheh, E., Gholizadeh, S. and Khatibinia, M. \Optimal design of structures for earthquake loads by a hybrid RBF-BPSO method", Earthq. Eng. Eng. Vib., 7(1), pp. 13-24 (2008).
14. Gholizadeh, S. and Salajegheh, E. \Optimal design of structures subjected to time history loading by swarm intelligence and an advanced meta-model", Comput. Meth. Appl. Mech. Eng., 198(37-40), pp. 2936-2949 (2009).
15. Salajegheh, E. and Heidari, A. \Time history dynamic analysis of structures using lter banks and wavelet transforms", Comput. Struct., 83(1), pp. 53-68 (2005).
16. Gholizadeh, S. and Samavati, O.A. \Structural opti-mization by wavelet transforms and neural networks", Appl. Math. Model, 35(2), pp. 915-929 (2011).
17. AISC-LRFD Specication for Structural Steel Build-ings (ANSI/AISC 360-10). American Institute of Steel Construction, Chicago (2010).
18. OpenSees, Open System for Earthquake Engineer-ing, Pacic Earthquake Engineering Research Center, Berkeley. Available at http://opensees.berkeley.edu (2001).
19. FEMA-273, NEHRP Guidelines for the Seismic Reha-bilitation of Building, Federal Emergency Management Agency, Washington (1997).
20. SeismoArtif, Earthquake Engineering Software Solu-tions, SeismoSoft Inc. Available at http://www.se-ismosoft.com/en/SeismoArtif.aspx (2002).
21. Towhata, I. Geotechnical Earthquake Engineering, Springer, Berlin (2008).
22. SeismoSignal, Earthquake Engineering Software Solu-tions, SeismoSoft Inc. Available at http://www.sei-smosoft.com/en/SeismoSignal.aspx (2002).
23. ASCE-7, Minimum Design Loads for Buildings and other Structures (ASCE/SEI 7-10), American Society of Civil Engineers, Virginia (2010).
24. Deb, K., Multi-Objective Optimization Using Evolu-tionary Algorithms, Wiley, New York (2009).
25. Talbi, E.G., Metaheuristics: From Design to Imple-mentation, Wiley, New Jersey (2009).
26. Coello, C.A.C., Pulido, G.T. and Lechuga, M.S. \Handling multiple objectives with particle swarm optimization", IEEE Trans Evol. Comput., 8(3), pp. 256-279 (2004).
27. Papadrakakis, M. and Lagaros, N.D. \Soft computing methodologies for structural optimization", Appl. Soft Comput., 3(3), pp. 283-300 (2003).
28. Jin, Y. \A Comprehensive survey of tness approxima-tion in evoluapproxima-tionary computaapproxima-tion", Soft Comp., 9(1), pp. 3-12 (2005).
29. Buhmann, M.D. and Ablowitz, M.J., Radial Basis Functions: Theory and Implementations, Cambridge University Press, Cambridge (2003).
30. Jin, Y. and Sendho, B. \Reducing tness evalua-tions using clustering techniques and neural network ensembles", Genetic and Evolutionary Computation (GECCO). Lecture Notes in Computer Science, 3102, pp. 688-699 (2004).
31. Miyamoto, S., Ichihashi, H. and Honda, K., Algorithms for Fuzzy Clustering: Methods in c-Means Clustering with Applications, Springer, Berlin (2008).
32. Strang, G. and Nguyen, T. Wavelets and Filter Banks, Cambridge Press, Wellesley (1996).
33. MATLAB, The Language of Technical Computing, Math Works Inc. Available at http://www.mathwor-ks.com/products/matlab (1984).
34. AISC Seismic Provisions for Structural Steel Buildings (ANSI/AISC 341-10), American Institute of Steel Construction, Chicago (2010).
35. Ibarra, L.F. and Krawinkler, H. \Global collapse of frame structures under seismic excitations", Rep No TB 152. The John A. Blume Earthquake Engineering Center, Stanford Univ., Stanford, CA (2005).
36. Lignos, D.G. and Krawinkler, H. \Deterioration mod-eling of steel beams and columns in support to collapse prediction of steel moment frames", J. Struct. Eng., 137(11), pp. 1291-1302 (2011).
37. PEER Strong motion database. Pacic Earthquake Engineering Research Center. Available at http://pe-er.berkeley.edu/peer ground motion database (2010).
Biographies
Ali Kaveh was born in 1948 in Tabriz, Iran. After graduation from the Department of Civil Engineering at the University of Tabriz in 1969, he continued his studies on Structures at Imperial College of Science and Technology at London University, and received his MS, DIC and PhD degrees in 1970 and 1974, respectively. He then joined the Iran University of Science and Technology in Tehran where he is presently Professor of Structural Engineering. Professor Kaveh is the author of 400 papers published in international journals and 150 papers presented at international conferences. He has authored 23 books in Farsi and 7 books in English published by Wiley, the American Mechanical Society, Research Studies Press, and Springer.
Mazyar Fahimi Farzam was born in 1984 in Ker-manshah, Iran. He obtained his BS degree in Civil Engineering from Iran University of Science and Tech-nology in 2006, and his MS degree in Structural Engineering from Sharif University of Technology, in 2009. He is currently a PhD degree candidate at Iran University of Science and Technology. His research interests include: optimum design of structures con-sidering dynamic loadings via meta-heuristic methods. Mohsen Kalateh Ahani was born in 1985 in Mash-had, Iran. He obtained his BS degree in Civil Engineer-ing from Mashhad Islamic Azad University in 2005, and his MS degree in Structural Engineering, in 2009, from Iran University of Science and Technology, where he is currently a PhD degree candidate. His research inter-ests include: multi-objective optimal seismic design of skeletal structures.