ISSN: 2252-8938, DOI: 10.11591/ijai.v9.i3.pp497-506 497
Intelligent cluster connectionist recommender system using
implicit graph friendship algorithm for social networks
Arnold Adimabua Ojugo, Debby Oghenevwede Otakore
Department of Mathematics/Computer Science, Federal University of Petroleum Resources Effurun, Delta State Nigeria
Article Info ABSTRACT
Article history: Received Jan 26, 2020 Revised Mar 20, 2020 Accepted Apr 12, 2020
Implicit clusters are formed as a result of the many interactions between users and their contacts. Online social platforms today provide special link-types that allows effective communication. Thus, many users can hardly categorize their contacts into groups such as “family”, “friends” etc. However, such contact clusters are easily represented via implicit graphs. This has arisen the need to analyze users’ implicit social graph and enable automatic add/delete of contacts from and unto a user’s group through a suggestion algorithm. This will make the group creation process dynamic (instead of static, where users manually add and/or remove users on their contact list). The study implements the friend suggest algorithm, which analyzes a user’s implicit social graph to create custom contact group using an interaction-based metric to estimate a user’s affinity to his contacts and groups. Algorithm starts with a small seed-set of contacts – already categorized by the user as friends/groups; And, then suggest other contacts to be added to a group. The result inherent demonstrates the importance of both the implicit group relationships and the interaction-based affinity in suggesting friends.
Keywords: Cluster
Ego-centric networks Implicit contact Recommender Social graphs Tie-strenght
This is an open access article under the CC BY-SA license.
Corresponding Author: Arnold Adimabua Ojugo,
Department of Mathematics/Computer Science, Federal University of Petroleum Resources Effurun, Delta State, Nigeria.
+2348034072248 / +2348120800233
Email: [email protected], [email protected], [email protected]
1. INTRODUCTION
The main benefit of communication (online over offline) is that they validate communication amongst a cluster of people, rather than restrict communication to be peer-to-peer. Email allows support for group conversations as well as the sharing of other feats such as photo, links and collaborative document [1]. Despite the prevalence of group communication, users do not often spend time to create and maintain custom contact groups. A survey of mobile phones users in Europe showed that only 16% of users created such custom contact [2]. Various social sites and networks seem to provide users with exclusive relationship and link types with their contacts. Thus, it is common practice that some users will identify others as friends – even when they do not practically know or trust them. Treating all contacts in same manner, not differentiating one user from another is unsafe and restrictive practice, since users need some time to share data and interact with members of their personal (social) networks. Many users have quit many groups/social platforms when their family, friends, superiors or subordinates are online [3].
The most common means of modelling relationship on social networks is via graphs. A graph is a symbolic representation of a network and of its connectivity. It is an abstraction of reality, simplified as a set
of linked vertices or nodes. Mathematically, a graph is a set of vertex V, connected by edges E, and denoted as G = (V, E). Graph origin can be traced to Leonhard Euler’s problem of the “Seven bridges of Konigberg” in 1735. The problem addressed a user who crossed all the bridges only once, in a continuous sequence. It has since then been modified with various improvements [4-5]. A social graph seeks to interconnect users via relationships on a social (usually online) network [6]. Social graphs are a discrete graph containing vertices called users and its edges describes relationships between these entities [7-8]. A social network determines the relationship between entities by their means of interaction and its recency.
Literature Review: The Mathematics of Social Graphs
Graphs have become the dominant life-form of many tasks. It advances the study of graphs and its applications as successfully applied to many disciplines [7]. A graph has vertices connected together by edges to yield system that represents interactions for the task. Social graphs consist of vertices representing actors or agents; while, edges represent weighted relationships shared between these actors. Thus, graph analysis studies nodal relationships via the formation of node clusters as it effects the system. A powerful role of graphs (as networks) is to bridge local feats that exist in nodes as they blossoms into patterns that helps explain how nodes and their corresponding edges impacts a complex effect that ripple via the graph [9-10]. A graph is graphically represented as network of nodes, and mathematically denoted as G = (V,E,w) – where v represents a set of vertices (nodes, actors, agents), E represents the set of links/relations and arcs; while, (optional) w represents weights of each node. Each node i V has a set of ties m E that is either self-linked, single-linked or multi-linked. The links are either weak or strong stressing the social relationship between such nodes as measured via dyads D [11].
There are two kinds of social graph namely in the light of social discuss namely: explicit and implicit graph relationship. The implicit graph describes an interaction between users, their contacts and group of contacts. It defines a graph whose vertices are not represented as explicit data objects in memory; But rather, are determined algorithmically from some more concise inputs. It is also a graph whose edges are weighed by feats such as frequency, recency, and direction of interaction between users and their contacts and their group of contacts. They are used to identify clusters of contacts who form groups that are meaningful and useful to each user [1]. Conversely, explicit graphs are such that two-individuals deliberately and mutually describe their connection with one another. Thus, such graphs can be mined more easily, since they begin with hard data, and not algorithms that will be hard for competitors to replicate in the future. It is best understood as truly personal and social [12]. Thus, explicit graphs are rare and examples include Facebook and LinkedIn.
Generally, groups change dynamically as new users are added to multi-party communication threads; while, others are also removed. Thus, a person’s individual relationship dynamically evolve and changes over time as a friend becomes one’s family, a colleague becomes a friend, a friend becomes a colleague etc. The need to consistently update all the relationships a user has with his/her contacts, require constant maintenance. This is quite tedious and time consuming [3]. Previous studies have used many models – and at the frontier of these is the friend suggest algorithm, which assists users in creation of custom contacts that are either implicit or explicit.
Traversing contacts on a social graphs
Graph binds nodes together through a predefined model so that a researcher can effectively analyze its entities along some theories to explain the observed patterns within [13-16]. Thus, it helps to propagate local feats present in nodes that eventually emerge as global patterns. It examine dynamics in relationship between nodes as well as helps to locate all the influential entities within such a network – as it theoretically, allows connection convergence of nodes [11]. A powerful role of graph is to bridge local underlying features as they blossoms into global network patterns. Thereby, explaining how simple nodal relationships impact on complex effect, which eventually ripples throughout the network cum population system. Each node, shapes the graph’s evolution as the need arises. Thus, social graphs aim at two goals namely: (a) better understand how networks evolve, and (b) study dependent social processes like innovation diffusion and data retrieval via models to specify how local interaction of agents’ feats are explored to a global pattern [5, 8, 11].
The implicit friendship suggest algorithm
Extending [1] based on graph theories in [8], we explore the friend suggest algorithm, which probes the presence of implicit clustering in a user’s egocentric network observing groups of contacts who are frequently present as co–recipients in same email threads. FSA functions within the egocentric network – to suggest based only on user’s local data so as to protect user privacy and avoid exposing connections between the user’s contacts that may not otherwise have been identified to him. Inputs to the FSA is a seedset (one or more contacts that belong to a particular group) – and is characterized by the user picking a few
contacts. Given this, the FSA finds the contacts in the user’s egocentric network that are related to the seed (contacts present in the same implicit cluster). Friends suggest also returns a score for each suggested contact, indicating the goodness of its fit to the existing seed. The FSA is applicable to problems of group clustering in which the interaction is based on social graph.
2. MATERIALS AND METHODS
2.1. Statement of problem
The following problems are to be addressed:
1. Manual creation of groups from user contacts is quite time consuming as the user must deliberately identify clusters from his/her contact list so as to create the required groups.
2. The dynamic nature of social groups especially with the addition, deletion and amending of relationships etc, users often manually handle such updates of custom groups.
3. Study seeks to tackle the above problem by using an implicit social graph via a friends suggest algorithm. The study seeks to implement a friend suggest algorithm via the implicit social graph model that will automatically help users create custom contact in their phonebook. This will intelligently help users eliminate time spent to manually create their custom contact graph. Specific goals includes: (a) to describe an interaction-based metric for estimating a user’s affinity to his contacts and groups [17], (b) implement the friend suggestion algorithm via a user’s implicit social graph and thus, generate a friend group, given a small seed set of contacts which the user’s has already categorized as friends and also to suggest friends to expand the seed set of that group, and (c) demonstrate the importance of both the implicit group relationship and the interaction- based affinity ranking in suggesting friends [18].
2.2. Data gathering
The study uses the Enron Email Corpus Dataset to implement the Friend Suggest Algorithm (FSA). It is a large collection of email messages of the Enron Corporation, collected in Houston in 2002 by Joe Barting, to analyze contractors of Aspen, whom the Federal Energy Regulatory Commission hired to preserve vast amounts of data collected during the legal investigation of the Enron accounting fraud in December 2001. It contains over 600,000 messages from 150 users [19-20]. For the study, we adopt single user (i.e. an employee) email address – since we seek a user’ egocentric network. Each employee folder in the dataset, has other email folders for incoming and outgoing messages. Our chosen employee is Shackleton Sara (chosen based on a balance in the number of incoming and outgoing messages) as shown in Figure 1. The rationale for the adoption of the dataset used, is based on (a) standard email for social network analysis, (b) dataset explores the benefits and tie-strength of users, and (c) the dataset incorporates the various components metrics to be measured for the friend suggest algorithm. Dataset is obtained from [web]: http://www.cs.cmu.edu.
Figure 1. Chosen employee Shackleton Sara with incoming and outgoing messages
3. RESEARCH METHOD
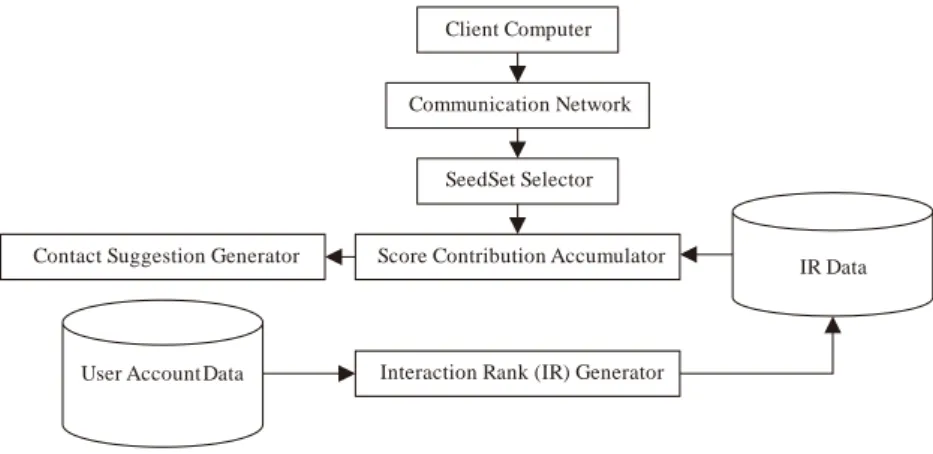
The general architecture of the proposed implemented system, are coupled graph theories modeled on [8, 21-25] with a view to extend [1] as in Figure 2:
1. Client Computer – is any device through which a user can submit services request to and receive messaging services or other services from the server system. Examples are PCs, mobile devices, mobile phones etc.
2. Communication Network is any wired/wireless local area network and/or wide area network or its combination.
3. SeedSet Selector – seeks to select one or more contacts from the data set (subset) as the seed set. 4. Score Contribution Accumulator – is for generating scores for contacts in the group of contacts, the seed
set is sent to the score contribution accumulator which uses data from the user account data-store (e.g. group of contacts) who were recipients or senders of messages to generate score for each of the contacts in the group of contacts.
5. Contact Suggestion Generator generates suggested contacts based on the generated score data. It includes a contact_add suggest function for suggesting contacts to add to messages and a contact_remove suggest function to suggest contacts to remove. It receives all the generated scores to generate suggestions including contacts from the group of contacts.
6. User Account Database – stores user data (messages) that are associated with user account(s) contact data for contacts associated with the user account(s) and generated score data generated by the score contribution accumulator.
7. Interaction Rank Generator – generate values that are indicative of the importance of a group of contacts to user.
8. Interaction Rank Database – stores interaction rank score data generated by the Interaction Rank Generator. The score contribution accumulator weighs the score contribution of each group of contacts to the generated score for a contact.
Client Computer
Communication Network
SeedSet Selector
Score Contribution Accumulator Contact Suggestion Generator
Interaction Rank (IR) Generator User Account Data
IR Data
Figure 2. General architecture of the friend suggest algorithm
3.1. The interaction rank (IR)
IR is computed by summing the number of emails exchanged between a user and a particular implicit group, weighing each email interaction as a function of its recency. Interaction weight decays rapidly over time with half-life λ tunable parameter. IR can be tuned with 𝜔𝑜𝑢𝑡 which is the relative importance of outgoing versus incoming emails. Thus, we compute using (1) as a set of email interactions given by I = {Iout, Iin} as:
𝐼𝑅 = 𝜔𝑜𝑢𝑡∑ ( 1 2) 𝑖∈𝐼𝑜𝑢𝑡
𝑡𝑛𝑜𝑤−𝑡(𝑖) 𝜆
+ ∑ (1 2)
𝑡𝑛𝑜𝑤−𝑡(𝑖𝑛) 𝜆
𝑖𝜖𝐼𝑖𝑛 (1)
Iout set of outgoing interactions between a user and a group. Iin set of incoming interactions.
tnow is the current time.
t (i) is the timestamp of the interaction i ϵ I.
λ (half-life) determines speed at which an interaction’s importance decays
𝜔𝑜𝑢𝑡is the weights that determines relative importance of outgoing interactions versus the incoming interaction
From (1), each interaction from the current time has an input of 𝟏
𝟐 to a group’s IR; whereas, an interaction from one half life λ ago subsidizes and so on. IR is associated to the recency metric proposed by [17]. Thus, IR computes the weight of each interaction based on the timestamp; whereas, the recency groups interactions as consecutive direction weighed by exponentially decomposing the scale at which they interact over their ordinal rank. Thus, recency does not take into justification the direction of each interaction. In furtherance, [18] augmented with an edge-weight metric that deliberates the role of the interaction users; But, does not take into account the time of the interaction. IR do not easily allow for assessments across several users. For example, an active user, who sends and receives many emails per day, will have overall higher IR for his implicit groups when compared to a relatively inactive user. Thus, a user's egocentric network has that IR allows for a clean ordering of the user's implicit groups by estimated relationship strength.
3.2. The core routine
It is the core algorithm for suggesting contacts that expands a particular seed-set, given a user's contact groups. It is thus:
Function EXPANDSEED (u, s) Input: u, the user
S, the seed
Returns: Ƒ, the friend suggestions Ԍ ← GETGROUP (u)
Ƒ ← ∅
For each group g ∈ Ԍ; For each contact c ∈ g, c ∉ s If c ∉ Ƒ
F[c] ← 0
Ƒ[c] ←UPDATESCORE(c, S, g)
The EXPANDSEED function takes as inputs a user, u, who is the mailbox owner of a single egocentric network in the implicit social graph, and a seed S consisting of a set of contacts that make up the group to be expanded. EXPANDSEED returns a set of suggested friends F that maps each suggested contact to a score. Each contact's score shows the algorithm's prediction for how well the given contact expands the seed, in comparison to the other contacts in the user’s network. Not all contacts from a user’s network is guaranteed to be returned in F. Friend suggestions are computed as follows: The user's egocentric network is extracted from the implicit social graph. The social graph G, is a set of contact groups, where each group g ϵ G is a set of contacts with whom u has exchanged emails. Each group g has an IR indicating the strength of a user’s connection to the group g. Thus, the goal of EXPANDSEED is to find, among all the contacts in G, those whose interactions with the user are most similar to the user’s interactions with the contacts in the seed S.
The EXPANDSEED function iterates over each group g in G, computing a score for each contact C that is a member of g. The algorithm does not suggest contacts that are already members of the seed S. Scores for each contact are computed iteratively via a helper function, UPDATESCORE, which takes the contact being considered, the contact's score so far, F[c], the seed S, and the group g. In the following section, we discuss several possible scoring heuristics that were considered for UPDATESCORE.
3.3. The scoring function
The Update_Score is a function pattern that takes a single contact c, from a user's egocentric network, and an implicit group g to which c belongs, and returns an incremental score based on the group’s (g) connection to the seed group S. The sum of Update_Score for a contact c covers all of the implicit groups to which it (c) belongs. Thus, it is an evaluation of c's suitability to expand the seed – since both the implicit groups creating up a user’s egocentric network as well as seed group inputted to the Friend Suggest Algorithm, are unordered sets of contacts (which can be compared via standard measures of set connection). However, we choose for this study – a set member intersection to yield the various versions of the Update_Score Function, leaving more composite metrics for future survey.
The Intersecting Group Score – Implements Update_Score function that sums the scores of all of the groups to which that belongs, for groups that have a non-empty intersection with the seed. The algorithm is as thus:
Function Intersect_Group_Score (c, s, g) Input: c, a single contact
S is the seed being expanded g, a single contact group
Returns: g’s contribution to c’s store If g ∩ S ≠∅
return IR(g) Else; return 0
Intuitively, Intersect_Group_Score finds all contexts in which the contact c exchanged emails (or is co-recipient) with at least one seed group member. But, larger intersections between the members of the seed group and the members of a given implicit group, will seems to indicate a higher degree of similarity.
The Intersect Weighted Score implements the Update_Score and sums the scores of all groups with a non-empty intersection with the seed, weighted by the size of the intersection and a constant k. The larger intersection between the members of the seed group and the members of a given implicit group, is used to generate a larger contribution to the score for each non-seed member of the implicit group.
Function Intersect_Weighted_Score (c, S, g):
Input: c, a single contact S is the seed being expanded g, a single contact group
Returns: g’s contribution to c’s score return IR(g) X k|g ∩ s|
Intersecting Group Count – implements an Update_Score function that counts the number of groups to which a contact belongs, and for groups that have a non-empty intersection with the seed. Thus, the routine counts the number of groups a contact c belongs to, that have some intersection with the seed S. This metric ignores the Interactions Rank entirely, and treats all implicit groups as having equal value to the user. It also notes the importance of using a seed of contacts to characterize a distinct friend group. And so, we compare its values to the Update_Score instantiation, which ignores the seed and always suggests the top-ranked contacts. Contact ranks are computed by summing the Interactions Ranks of implicit group containing each contact. In each metric, the final friend suggestion scores are normalized with respect to the highest-ranked contact, so that a single threshold can be used across all users, to cut off the list of suggested contacts. The algorithm is as thus:
Function Intersect_Group_Count (c, S, g) Input: c, a single contact
S is the seed being expanded g, a single contact group
Returns: g’s contribution to c’s score if g ∩ S ≠∅
return 1 else; return 0
Top Contact Score - This function implements Update_Score routine that seeks to computes the Interactions Rank of a single contact by summing the scores of all of the groups to which that contact belongs. The algorithm is as thus:
Function Top_Contact_Score (c, S, g); Input: c, a single contact
S is the seed being expanded g, a single contact group
Returns: an updated rank for the contact C return IR(g)
The system identifies, in historical communications in a user account associated with the user, one or more groups of contacts (e.g., each group of contacts is a group of one or more contacts associated with a particular communication). System generates scores for contacts in identified groups including generating a contact score for a respective contact by accumulating score contributions for a plurality of the identified groups of contacts that includes respective contact (e.g., using Top_Contact_Score function). The system
identifies one or more suggested contacts in accordance with the generated scores (e.g., identifying the contacts that have the top ten scores as calculated using the Top_Contact_Score function). After identifying the suggested contacts, system sends contact suggestion based on suggested contacts for display to the user. Wherein the contact suggestion includes suggested contact with a score above defined threshold (e.g., system sends a list of “top contacts” to the user).
Suggesting Contacts to Remove – The algorithm also replace and suggest contacts to remove from a draft message, email or communication – by suggesting removal of a first contact and addition of a second contact that is similar to the first contact. With the Remove_Contact algorithm based on user’s egocentric network, system checks to know and ensure if the removal an existing recipients of an implicit group, creates a group with a higher score than the one formed by the existing recipient set.
Function Remove_Contact (U, L) Input: U is the set,
L, a list of the recipients of an email, Returns: a pair {c,s} where, c is a contact c ∈ L
S is a suggested contact to replace Scoremax ← 0
WrongRecipient← null, SuggestedContact← null, for each contact G ∈ L; Seed ← L\Ci
results← EXPANDSEED (u, seed) if G ∈ results
continue
for each contact g ∈ results
if ISSIMILAR(Ci, Cj) and Score (Cj) > Scoremax Scoremax ← Score(Cj)
WrongRecipient ← Ci SuggestedContact ← Cj
return {WrongRecipient, suggestedContact}
Initially, the system sets the Interactions Rank (if any) for the current recipients of an email as a maximum score. It then, for each contact ci in the current recipient list L, Remove_Contact builds a
respective seed-set that includes all of the members of L except ci. For each respective seed-set, system
determines an Interactions Rank (if any) for the seed set. And, if Interactions Rank for the seed set is greater than the current maximum score, the Interactions Rank of the seed set is then set as the current maximum score – so that, the contact c that was removed from the current recipient list L is set as the WrongRecipient. Thus, the system determines a highest Interactions Rank between the IR of the current recipients, and respective Interactions Ranks for each possible set of contacts that is generated by removing a single contact from the current recipients list L. Furthermore, the WrongRecipient list is returned and sent to the client as a suggestion for a contact to remove from the communication.
4. RESULT, DISCUSSION AND FINDINGS 4.1. Summary output
Tables 1 and 2 shows the interaction rank (i.e. edge weights) between the user and its corresponding contact groups. Only the edge weights of twenty one (21) groups out of 3360 groups of Shackleton Sara email was documented. Tables 1 and 2 posits that as recency weight decay values reduce slowly, it yields an increase in the importance of interaction. Thus, the speed decay is quite slow – thereby, given the interaction rank between the user and the group much edge weight. Conversely, an increase in the value of the recency weight decay will reduce the result values since the interaction importance is very far thereby the speed decay of the interaction importance will be very fast; While, Figure 3 shows the user contact grouping in relation to their tie-strenght.
Table 1. The first iteration of the interaction rank (continue) Number Items Description
1 Duration 244.44445157051086seconds 2 Dataset Size 81984bytes 3 No. of Groups 3360 4 User Contacts 4031
Table 1. The first iteration of the interaction rank Number Items Description
6 Top 10 suggested contacts: '[email protected]', 0.06405193866939196) '[email protected]', 0.026278877886120558), '[email protected]', 0.02329351241372869), '[email protected]', 0.02329351241372869), '[email protected]', 0.021633515524249993), '[email protected]', 0.02091075922286739, '[email protected]', 0.02091075922286739), '[email protected]', 0.02091075922286739), '[email protected]', 0.02091075922286739), '[email protected]', 0.02091075922286739)] 7 Suggested Contacts Remove '[email protected]', '[email protected]',
'[email protected]', '[email protected]', '[email protected]', '[email protected]',
Table 2. Tie-strenght on the time of adoption of the interaction rank
No Dependent Variables 1 How long have you known contact and
when was last communication?
(Duration)
0.67 0.94
2 How strong is the relationship? (Intensity)
0.47 0.87 3 Recency in communication, relationship
status and how would you feel if unfriended by him/her? (Intimacy)
0.23 0.42
4 How many mutual friends do you share the same interest (interest overlap) and how many clusters do you both belong to
in-common? (Structural Distance)
0.43 0.90
Figure 3. Contact grouping using the user’s tie-strength
4.2. The edge weight output
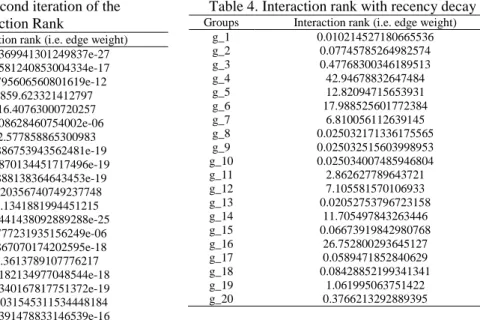
Tables 3-6 respectively shows the IR (i.e. weights of edges) between the user and its corresponding implicit contact groups. Only the edge weights of twenty (20) groups out of 3360 groups of Shackleton Sara email was documented. Table 3 shows the Interaction Rank between user and groups at initialization. Table 4 shows change in result value as recency weight decay with other parameters constant. Recency weight decay determines speed at which an interaction’s importance fades.
Table 3. The second iteration of the Interaction Rank
Groups Interaction rank (i.e. edge weight) g_1 1.2369941301249837e-27 g_2 1.4581240853004334e-17 g_3 3.795606560801619e-12 g_4 859.623321412797 g_5 16.40763000720257 g_6 4.08628460754002e-06 g_7 2.577858865300983 g_8 1.886753943562481e-19 g_9 1.8870134451717496e-19 g_10 1.888138364643453e-19 g_11 0.20356740749237748 g_12 0.1341881994451215 g_13 1.3441438092889288e-25 g_14 8.777231935156249e-06 g_15 4.867070174202595e-18 g_16 0.3613789107776217 g_17 3.8182134977048544e-18 g_18 2.1340167817751372e-19 g_19 0.0031545311534448184 g_20 1.2391478833146539e-16
Table 4. Interaction rank with recency decay Groups Interaction rank (i.e. edge weight)
g_1 0.010214527180665536 g_2 0.07745785264982574 g_3 0.47768300346189513 g_4 42.94678832647484 g_5 12.82094715653931 g_6 17.988525601772384 g_7 6.810056112639145 g_8 0.025032171336175565 g_9 0.025032515603998953 g_10 0.025034007485946804 g_11 2.862627789643721 g_12 7.105581570106933 g_13 0.02052753796723158 g_14 11.705497843263446 g_15 0.06673919842980768 g_16 26.752800293645127 g_17 0.0589471852840629 g_18 0.08428852199341341 g_19 1.061995063751422 g_20 0.3766213292889395
37%
26% 13%
24%
Contact Grouping Via Tie-Strenght Parameters
duration intensity recency distance
Table 5 differs from Table 6 respectively due to corresponding change in value of ω_out and the other parameter which is the recency weight decay remains constant. Note, ω_out determines relative importance of the outgoing interaction versus incoming interaction. Thus, result above shows that as the value of ω_out increases, the edge weight also increases; Conversely, as ω_out decreases, the edge weight decreases – because the outgoing interaction weighs more than incoming interaction exchanged between the user and the group.
Table 5. Interaction rank with seedset selection Groups Interaction rank (i.e. edge weight)
g_1 1.0766170049291842e-06 g_2 0.00025153412070963254 g_3 0.006488425379659979 g_4 50.83140009329234 g_5 8.739776529476192 g_6 1.0810931334504166 g_7 5.640150870557931 g_8 5.257660901734844e-05 g_9 5.2578416753202264e-05 g_10 5.258625099350079e-05 g_11 1.8075805124270892 g_12 4.109196947777688 g_13 4.055707172038824e-06 g_14 0.9914703752667318 g_15 0.0001426623046362585 g_16 14.917195513480008 g_17 0.0001640580746608868 g_18 8.483164322396609e-05 g_19 0.5978591481394719 g_20 0.0008763801356722921
Table 6. Interaction rank with recency decay after seedset selection
Groups Interaction rank (i.e. edge weight) g_1 5.741957359622315e-06 g_2 0.0013415153104513735 g_3 0.03460493535818655 g_4 220.28795044232317 g_5 31.349939392274624 g_6 5.242697543941164 g_7 25.029879909017364 g_8 0.00028040858142585836 g_9 0.0002804182226837454 g_10 0.0002804600052986709 g_11 9.639369600175685 g_12 17.047318284321694 g_13 2.163043825087373e-05 g_14 5.076590920883843 g_15 0.0005603816092023162 g_16 77.05650596468963 g_17 0.0008749763981913962 g_18 0.0004524354305278192 g_19 3.188582123410517 g_20 0.004224265376231064
5. CONCLUSION
There has to be effective communication between two entities for an effective relationship. For this to happen, both persons have to be in constant communication. One means in which this can happen is through a social platform such as link editing, photo sharing, and email communication and so on. The FSA helps to connect relationship using an implicit social graph. We detailed the software architecture and its operations. Thus, the FSA is used to generate a friend’s group, given a small seed set of labelled contacts as already categorized by the user as friends, colleagues groups; It then also suggest contacts to expand the seed-set. The FSA comprise of the implicit groups created by the user, in the user’s egocentric network. The Email data-set used was the Enron Corpus Email dataset and used to determine the interaction rank (edge weight) between a user and his group of contacts. We further describe the benefits and strengths of the FSA by testing its many components. The system was able to determine the edge weight between the user and its group of contacts and also suggested contacts to the user in order to expand the seed set using the various update score functions.
REFERENCES
[1] M. Roth., T. Barenhoiz., A. Ben-David., D. Deutscher., G. Flysher., A. Hassidim., I. Horn., A. Leichtberg., N. Leiser., Y. Matias., R. Meron., Suggesting friend via friends suggest algorithm using implicit social graph, 43(2): pp123, 2010
[2] M. Kuhn., M. Wirz., R. Grob., R. Wattenhofer., Cluestr mobile social networking for enhanced group communication, Proc. of the ACM Internal conference on supporting Group Work, pp81-90, 2009
[3] E. Raad., R. Chbeir., A. Dipanda., Discovering relationship types between users using profiles and shared photos on a social network, 2009
[4] J-P, Rodrigue., The geography of transport systems, 2017, New-York
[5] A.A. Ojugo., I.P. Okobah., Prevalence rate of hepatitis-B virus infection in Niger Delta using graph-based diffusion model, Int. J. of Computer Application, 179(39): pp27-33, 2017
[6] A.G. Michaelson., The development of a scientific specialty as diffusion through social relations: The case of role analysis, Social Networks, 15, p217-236, 1993.
[7] S.K. Pathapati., S. Venugopalan., A.P. Kumar., A. Bhamidipaty., People and entity retrieval in implicit social networks, IBM Research, 2011, Bangalore, India: IBM research
[8] A.A. Ojugo., F. Aghware., R.E. Yoro., M.O. Yerokun., A.O. Eboka., C. Anujeonye., F. Efozia., Predicting behavioral evolution diffusion on a graph model, Advances in Networks, 3(2): pp8-21, 2015.
[9] A.A. Ojugo., D. Allenotor., D.A. Oyemade., A stochastic model face detection, Advances in Multidisciplinary Scientific Res. J., 2(5), pp101-114, 2015.
[10] A.A. Ojugo, E. Ben-Iwhiwhu, E., Kekeje, D.O., Yerokun, M.O., I.J. Iyawa., Malware propagation on time varying network, Int. J. Modern Edu. Comp. Sci., 8, pp25-33, 2014.
[11] A.A. Ojugo, A.A., Aghware, F.O., Yoro, R.E., Yerokun, M.O., Eboka, A.O., Anujeonye, C.N., F. Efozia., Predicting the behavioral evolution on a graph-based model, Advances in Networks, 3(2): pp8-21, 2015
[12] M. Sherman., Implicit vs explicit social graph. 2011, Retrieved Aug. 4, 2018, [web]: http://clipperhouse.com [13] M. Granovetter., Economic action and social structure: The problem of embeddedness, American J. Sociology,
91(3):p481-510, 1985. doi:10.1086/228311.
[14] R.E. Yoro., Ojugo, A.A., Quest for prevalence rate of Hepatitis-B Virus infection in Nigeria: comparative study of supervised versus unsupervised model, American J. of Modeling and Optimization, 4(3): pp79-90, 2019.
[15] K. Gilbert., Karahalios, K., Y. Dresden., TheNetwork in the Garden: An Empirical Analysis of Social Media in Rural Life, Proceedings of CHI, p1603-1612, 2008.
[16] E. Gilbert., K. Karahalois., Predicting tie strengths with social media, J. Computer and Human Interface, 15, p76-97, 2009. ACM 978-1-60558-246-7/09/04.
[17] V.R. Carvalho, W.W. Cohen., Ranking users for intelligent message addressing, In Proceedings of the 30th European conference on IR Research (ECIR), Klimt, B., Yang, Y., (2014). Introduction to Enron Corpus. Lnguage Technology Institute, Carnegie Mellon University, pittsburgh, USA.
[18] I-H. Ting., H.J. Wu., P.S. Chang., Analyzing multi source social data for extracting and mining social networks,
Proceedings of the international conderence on computational Science and Engineering. 2009,
[19] A.A. Ojugo et al, Hybrid model for early diabetes diagnosis, Mathematics and Computers in Science and Industry 2015, 50: 176-182, ISBN: 978‐1‐61804‐327‐6, ISSN: 2227‐4588
[20] A.A. Ojugo., A.O. Eboka., Intelligent hunting profile for evolvable metamorphic malware, African J. of Computing and Information Communication Technology, 8(1-2): pp181-190, 2015.
[21] M. Rouse., Social graph, 2007, retrieved August 5, 2018 [web]: http://whatis.tecttarget.com/definition/social-graph [22] R. Toivonen, R., Kovanena, L., Kiveläa, M., Onnela, J.K., Saramäkia, J., K. Kaskia., A comparative study ofsocial
networks models: network evolution and nodal attributes models, Social Networks, 2009, 31, p240-254, doi:10.1016/j.socnet.2009.06.004.
[23] T.W. Valente., Social network thresholds in thediffusion of innovation, Social Networks, 18, p69-89, 1996. SSDI 0378-8733(95)00256
[24] S. Wasserman., K. Faust., Social Network Analysis: Methods and Applications, Cambridge University Press, p1-27, ISBN 97805213870-71, 1994
[25] A.G. Michaelson., The development of a scientificspecialty as diffusion through social relations: The case of role analysis, Social Networks, 15, p217-236, 1993.
BIOGRAPHIES OF AUTHORS
Arnold Adimabua Ojugo received BSc in Computer Science from the Imo State University Owerri in 2000, MSc in Computer Science from the Nnamdi Azikiwe University Awka in 2005, and PhD in Computer Science from Ebonyi State University Abakiliki in 2013. He currently lectures with the Department of Mathematics/Computer Science of the Federal University of Petroleum Resources Effurun, Delta State, Nigeria. His research interests: Intelligent Systems and Control, High Performance and Dynamic Computing, Machine-Learning, Computer Vision, Ubiquitous Computing, Data Security and Forensics. He is an Editor with the Progress for Intelligent Computation and Application, Advancement for Scientific and Engineering Research and SciencePG (ACIS, AJNC, NET and WCMC Journals). He is a member of: The Nigerian Computer Society, Computer Professionals of Nigeria and International Association of Engineers (IAENG).
Debby Oghenevwede Otakore received BSc and MSc in Computer Science from Benson Idahosa University Edo State and The University of Port-Harcourt in 2008 and 2015 respectively. She is currently undergoing her Doctoral Studies in the same Computer Science, also at the University of Port-Harcourt, Nigeria. She currently lectures with Department of Mathematics/Computer Science of the Federal University of Petroleum Resources Effurun, Delta State, Nigeria. Her research interests: Recommender and Intelligent Systems. She is a member of: The Nigerian Computer Society.