Journal of Electrical Engineering, Electronics, Control and Computer Science
JEEECCS, Volume 2, Issue 6, pages 15-20, 2016
Energy Efficiency Management for
Metalworking Manufactured
Mariana IORGULESCU
University of Pitesti, Electrical Engineering Departament Pitesti, Romania
Abstract: This paper present the problematics of energy efficiency improving in metalworking manufactured based on energy management. Energy management has the goal to maximize energy efficiency. This purpose involve the systematic application of techniques and procedures developed and improved over the last years. In a first stoe, the action is to analyse the energy consumption. In the subsequent phase, in charge of energy at the perimeter analysed take the lead and directs actions seeking energy saving target.
There are introduced some aspects to obtain improving an efficiency energy by few procedures incuding the replacement of energy consumers by the perspective of energy management. Is important to obtain a new value of energy consume, smaller than before the study, with the same value of products and the same quality.
Keywords: energy efficiency, metalworking, management
I. INTRODUCTION
Increased energy efficiency in a production capacity, which are carried out a profitable activity in an organized manner, it is a requirement that lead from the need generalize, the activity maximum benefit to the person who have invested money to start them. The production capacity represents the analysed contour in energetic sense.
Energy costs, also known-energy bill-as a generic name, constitute a part of total expenditure involved to smooth away of the work performed inside contour analysis. These costs represents all the financial effort for the purchase and/or production inside the countour of all forms of energy required in manufacturing processes of the final products. Reduce their value lead to decrease the total costs, helps to increase the profits obtained.[1],[2]
It is generally considered that an activity is more energy efficient that the energy losses inventoried at inside of contours which it operates that are smaller.
Energy costs represent an important element in the structure cost of the majority products resulting from production processes. Reducing energy consumption leads finally lowering production costs and implicit the product competitiveness increase on the market.[3]
Increasing energy efficiency in an industrial application requires to apply with conviction, consistency and professionalism techniques and procedures of the energy management.[4]
Energy management in consumer follows capitalizing maximum energy efficiency entrances in
various forms in an organized way in the given contour.
Proper application of procedures of energy management requires knowledge in depth and specificity activities that are monitoring, including each of the flows of energy that have entered into and emerged from contour and establishing links between them, also.[5],[6]
Analysis of energy efficiency in a given contour begins by specifying the criteria quantitative and qualitative power supply of activities in contour respectively:[7]
Determination of the nature of energy carriers entering the contour of the balance sheet;
Determining the order of magnitude of consumption for each category energy carrier.
The main measures the energy efficiency of industrial processes are:[8]
• continuous monitoring of energy consumption and technological parameters systems measuring and control performance;
• retrofitting of old production lines with new technologies, clean, low-input energy and high productivity;
• automation of industrial processes;
• reduce heat loss in soil, air and the environment; • reutilisation secondary energy resources by using
them primarily processes technology;
• heat production equipment performance, emissions and fuel low exhaust;
• preparing contracts for electricity supply at advantageous tariffs according to hourly load curves;
• efficient lighting installations and providing quality lighting at places work, depending on specific requirements processes;
• sizing motors in accordance with required load and using modern devices, control and adjustment of power motors;
• create local cogeneration installations for simultaneous energy production electrical and heating costs low.
manufactured from economical point of view first, and then consumes of different energies in the production process. Section V presents a case study on the energy management in the metalworking manufactured. Finally, the conclusion gives a brief summary of the energy management.
II. METALWORKING MANUFACTURED
PRESENTATION
The company analysed in this study is a small company with based activity in metal working manufactured. The products of company are in domains like: steel buildings, industrial scales, components for cranes.
Figure 1 Evolution of production 2013-2015 period
Figure 2 Evolution of turnover 2013-2015 period
Figure 3 Evolution of productivity in 2013-2015 period
It is observed that the production’s evolution has an ascedent trend but, the productivity decreased because
the number of employments increased since 2013. The turnover evolution has the good evolution.
III. DESCRIPTION OF ENERGY CONSUME CONTOUR
The energy consumers are represent in principal by the manufacturing equipments, heating and ligting sources. Production hall are organized in a few production workshops.
Production workshops are: • mechanical workshop • pressing workshop • welding workshop • cutting workshop • joint workshop
The economic operator has a single block measuring electricity for the production hall and the administrative building.
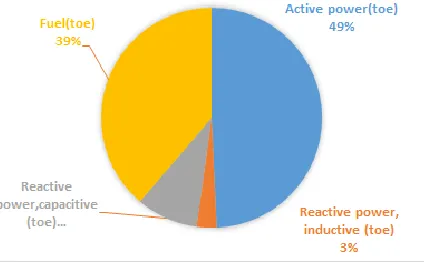
The annual quantities of electricity consumption, respectiv of active, reactive inductive, reactive capacitive and fuels are shown in figure 4.
Figure 4 Structure of energy consume
The main share in the structure of energy consumption is the active energy with 49% of total energy consumption and reactive but notice that has a high proportion, particularly capacitive reactive energy. Also, the fuell consumption has an important value, 39% of total energy consumption.
3.1 Description of the evolution of energy consumption
The types of energy consumption are presented in figures 5, 6,7 and 8.
3.1.1 Electrical energy
Figure 5 Evolution of electricity consumption active, reactive inductive and capacitive in one year
Monthly electricity consumption of the economic operator is not constant depending on the production level and the outside temperature.
Figure 6 Monthly evolution of electricity consumption
Figure 7 Evolution of energy -reactive inductive consume
Figure 8 Evolution of reactive energy -capacitive consume in the years 2015
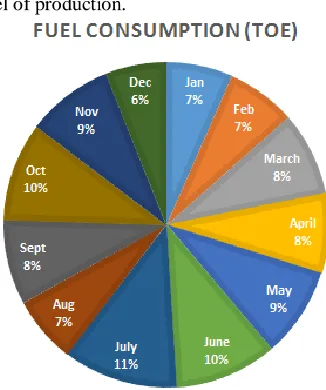
3.1.2 Fuel consume
Fuell consume are presented in figure 9, the bigger consume are in July and June giving in consideration the level of production.
Figure 9 Monthly consume of fuell
Consumers fuel vehicles are passenger and freight transport.
3.2 Energy efficiency, specific consumption
The energy efficiency of energy use depends on the metallic, primarily sorto-types and sizes of manufactured products, technical equipment and not least the involvement of management in optimizing energy consumption by applying energy recovery solutions.
Figure 10 Evolution energy efficiency of electricity-active energy
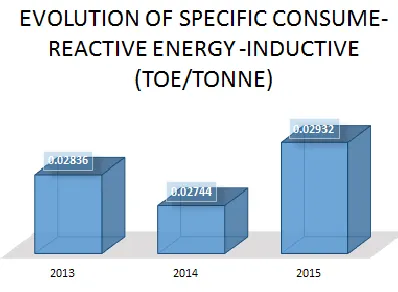
Figure 11 Evolution of specific consume of reactive energy-inductive
Figure 12 Evolution of specific consume of fuell
IV. ENERGY MANAGEMENT
The economic operator is small, having no requirement under law, to perform energy audits did not carry out such an audit. However attaches great importance to energy efficiency takeing the follows measure:
• lowering energy consumption are a priority for this; • has a responsible with energy consumptions and so
on;
• conducting periodic reviews of the machines so that they operate optimally without additional energy consumption;
• descent lighting in production halls by replacing other high performance lamps in terms of energy consumption;
• replacing old machines with new ones with higher energy efficiency.
Within the company are recorded all costs including energy consumption. All staff have access to specialized information on energy efficiency.
There are communication inside the company between technologists and specialists in charge of energy so that energy resources are used efficiently.
Company management has tried to reduce consumption per tonne of product by a coherent investment and in accordance with the new EU rules so you get quality products at low cost and more competitive.
In the economic operator, through its management, are constantly looking for new ways to save electricity.
Machine operators are trained and monitored so that machinery to be operated in optimal conditions and with cost saving, reduce their operating times in regime-load operation.[9]
Monthly reports are prepared for all expenses incurred spare parts, labor and other expenses of maintenance of machinery. The company has an integrated management system and ERP technology.
Periodically do awareness campaigns for employees to save various forms of energy.
If investments are selected equipment, especially depending on the efficiency and the ability to recover the investment in a short time.
V. CASE STUDY
5.1. Objectives
After conducting analysis of electricity bills and the process technology, solutions identified have resulted in a plan of action some of them are:
• replacement heating plant with heat pump; • capacitive reactive energy compensation; • optimal power factor compensation; • the operation of variable speed motors;
The study aims specifically:
• Reducing electricity consumption by replacing heating plant used for industriale spaces heating and offices with a heat pump.
• Reducing power losses by using reactive capacitive reactance coils.
5.2. Technical data
To determine electricity recovered is necesar to use the data from bills electricity from one year.
- Electricity is capacitive reactive: 20034 kVArh / year
The amount of energy recovered is dependent on the achieved production direct proportional and is modifying with operating conditions of machines.
5.3. The installation of reactive power compensation
Given the loss of power capacitive reactive energy data there are two options:
• The first is to reconfigure cables switching power supply machinery;
• Second is to compensate energy entering the electrical circuit reactance.
Reconfiguring coupling power supply cables can lead to significant reduction of capacitive reactive energy bill payment and amortization immediate investment. It is a simple solution that does not require an investment important but which may contribute signicantly improve economic efficiency.
If the first option does not have the expected results the second consists of using coils reactors calculated from the amount of capacitive reactive power to be compensated.
5.4. The current situation of power supply hall
Due to increased capacitive reactive energy losses represent losses due to cable length cables on the one hand, and on the other hand due cabling works on the hall walls or metal- columns of the hall.
Another factor which led to increased capacitive reactive power is the great length of cables by installing them from the general electrical panel to ceiling and lowering them to the machines.
It appeared on an increase capacitive reactive power supplied by the capacitor mounted to compensate power factor as is required by the operator of electricity distribution.
Inductive reactive power compensation is achieved with a battery of capacitors totaling 130 kVAr. The first level of compensation is 2.5 kVAr.
A cable presents a complex system of capacities, referred to as partial capacities, among the various metal conductors and between each conductor and the element taken as reference potential, which can be the metal sheath and/or the external environment. For this reason, the apparent capacity of a cable depends on the type of construction of the cable, the presence of the screens, the material from which the reinforcement is made and the result of combining the partial capacity.
Capacitive reactive power is presented in equation 1.
[ ] (1)
Where,
-B0 is susceptance of cable;
-U is rated voltage.
Capacitive reactive energy consumption is due to the wiring cables. This consumption does not depend on the load but depends on the square of voltage and has two big disadvantages:
• increases the value of electrical energy bill; • increases the value of voltage in cable.
The equipment of power factor compensation will operate in an automate mode so, always follow capacitive reactive energy consumption.
When designing equipment will take into account the reactive energy consumption last year and some technical considerations such as:
- limit the growing tension on bars connection of the reactors, less than 3%;
-technical characteristics and inductance of the coils;
- breaking power of contactors;
-transient maximum current to the battery connection (which should be supported and breakers of the existing cells);
- setting protections.
Capacitive reactive power to be compensated is between limits:
-Qcmin = 4 kVAr
-Qcmax = 20 kVAr
As a consequence, there would be an offset in stoes starting by using a total of five coils 4 kVAr. Power factor is: cos= 0.92 considered neutral.
5.5 Energy recovered
Energy recovery is estimated about:
2.15 toe/year by replacement heating plant with heat pump;
1.6 toe/year capacitive reactive, given the adjustment in compensation of the installation stoes
Figure 14 Energy savings achieved after the proposed measures
After the energy efficiency management program was applied the metalworking manufactured has a 3.75 toe/year energy recovered.
CONCLUSION
The economic operator results in an energy saving are 25% of the total electricity used.
National Agengy of Energy has a requirement in legislation regarding target to reduce the energy consume with 20% until 2020. The metalworking manufactured, with a small consume has a role in targeting this country objective.
REFERENCES
[1] Stamatios Christopoulos, Cansu Demir, Michael Kull,”Cross-sectoral coordination for sustainable solutions in Croatia: The (meta) governance of energy efficiency, Energy Policy 99 (2016) 57–87, http://dx.doi.org/10.1016/j.enpol.2016.09.010
[2] Mike Schulze, Sven Heidenreich,”Linking energy-related strategic flexibility and energy efficiency.The mediate Figure 15ng role of management control systems choice “,Journal of Cleaner Production 140 (2017) 1504-1513 http://dx.doi.org/10.1016/j.jclepro.2016.09.231
[3] Svensson A, Paramonova S, An analytical model for identifying and addressing energy efficiency improvement opportunities in industrial production systems – model development and testing experiences from Sweden, Journal of Cleaner Production (2016), doi: 10.1016/ j.jclepro.2016.11.034.
[4] Ming-Jia Li, Wen-Quan Tao, Review of methodologies and polices for evaluation of energy efficiency in high energy-consuming industry, Applied Energy,Volume 187, 1 February 2017,Page:203;215,http://dx.doi.org/10.1016/j.apenergy.2016. 11.039
[5] Mirjana Stameni; Nikola Tanasi; Tomislav Simonovi,”Energy management system for energy efficiency improvement in the industrial sector of the republic of Serbia 2016”, 4th International Symposium on Environmental Friendly Energies and Applications (EFEA) Year: 2016, Pages: 1 - 4, DOI: 10.1109/EFEA.2016.7748821 ,IEEE Conference Publications [6] F. Tinazzi; M. Zigliotto; A. Boglietti; A. Cavagnino; M.
Cossale,Energy efficiency assessment for inverter-fed induction motors,8th IET International Conference on Power Electronics, Machines and Drives (PEMD 2016),Year: 2016,Pages: 1 - 6, DOI: 10.1049/cp.2016.0356,IET Conference Publications
[7] Cristian RĂDUCANU Roxana PĂTRAŞCU,Eduard MINCIUC”Bilanturi termoenergetice”,Bucuresti 2004 [8] Stefan GADOLA, Florin Radu POP, Vasile GRASIN,Dorin
BEU,Georgeta PÃDUREANU, Florin Mircea POP”Principii modern de management energetic” EnergoBit,2005