WAVELET ANALYSIS AND NEURAL NETWORK CLASSIFIERS TO
DETECT MID-SAGITTAL SECTIONS FOR NUCHAL TRANSLUCENCY
MEASUREMENT
G
IUSEPPAS
CIORTINO1,E
MANUELAO
RLANDI2,C
ESAREV
ALENTI1 ANDD
OMENICOT
EGOLOB
,1,3,41Dipartimento di Matematica e Informatica, Universit`a degli Studi di Palermo, Italy;2Azienda Ospedaliera
Universitaria, Policlinico Paolo Giaccone di Palermo, Italy;3Centro Interdipartimentale di Tecnologie della Conoscenza, Universit`a degli Studi di Palermo, Italy;4Mediterranean Center for Human Health Advanced Biotechnologies, Universit`a degli Studi di Palermo, Italy
e-mail:{emanuela.orlandi, giuseppa.sciortino04, domenico.tegolo, cesare.valenti}@unipa.it (Received June 10, 2015; revised September 16, 2015; accepted February 1, 2016)
ABSTRACT
We propose a methodology to support the physician in the automatic identification of mid-sagittal sections of the fetus in ultrasound videos acquired during the first trimester of pregnancy. A good mid-sagittal section is a key requirement to make the correct measurement of nuchal translucency which is one of the main marker for screening of chromosomal defects such as trisomy 13, 18 and 21. NT measurement is beyond the scope of this article. The proposed methodology is mainly based on wavelet analysis and neural network classifiers to detect the jawbone and on radial symmetry analysis to detect the choroid plexus. Those steps allow to identify the frames which represent correct mid-sagittal sections to be processed. The performance of the proposed methodology was analyzed on 3000 random frames uniformly extracted from 10 real clinical ultrasound videos. With respect to a ground-truth provided by an expert physician, we obtained a true positive, a true negative and a balanced accuracy equal to 87.26%, 94.98% and 91.12% respectively.
Keywords: mid-sagittal section, neural network, nuchal translucency, symmetry transform, wavelet analysis.
INTRODUCTION
Until the 80’s amniocentesis (i.e., analysis of the amniotic liquid) and chorionic villus sampling were the only real tests for prenatal diagnosis of genetic disorders. Although technically advanced and reliable, these tests are invasive, expose the fetus to non-negligible risks (e.g., an increased probability of miscarriage between 0.5% and 1%) and must be performed late during the gestation (not before the fourteenth and the eleventh weeks, respectively).
Late in the 80s, a non-invasive screening protocol was introduced that takes into account also the concentration of various fetoplacental products in the maternal blood. The combination of maternal age, thickness of the nuchal translucency (NT) by ultrasound equipments and maternal serum biochemistry (in particular, free b-hCG and PAPP-A) in the first trimester usually allows to identify about 85%-90% of fetuses affected by the Down’s syndrome. For this reason NT was originally proposed to foresee the probability of a fetus with Down’s syndrome (Hyett et al., 1996; Onyeacholemet al., 2015).
During the diagnosis phase, the role and the experience of the physician are of crucial importance. In general the measurements during the first trimester
of pregnancy are not automated involve not merely a single organ but the entire human being due to the uncertainty of the fetus position. For example, it may happen that the physician must act maneuvers to stimulate the fetus to assume a proper position for the measurement of nuchal translucency.
One of the main aims of the Fetal Medicine Foundation (FMF) is to characterize and to standardize the measurement of nuchal translucency, useful also to detect heart and great arteries abnormalities and other genetic disorders as Edwards syndrome (trisomy 18), Palau (trisomy 13) and Turner syndrome. FMF introduced an education process to certify, to help and to establish high standards of scanning. Since the reliability of the clinical examination depends also on the quality of mid-sagittal sections, which are done by hand, a “certificate of competence in ultrasound” can be acquired by sonographers able to perform high standard scans and that can prove a good knowledge in diagnosis. In the faraway years the FMF proposed a new methodology based on a combination of the measurement of the nuchal translucency and the maternal age to reduce the risk of trisomy 21 (Snijders et al., 1998).
substantially effective and efficient. Therefore a policy to give that screening opportunity to pregnant women of all ages will lead to substantially better detection rates with a lower number of prenatal invasive tests.
Deng et al. (2012) introduced an automatic detector for nuchal translucency that gives an accurate measurement of the NT as well as other methods (Bernardino et al., 1998; Lee et al., 2007). However such a method is dependent by a correct identification of mid-sagittal frames as suggested by FMF and proposed in Piazzeet al.(2007) and Mogra et al.(2012).
The system proposed in Moratalla et al. (2010) does not avoid fundamental constraints such as the intensive training of the sonographer and the identification of the user-defined window must contain a large amount of NT and not include any structure which could lead to wrong measurements. Even so, a manual validation of the final result is required.
More recently, a preliminary system to process three-dimensional ultrasound data was presented in Cho et al. (2012), though conventional bi-dimensional images are still the gold standard. Furthermore, a methodology for the identification of the mid-sagittal section was described in Anzaloneet al.(2013).
This paper introduces an original tool to support the early diagnosis by selecting automatically possible mid-sagittal sections in ultrasound videos, regardless to eventual pathologies. In addition, our methodology is able to remove the issue of intra-observer and inter-observer repeatability, thus making objective the final measurement.
MATERIAL AND METHODS
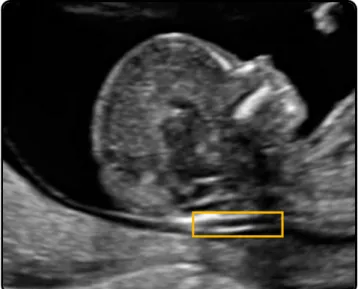
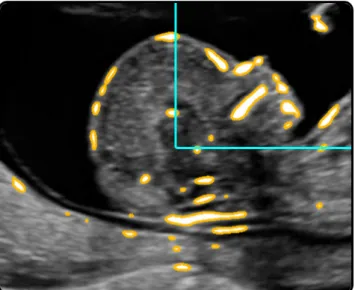
Nuchal translucency (Fig. 1) is a fluid fill under the necks skin of fetus which appears sonographically as an anechogenic area (i.e., a dark zone in grayscale images) between two echogenic regions (i.e., bright zones). The optimal period to measure the NT thickness lays between the 11st and the 13rd weeks, when NT reaches the maximum thickness. During this period it also possible to verify other eventual complications, including miscarriage, stillbirth, preeclampsia, gestational diabetes mellitus, preterm delivery, fetal growth restriction and macrosomia.
Fig. 1. Sample ultrasound image with highlighted nuchal translucency.
The FMF drew up the first clinical training program for skilled sonographers that proven to have an excellent technical knowledge. Results obtained during the last years suggest that this protocol ensures a substantial precision in the measurements (Greene et al., 2004). Wald et al. (2003) already did not agree with this point of view, although a number of authors recently claimed that he did a disservice to the FMF because the proposed education process is intended to maintain high quality and consistency in the measurement of the nuchal translucency.
The protocol drawn up by the FMF recommends that:
– the ultrasound machine should be of high resolution;
– the magnification should be as large as possible; – the fetal crown-rump length should be 45-84 mm; – only the head and the upper part of the torax must
be present in the image;
– the fetus must be in a neutral position otherwise. Indeed when the neck is hyperextended the measurement may be increased to 0.6 mm; similarly, when the neck is flexed the measurement may be decreased by 0.4 mm;
– it must be possible to distinguish between fetal skin and amnion because they appear similar during this period of gestation;
transabdominal ultrasound probe should be posed at the falx cerebri, which divides the choroid plexus in two symmetrical halves.
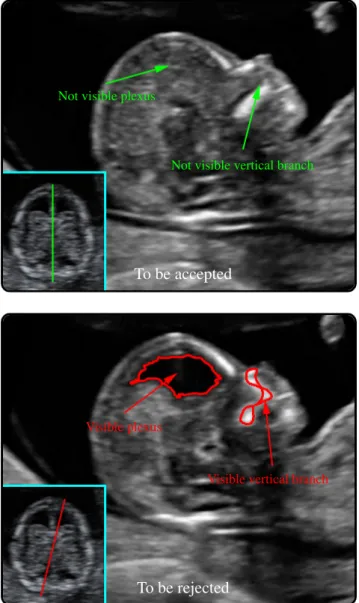
This last item is quite important and it represents the goal of our work. Both the following conditions must hold to determine whether a sagittal section is also median (Fig. 2):
– the vertical branch of the maxilla, which branches off from the upper jaw to the nasal bone, must not be visible;
– the plexus should not be visible, that is the region is uniformly echogenic.
Not visible plexus
Not visible vertical branch
To be accepted
Visible plexus
Visible vertical branch
To be rejected
Fig. 2.Mid-sagittal (top) and not mid-sagittal (down) sections, with falx cerebri (framed). The latter image is rejected because it does not satisfy the required norms.
To the best of our knowledge, no standard dataset of fetal videos or still images with measured and validated data is available. Therefore we created our own dataset acquired by an expert physician using a GE Voluson E8 equipment. 10 video sequences of various durations, representative of 10 different subjects with both the left and the right sides, were taken between the 11st and the 13rd weeks of pregnancy. All digital files were stored with the lowest compression ratio of the H.264 codec (ITU, 2013) in order to avoid as many artifacts as possible. We uniformly extracted 3000 frames from the video sequences in a random way and saved them in the PNG lossless format with 480×640 pixels.
A variety of classification techniques were considered to test the correctness of mid-sagittal sections: we experimentally obtained the best result via multilayer feed forward neural networks. One advantage of this approach is the ability to design a model by collecting the information about the available data.
This paper describes a methodology, mainly based on wavelet analysis and neural network classifiers to detect the jawbone and on radial symmetry analysis to detect the choroid plexus. These two steps allow to identify automatically the frames in a video sequence which represent correct mid-sagittal sections to be processed. The description of the methodology starts with an introduction on how to train the classifiers, followed by an explanation of its main steps. Details about the training phase of the networks we implemented are reported together with the description of the proposed methodology.
TRAINING OF THE CLASSIFIERS
target outputt:
MSE= 1
N
∑
(ni−ti) 2.To minimize the overall error, the network weights w are adjusted by a back-propagation process in accordance with the standard general equations (Egmont-Petersenet al., 2002):
∆w(jim)=η δjOi+α∆w
(m−1)
ji ,
∆w(jim+1)=wi j(m)+w(i jm),
where η is the learning rate, α is the momentum constant,δκ andOκ are the error signal and the output neuron at hidden nodeκ, respectively. The maximum number of epochsmwas experimentally set to 1000.
Not visible vertical branch
Visible vertical branch
Fig. 3.Input images, obtained from Fig. 2, for the first neural network.
To train the first network we created a specific dataset with two classes which show the presence or the absence of the vertical branch, labeled accordingly by an expert. The input of this network consists in a binary image, while the output layer returns two probability values in the range 0.1–0.9, indicating the degree membership to the classes above.
We permuted ten times the set of 3000 frames and each permutation is partitioned into three subsets of cardinality 1000. Each subset is used to train the neural network, while the union of the other two subsets is used as a testset. Because we generated 10 random permutations, the performances of the neural networks, initialized once, were tested 30 times.
The second network has the goal of recognizing the individual components in the ultrasound images which do not provide the vertical branch. In particular, four classes, labeled again by an expert, were considered: the nasal bone, the mandible, the chin and “other”. We are interested in the mandible component to delimit a region of interest to look for the choroid plexus, while the nose and the chin are considered in order just to improve the reliability of this classifier. The input of this network consists in a binary image and the output layer returns four probability values in the range 0.1–0.9 for every component. The component which presents the overall highest probability value for the mandible class is considered as the actual mandible.
The goodness of the training of both the networks has to be evaluated and it is reported within the results.
After the training of both the networks, the proposed methodology needs to analyze the plexus: this step is based on the meaning of echogenicity of each pixel or set of pixels of the frame. In order to assess this echogenicity, we reasoned that an approach based on the identification of three classes (anechogenic, echogenic and uncertainty) via probability distribution function would have been the best choice, in term of sensitivity, specificity and computational time. The physician marked five representative areas of 3×3 pixels for each class in all the frames (Fig. 5). These sets of pixels were used to calculate the probability distributions functions of each class with mean µ and one standard deviation σ (Fig. 6), used to evaluate the echogenicity of the choroid plexus region.
Fig. 5. Anechogenic (red), echogenic (green) and uncertain (blue) regions as marked by the physician.
µ=6.1 σ=3.5
µ=16.5
σ=4.6
µ=29.4
σ=7.9
Fig. 6.Normal probability distribution functions of the anechogenic (red), echogenic (green) and uncertain (blue) regions with meanµ and standard deviationσ.
Fetal profile analysis
Jaw bone detection
Choroid plexus detection
Frame selection
Fig. 7.Sketch of the proposed methodology.
MAIN STEPS OF THE METHODOLOGY
The analysis of the jawbone and the plexus constitutes the core of our methodology. Fig. 7 depicts its flowchart. Via wavelet analysis and neural networks the algorithm checks the presence of the jaw bone; if the vertical branch is not present, then it looks for the choroid plexus via radial symmetry; otherwise it discards the image because the basic requirement is not satisfied. Lastly, the candidate image is classified via probability distributions as a sagittal or a mid-sagittal section.
Step 1: versus identification
A preliminary step consists in the identification of the left or right fetal profile versus to limit the region in which the jaw will be located. The bone tissue has a high impedance with respect to the acoustic waves and consequently its components appear as very bright regions. Since the skull presents many bones (chin, jaw, nasal bone, frontal bone, occipital bone) it is sufficient to identify the upper quadrant with on average the greatest number of bright components in all frames of the video (Fig. 8). These face components are detected through a particular wavelet transform, defined in the next section.
Without loss of generality, we will describe our methodology for the right profile, but similar considerations are valid for the left profile.
Fig. 8.Choice of the quadrant with bright components.
Step 2: jaw bone detection
The wavelet analysis is a powerful mathematical tool for representing and processing data, to enhance or to suppress components with specific frequencies (i.e., size and shape). We applied the so-called `a trous algorithm (Holschneideret al., 1988) because it is very fast and retains the maximum resolution (i.e., both the output image does not undergo decimation unlike the usual multiresolution analysis; Gonz´alez-Aud´ıcanaet al., 2005).
Given the imageI, we perform afilterbankof low-pass and high-low-pass filters:
I0(p) =I(p), Ii(p) =Ii−1(p)~`i,
where the non-zero elements of the low-pass filter `i are given by the isotropic kernel ` (Jain et al., 1995; Ballar`oet al., 2008; Bellaviaet al., 2014):
`= 1
16
1 2 1 2 4 2 1 2 1
, `i(2
i−1q) =`(q),
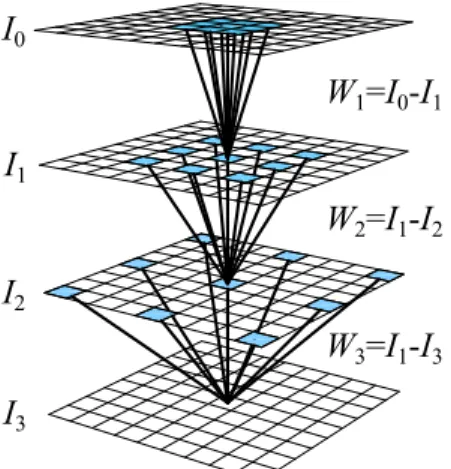
and the pixel qspans the 3×3 neighborhood of each pixel p. The remaining high-pass filter is defined as the difference between two consecutive spatial scales, which provide the wavelet planes (Fig. 9):
Wi(p) =Ii−1(p)−Ii(p).
This algorithm takes a constant time when computing a series ofWidue to the advantage that the number of non-zero elements in`i is always equal to nine and moreover the convolution can be speeded up by considering the variable separability of`:
`= 1
16
1 2 1
1 2 1
.
Small objects are enhanced in the first planes while bigger components are present in the last ones. We experimentally verified that a simple hard threshold based on the average µ and standard deviation σ of the overall luminosity ofW6is able to put in evidence the main components of the face of the fetus (Fig. 10):
C(p) ={p:W6(p)≥µ(W6) +2σ(W6)}.
W1=I0-I1
W2=I1-I2
W3=I1-I3 I0
I1
I3 I2
Fig. 9.A sequence of convolutions Ii with bigger and bigger versions of the kernel ` (light-blue elements). The differences Wi between consecutive convolutions allow to locate structures with various sizes in I.
Fig. 10. The wavelet plane W6 to highlight the face components.
This binary image (Fig. 3) is passed to the first neural network, used to verify the absence of the vertical branch. The images without the branch are therefore processed by the second network which identifies the component associated with the jaw.
Step 3: plexus detection
shows a coarse radial symmetry (Loy and Zelinsky, 2003).
Symmetry plays a remarkable role in perception problems and its relevance in vision tasks was already exploited (Di Ges`uet al., 2010). Here we are interested in the identification of radial symmetries to locate the correct position of the head of the fetus, roughly considered as a circle. To achieve this goal on grayscale images, different algorithms were proposed in the literature (Reisfeldet al., 1995; Di Ges`u et al., 1997). A comparison of these methods was reported in (Loy and Zelinsky, 2003) together with a fast detector of circular and slightly elliptic objects through the use of accumulator arrays of gradient fields. Its efficiency was proved even if the exact radius of the symmetry (i.e., the dimension of the head) is unknown a priori, as in our case.
The underlying idea of the algorithm we used (Loy and Zelinsky, 2003) consists in the observation that each object in the image is delimited by its contour, obtainable by following its higher values in the gradient magnitude image. Therefore, amplifying the contribution of gradient vectors which lie along a circular shape of radius r highlights the center of the circle. Vice versa, the contribution of the vectors with random orientations (e.g., due to noise or weak symmetry) will be neglectable. In other words, maxima in the following accumulation array Srindicate the positions of pixelspwith a remarkable degree of symmetry with respect tor, as in Fig. 11. It must be noted that even if a set of possible radii has to be considered to fit properly the contour of the head, this algorithm results quite fast because the gradient field g is computed just once through, for example, a simple and separable Sobel convolution. A further Gaussian convolutionGr,σ with size equal to the radius and standard deviation σ=r/4 reduces the effect of eventual noise.
p0(p) =p+
rg(p)
||g(p)||
, Or(p0(p)) =Or(p0(p)) +1, Mr(p0(p)) =Mr(p0(p)) +||g(p)||,
Sr(p) =
Mr(p) min2{k,Or(p)}
k ~Gr,σ ,
where Or and Mr accumulate the number of pixels and their gradient magnitude, respectively. The value k=9.9 was set up by the authors of the original paper (Loy and Zelinsky, 2003). The position ofp0(p) is indicated by red points in Fig. 11.
Fig. 11. The gradient, which is always orthogonal to the objects’ contour, is considered for different radii, highlighted by the red points. The size of each point indicates the number of vectors influencing that point (i.e., the degree of symmetry).
60◦ 120◦
60◦ 120◦
In the images we considered, the cranial region is not the only shape approximable to a circumference, so knowing the position of the jaw bone, we limit the search of the center of symmetry to the upper region to the left of the jaw. We modified the symmetry detector to consider only bright sectors with pre-determined radii (85–90 pixels) and angles (60◦–120◦). We experimentally fine-tuned these parameters taking into account small variations in size of the head in the images acquired by our ultrasound equipment (Fig. 12).
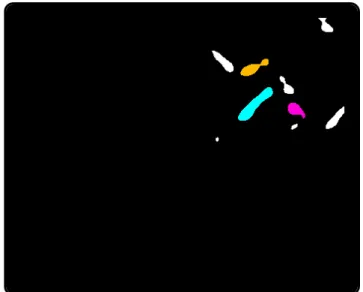
Once the skull is located, we analyze in detail its circular sector comprised between the radii 25–85 pixels and the angles 10◦–100◦: the pixels within this area are labeled as echogenic or anechogenic according to the probability distributions functions. The current image of the video is considered a valid mid-sagittal section if the number of anechogenic and echogenic pixels satisfies the following pre-determined test (Fig. 13):
#anechogenic #overall ≤φ
#echogenic #overall ≥ϕ
where #overall refers also to uncertain regions within the circular sector and the empirical values are equal toφ=0.10 andϕ=0.55.
RESULTS
We focused our attention on the ultrasound analysis for detecting eventual mid-sagittal sections. This is a fundamental step to identify the correct thickness of the NT, which is beyond the scope of this article. Our algorithm processes the videos to understand the left or right fetal profile versus, but this information can be provided preliminarily by the physician. The pipeline of algorithms we implemented follows the protocol proposed by the Fetal Medicine Foundation and it is based on two multilayer feed forward neural networks to analyze the main components of the face of the fetus, obtained via a redundant wavelet transform. A training step is required to fine-tune the correct response of the neural networks and we randomly extracted 10 times in accordance to the section ‘Training of the Classifiers’. A symmetry detector limits the region of interest where to apply the probability distributions functions provided by an expert physician.
100◦
10◦
Accepted
100◦
10◦
Rejected
Fig. 13.Output returned by the proposed methodology (Fig. 2). Colors refer to the ground-truth defined by an expert physician (Fig. 5).
till the end of the algorithm. If we consider the final correctness of the complete methodology on all the test-set, we obtain better results as shown in Table 6.
Table 1.Efficiency matrix about the vertical branch on the training-set (first neural network).
Vertical branch training
yes
no
Methodology
yes no Physician
86.68% 14.47%
13.32% 85.53%
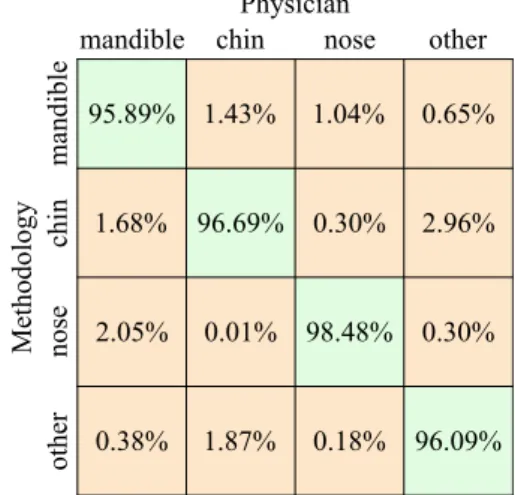
Table 2.Efficiency matrix about the face components on the training-set (second neural network).
Physician
Methodology
mandible
chin
nose
other
mandible chin nose other
Face components training 95.89% 1.43% 1.04% 0.65%
1.68% 96.69% 0.30% 2.96%
2.05% 0.01% 98.48% 0.30%
0.38% 1.87% 0.18% 96.09%
Table 3.Performance matrix about the vertical branch on the test-set (first neural network).
94.96% 11.46%
5.04% 88.54%
Vertical branch test
yes
no
Methodology
yes no
Physician
Table 4. Performance matrix about the face components on the test-set (second neural network).
Physician
Methodology
mandible
chin
nose
other
mandible chin nose other
Face components test
98.56% 0.20% 0.63%
0.85% 99.80% 3.54%
0.00% 0.00% 20.60%
0.59% 0.00% 75.23%
99.70% 0.10%
0.10%
0.10%
Table 5.Performance matrix about the choroid plexus on the test-set.
yes
no
Methodology
yes no Physician
Choroid plexus test 86.48% 16.73%
13.52% 83.27%
Table 6.Performance matrix of the whole methodology on the test-set.
accepte
d
rejected
Methodology
accepted rejected Physician
Mid-sagittal test
87.26% 5.02%
12.74% 94.98%
DISCUSSION
it does not return any diagnoses or put in evidence issues, but it simply highlights to force the patient to further investigations.
The study of fetal images is a difficult task in general and just a few works concern even the semi-automatic analysis of ultrasound fetal images: they usually involve the measurement of significant characteristics (e.g., nuchal translucency, nasal bone, head circumference, femur length) on mid-sagittal sections manually selected by the physician (Chalana et al., 1996; Bernardinoet al., 1998; Leeet al., 2007; Catanzaritiet al., 2009; Denget al., 2010; Moratallaet al., 2010; Weeet al., 2010).
Although this is still a key area of research, new efforts are now fostering to provide a complete diagnosis with further non-invasive and complementary techniques. Some examples in the gene field are given by the Polymerase Chain Reaction and the Next Generation Sequencing, but with greater costs, requirements and turnaround times (Chitty et al., 2012) with respect to the proposed approach.
We defined an automatic methodology to detect mid-sagittal sections in ultrasound videos of fetuses. The results versus the ground-truth proved the reliability of our approach with a balanced accuracy equal to 91.12% and the performance matrix of the whole methodology is in Table 6. It must be noted that the methodology returns a 87.26% of true positive mid-sagittal frames, this indicates only 12.74% of good mid-sagittal frames were rejected and, on them, a correct measure could be done. On the other hand, 94.98% of true negative implies a notable result because it means that just 5.02% of the frames could drive the system to a non-correct measurement of the nuchal translucency.
REFERENCES
Anzalone A, Fusco G, Isgr`o F, Orlandi E, Prevete R, Sciortino G,et al.(2013). A system for the automatic measurement of the nuchal translucency thickness from ultrasound video stream of the foetus. In: Proc 26th IEEE Int Symp Comput Based Medical Syst (CBMS) 239–44.
Ballar`o B, Florena A, Franco V, Tegolo D, Tripodo C, Valenti C (2008). An automated image analysis methodology for classifying megakaryocytes in chronic myeloproliferative disorders. Med Image Anal 12:703– 12.
Bellavia F, Cacioppo A, Lupas¸cu C, Messina P, Scardina G, Tegolo D, Valenti C (2014). A non-parametric segmentation methodology for oral videocapillaroscopic images. Comput Meth Prog Bio 114:240–6.
Bernardino F, Cardoso R, Montenegro N, Bernardes J, Marques De S´a J (1998). Semiautomated ultrasonographic measurement of fetal nuchal translucency using a computer software tool. Ultrasound Med Biol 24:51–4.
Catanzariti E, Fusco G, Isgr`o F, Masecchia S, Prevete R, Santoro M (2009). A semi-automated method for the measurement of the fetal nuchal translucency in ultrasound images. In: Foggia P, Sansone C, Vento M, eds. Proc 15th Int Conf Image Anal Process (ICIAP 2009). Lect Not Comput Sci 5716:613–22.
Chalana V, Winter 3rd. TC, Cyr DR, Haynor DR, Kim Y (1996). Automatic fetal head measurements from sonographic images. Acad Radiol 3:628–35.
Chitty L, Hill L, White H, Wright D, Morris S (2012). Non invasive prenatal testing for aneuploidy-ready for prime time? Am J Obstet Gynecol 206:269–75.
Cho HY, Kwon J, Kim YH, Lee KH, Kim J, Kim SY, et al. (2012). Comparison of nuchal translucency measurements obtained using Volume NT and two-and three-dimensional ultrasound. Ultrasound Obst Gyn 39:175–80.
Deng Y, Wang Y, Chen P (2010). Automated detection of fetal nuchal translucency based on hierarchical structural model. In: Proc 23rd IEEE Int Conf Comput Based Medical Syst (CBMS) 78–84.
Deng Y, Wang Y, Chen P, Yu J (2012). A hierarchical model for automatic nuchal translucency detection from ultrasound images. Comput Biol Med 42:706–13. Di Ges`u V, Tabacchi M, Zavidovique B (2010). Symmetry
as an intrinsically dynamic feature. Symmetry 2:554– 81.
Di Ges`u V, Valenti C, Strinati L (1997). Local operators to detect regions of interest. Pattern Recogn Lett 18:1077– 81.
Egmont-Petersen M, de Ridder D, Handels H (2002). Image processing with neural networks - a review. Pattern Recogn 35:2279–301.
Gonz´alez-Aud´ıcana M, Otazu X, Fors O, Seco A (2005). Comparison between Mallat’s and the ‘`a trous’ discrete wavelet transform based algorithms for the fusion of multispectral and panchromatic images. Int J Remote Sens 26:595–614.
Greene N, Platt L, Nicolaides K, Wald N, Wald N, Rodeck C,et al.(2004). In response to ‘Certificate of competence in performing specific procedures or tests in screening practice’. Prenatal Diag 24:315–20. Holschneider M, Kronland-Martinet R, Morlet J,
Tchamitchian P (1988). The `a trous algorithm. Tech. Rep. CPT-88/P.2215.
great arteries in chromosomally normal fetuses with increased nuchal translucency thickness at 11-13 weeks of gestation. Ultrasound Obst Gyn 7:245–50.
Jain R, Kasturi R, Schunck B (1995). Machine Vision. New York: McGraw-Hill.
Lee YB, Kim MJ, Kim MH (2007). Robust border enhancement and detection for measurement of fetal nuchal translucency in ultrasound images. Med Biol Eng Comput 45:1143–52.
Loy G, Zelinsky A (2003). Fast radial symmetry for detecting points of interest. T Pattern Anal 25:959–73. International Telecommunication Union (2013).
Recommendation ITU-T H.264 / International Standard ISO/IEC 14496-10. Tech. rep.
Mogra R, Alabbad N, Hyett J (2012). Increased nuchal translucency and congenital heart disease. Early Hum Dev 88:261–7.
Moratalla J, Pintoffl K, Minekawa R, Lachmann R, Wright D, Nicolaides K (2010). Semi-automated system for measurement of nuchal transhicency thickness. Ultrasound Obst Gyn 36:412–6.
Onyeacholem I, Kleiner B, Hull A, Chibuk J, Romine L, Anton T,et al.(2015). Setting up a nuchal translucency clinic: what radiologists need to know. Ultrasound Quart . (in press)
Orlandi F, Damiani G, Hallahan T (1997). First-trimester screening for fetal aneuploidy: biochemi stry and nuchal translucency. Ultrasound Obst Gyn 10:381–6.
Piazze J, Anceschi M, Cerekja A, La Torre R, Pala A, Papa A,et al.(2007). Nuchal translucency as a predictor of adverse pregnancy outcome. Int J Gynecol Obstet 98:5– 9.
Reisfeld D, Wolfson H, Yeshurun Y (1995). Context-free attentional operators: the generalized symmetry transform. Int J Comput Vision 14:119–30.
Snijders R, Noble P, Sebire N, Souka A, Nicolaides K (1998). Uk multicentre project on assessment of risk of trisomy 21 by maternal age and fetal nuchal-translucency thickness at 10-14 weeks of gestation. The Lancet 352:343–6.
Wald N, Rodeck C, Hackshaw A, Walters J, Chitty L, Mackinson A (2003). First and second trimester antenatal screening for Down’s syndrome: the results of the Serum, Urine and Ultrasound Screening Study. J Med Screen 10:56–104.
![Fig. 12. Rectangular region of interest (located through the jaw) with the superimposed circle (top), obtained by the radial symmetry map S [85,90] (down)](https://thumb-us.123doks.com/thumbv2/123dok_us/8085085.2142254/7.892.466.827.444.1052/rectangular-region-located-superimposed-circle-obtained-radial-symmetry.webp)