Journal of Global Pharma Technology
Available Online at
www.jgpt.co.in
RESEARCH ARTICLE
Automated Pattern Classification for PCG Signal as a Novel
Method for Clinical Decision Support System
Abbas K. Abbas
1,Ali Hussein F. Al-Nasraui
2*1Biomedical Engineering Department, University of Saskatchewan, Canada.
2Biotechnology Dept. Al Qasim Green University, Babil, Iraq.
*Corresponding Author Email: [email protected]
Abstract
Auscultation pattern recognition also known as PCG Pattern classification was one of the efficient computer-based methods applied to medical decision making. PCG Pattern recognition generally is interpreted in two ways. This work reports robust results with phonocardiogram PCG-signal pattern classification. Linear prediction analysis with basic agglomerative clustering techniques was applied to extract the spectral pattern from phonocardiogram signals, a relatively new technique. In this test, 35 PCG samples are classified correctly, except for seven samples; and 24 PCG samples correctly, except for three samples. The efficiency of PCG spectral features classification has been confirmed experimentally to be integrated in automated auscultation computer aided diagnosis (Au CAD) systems. The more specific interpretation algorithms are limited to finding patterns in PCG signals or other related bio-signal activities. This work covers the new technique applied in basis of pattern classification for mitral regurgitation PCG signals to investigate different hemodynamics turbulences and stochastic blood flow patterns associated with cardiac circulation.
Keywords: Phonocardiography, Clinical Decision making, Pattern classification, Cardiovascular arrhythmia, Auscultation.
Introduction
Auscultation pattern recognition also known as PCG Pattern classification, was one of the resourceful computer-based methods applied to medical decision making, generally it is interpreted in two ways. Basically, most general definition includes recognition of spatial patterns in any type of PCG dataset and is called uniform PCG pattern classification this categorize peaks of heart sounds as excitation source for circulation hemodynamic, and other is called adaptive pattern clustering which magnify and
observe the spectral characteristics
associated with PCG turbulences and differentiate them as clinical diagnostic indices.
Fig.1 shows how the four heart sounds are correlated to the electrical and mechanical events of the cardiac cycle (references please).
PCG Classification Technique
This work reports robust results with
phonocardiogram PCG-signal pattern
classification. Linear prediction analysis and
basic agglomerative clustering techniques were applied to extract the spectral pattern from phonocardiogram signals, a relatively new technique. In this examination, 35 PCG samples are classified correctly, except for seven samples; and 24 PCG samples correctly, except for three samples.
The characteristics for each class are well extracted and the results of spectral classifications are obviously robust. The
efficiency of PCG spectral features
classification has been confirmed
experimentally to be integrated in automated auscultation computer aided diagnosis (Au CAD) systems. Discrimination of abnormal
S1, S2 and S3 peaks was succeed with
BAC-algorithm and k-mean based data clustering technique.
different hemodynamic turbulences and
stochastic blood flow patterns associated with cardiac circulation
[1].
Fig.1: Correlation of the four heart sounds with the electrical and the mechanical events of the cardiac cycle [2].
PCG spectra contain vast number of definite harmonics categories that would be useful to be identified as clustering scheme in any data classification algorithms, Majority of these spectra although it belongs to specific valvular pathologies have a distinct energy (intensity) level in STFT plot, this would be attractive point to consider such variation as clustering point, this considerably will oriented the classifier algorithm to stable entropy value.
The spectral information characteristics of PCG lie within a frequency band of (54-520 Hz) and this band depend on digitals stethoscope interface and resolution of data converters in instrumentation platform. This criteria is the basis for our pattern classification technique in which the
dependency on frequency (spectral)
characteristics.
Block diagram for overall spectral
classification system is demonstrated in Fig.2
[2]. Several spatial patterns can be derived
from the vector input PCG signals, in which they processed with a specific FIR-filter length. The most recognized patterns in PCG are systolic and diastolic and pre-systolic and post-diastolic peaks of sound (S1, S2, S3, and
S4) which is shown in Fig.1, most of
cardiologist prefer the base-diagnosis on 2 categories of PCG, S1 and S2, so that they
can discriminate the hemodynamics
turbulences in appropriate method, the spectra stamp can be oriented in 3 schema (supraspectra, infraspecta and mid-spectra) in which are represent the intensity harmonics for PCG waveform, correlation between two intensity peaks of PCG gives a
defined index for clustering profile Mj-PCG of
PCG signal which in turn apply a segmental cluster for input vector[2].
Systolic and diastolic murmur frequencies are classified according to the frequency band containing the largest power value in the tenth(s) of the systole/diastole corresponding to the found maximum values of SI/DI. If the largest power value is found in one of the two lowest frequency bands (containing frequencies below 125 Hz), the murmur is classified as a low-frequency murmur. If the largest power value is found in one of the eight highest frequency bands (containing frequencies above 250 Hz), the murmur is classified as a high-frequency murmur. If none of the above is the case, the murmur is
10]. 1st -step: obtain PCG spectral
information.This result obtained by using Db-wavelets decomposition techniques for a set of PCG signal as below.
k PCGPCG g n x k g n k
x n
y[ ] ( )[ ] [ ] [ ].…. (1)
Extracting the PCG diastolic low frequency components as the Equation (2)
k PCG diastolic PCGlow n x k g n k
y ( )[ ] [ ] [2 ]…..(2)
And for PCG systolic high frequency components
k PCG systolic PCGhigh n x k h n k
y ( )[ ] [ ] [2 ]…. (3)
Based on the characteristic features extracted from the heart sound signal, the nature of the heart sound can be identified using pattern recognition techniques.
A number of pattern recognition and
classification schemes have been
implemented for the analysis of heart sounds. Classical pattern recognition techniques include the Gaussian-Bayes classifier and the
K-nearest neighbor classifier (k-mean
clustering). The Gaussian–Bayes classifier is the most popular parametric technique of supervised pattern recognition. It is considered optimal when the probability density functions (p.d.f) of the patterns in the feature space are known (a pattern is defined as an N-dimensional vector composed of N features) [3].
The K-nearest neighbor classifier is a nonparametric approach, which is useful when the probability density functions are
difficult to estimate or cannot be estimated [4].
The nearest neighbor method is an intuitive approach based on distance measurements, motivated by the fact that patterns belonging to the same class should be close to each other in the feature space. Joo et al. demonstrated the diagnostic potential of a Gaussian–Bayes classifier for detecting degenerated bio prostheses implanted in the
aortic position [4, 5]. 2nd Step: applying k-mean
clustering for derived spectra. Taking the
momentum equation for input vector x
PCG-signal to separate the spectral pattern derived
from Db-wavelets decomposition algorithm.
1 signal -PCG j j PCG T j PCGj x x
M ….. (4)
T i PCG Ci x X
i PCG signal
PCG
W x m x m
S i
1 ..(5)Where M j PCG is the class momentum in
k-space and it is constructed first to set the
separation line for each class, and SW
PCG-signal is the segmental pattern derived after
integrating the momentum equation (4).
Automated PCG Data Acquisition
Interpretation of PCG spectra pattern was done through an EDA-Exploratory Data
Analysis platform-MATLAB® with spectral
generating by Auto signal®; where the vectors of PCG data fed into k-mean-agglomerative cluster kernel and extracted the main classes for S1 and S2 waveform. The computation algorithm present a stable operation through classification of 15 PCG (10 ♂, 7 ♀) samples width S.D. =0.023 and 37-yr old average. Results obtained from classification methods are shown in fig.3
where the chaotic patterns have been improved in identification clinical value for auscultation diagnostics, robust and stable clustering methods have been approved by mean technique. The clustering with k-mean method seems to be more robust in response to PCG patterns Table.1 shows the performance analysis result; Fig.4 shows the difference between 7 cluster graphs
before applying k-clustering and after.
Pattern orientation has been improved with this method. Definition of each spectra
cluster within agglomerative and k-mean
auscultation from the body chest and back
[3, 4].
Fig.2: Block diagram of Automated PCG classifier system with k-mean algorithm and wireless connectivity to clinical mobile workstation or smart phones
PCG spectral estimation is demonstrated in Fig.3. Where the 3 dominant cases for systolic and diastolic murmurs are observed and analyzed. The potential application for
such classification technique is the
integration of this classifier into the smart
phones and tablet apps to be a unique heart energy signature detection and analysis. This indeed, will be of highly valuable diagnostic tools for both personalized healthcare usage
and primary medical care consultation [6, 10].
Fig.3 PCG pattern spectra derived from wavelet decomposition and to be entered to k-mean classification algorithm
Statistical Performance Analysis
Performance analysis of the k-mean clustering showing a stable and robust result in comparison to supervised classification method such neural network and higher order statistics HOS , as shown in Fig.5
class plane domain , this will forced the kernel to stabilize the clustering process ,and adapt itself to a convergence point regarding
a multiple input vector of PCG signals. Ability to isolate different cluster from
numerous number of received PCG spectra [7].
Fig.4 performance analysis of extracted PCG signal and SIR value for overall classification matrix
Performance index for k-mean clustering has been noted as a higher index for PCG data clustering (see table.1). Viability to robust clustering and a well-defined pattern adding superiority to k-mean clustering techniques, by which cardiologist have to be considered in artificial intelligence-based PCG diagnostic modes and intensity-oriented classifiers
system. Basically, k-mean clustering
computation time is comparably longer that with agglomerative based clustering, this is due to the high categorization line with k-mean and insufficient spectral correlation between intensity peaks of murmurs in PCG.
Therefore, optimization for each method needs intensive work on biomedical spectral
analysis and classification [10]. Redundancies
pattern associated with this technique raised from incomplete training sets or random noise spectra associated with acquired PCG signal, dynamic identification of diastolic and systolic murmurs can be corrected from associated noise by using FIR filtering implemented in the automated classification path to remove any parasitic acoustic noise which may occurred during data acquisition procedure[8,9].
Table.1: PCG pattern clustering performance index according to hemodynamic sequences Clustering
Method p-value SIR index stethoscope over three cardiac cycle phases Mean of PCG signal intensity from e-(mV)
No .of PCG cluster identified
S1 S2 S1 S2 systolic diastolic presystolic
K-Mean 0.0123 1.682 0.542 11
ANN-RBN 0.0167 1.732 0.732 8
HOS 0.0189 1.788 0.931 9
Basic Aggl. 0.0154 1.892 0.963 7
Table.2 illustrates the classification performance test of k-mean clustering method. Different physiological parameters of the multiple cycles PCG recorded for 12 second PCG trace have been classified. In this table the most robust classified pattern is the diastolic and abnormal blood flow turbulence which are associated with acute and chronic coronaries arteries disease and the relative decrease in performance for systolic pattern referred to the coherent noise parasitized in PCG recording and this may
eliminate the classifier form being recognized the mean value of PCG amplitude (see
Table.2) [10]. Finally the further averaging
and filtering using a composed wavelets decomposition and PCA separation for optimized the extracted coefficients for PCG signals, clinical validation should take around as minimum 130 cases for approved
techniques as automated auscultation
diagnostics module in heart sound
pathologies (see Table.2)[8].
Table 2: Classification test performance for adaptive K-mean clustering with 34 subject (8 ♂-6♀), mitral regurgitated pattern- different systolic instability (prolonged tachyarrhythmia) ,SD=3.281 ±0.728, mean intensity=15.73 mV/mmHg
PCG Pathological case
Corrected PCG pattern
Uncorrected PCG pattern
Total No. of PCG pattern
% performance of identified PCG As clinical indices
S1 S2 S1 S2 S1 S2 Abnormal Mild Moderate Normal
Systolic pattern 81 77 6 3 87 69 93.3±0.1 91.4±0.1 96.5±0. 92.6±0.1
Diastolic pattern 64 60 3 5 67 78 93.5±0.34 91.4±0.1 96.5±0. 92.6±0.1
Murmurs 78 76 5 4 83 79 91.7±0.32 91.4±0.1 90.5±0. 97.0±0.3
Stochastic blood flow 46 44 3 6 49 52 93.9±0.46 91.4±0.1 89.7±0. 93.7±0.1
Congestion heart failure
42 43 4 3 38 43 87.04±0.32 91.4±0.1 96.5±0. 90.6±0.1
RBBB 39 45 5 4 42 40 91.3±0.67 93.6±0.1 89.5±0. 92.5±0.1
LBBB 44 40 6 4 40 37 93.2±0.61 91.4±0.1 94.5±0. 88.9±0.5
Arrhythmia 41 43 6 5 39 44 90.4±0.23 87.5±0.2 92.1±0.3 90.7±0.2
Application of k-mean and agglomerative clustering showing high stability to different PCG signal categories and this indeed play a vital role in quantifying and identifying different hemodynamic cases through pattern
classification technique. Well define
separation line has been identified and
robust S1 and S2-spectra clustering was
achieved and variable pathological cases were tested, including different mitral valve
regurgitations, systolic hemodynamic
abnormalities and stochastic blood flow patterns.
Improvement of the clustering system makes through successive repeatable iteration for
each pattern on k-mean and agglomerative
clustering technique by minimizing the distance function of clustered pattern. Clinical information about the health of heart valves is contained in a single cycle of PCG signal. Hence it is very important to identify single cycle for analysis of defects. Current state of art techniques use a reference signal
like ECG or Carotid blood pressure pulse, to obtain a single cycle of the PCG signal. We have proposed a novel method to segment and classified PCG signal into single periodic
cycle using both wavelet-debauches
decomposition and k-means clustering, which works well when the heart rate is uniform for the entire sequence of PCG signal recording. The segmentation algorithm has shown 91.22% of success.
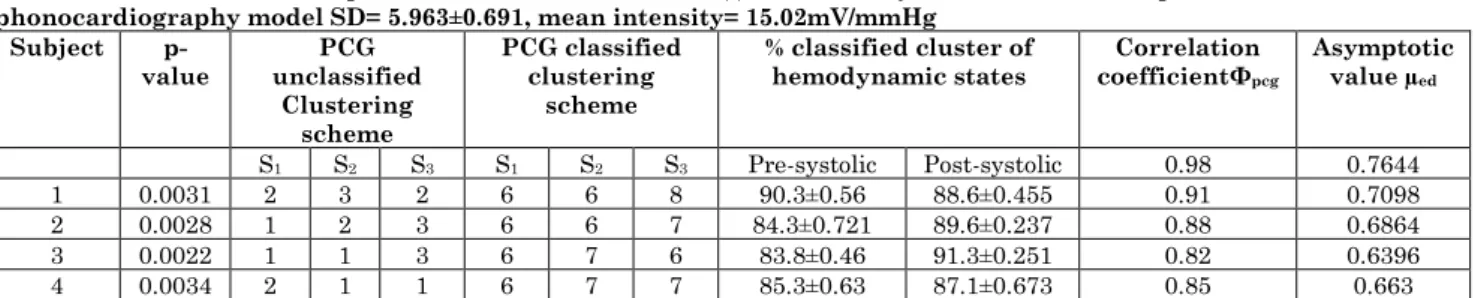
The 29 wavelet features of each segmented cycle were reduced to 11 using basic agglomerative clustering. These reduced feature sets were classified by the k-mean clustering into five classes. Essentially, the classification performance of 95.32% was obtained (see table.3). It is concluded that classification of segmented PCG signals obtained without using a reference signal can be achieved through an automated k-mean clustering of PCG spectra in single or multiple heart cycle.
Table 3: PCG Classification performance with Db-wavelet†† with 34 subject - Associated adaptive ARMAX-reference phonocardiography model SD= 5.963±0.691, mean intensity= 15.02mV/mmHg
Subject
p-value unclassified PCG Clustering
scheme
PCG classified clustering
scheme
% classified cluster of
hemodynamic states coefficientΦCorrelation pcg
Asymptotic value µed
S1 S2 S3 S1 S2 S3 Pre-systolic Post-systolic 0.98 0.7644
1 0.0031 2 3 2 6 6 8 90.3±0.56 88.6±0.455 0.91 0.7098
2 0.0028 1 2 3 6 6 7 84.3±0.721 89.6±0.237 0.88 0.6864
3 0.0022 1 1 3 6 7 6 83.8±0.46 91.3±0.251 0.82 0.6396
5 0.0027 1 1 2 7 6 7 88.6±0.455 83.8±0.46 0.87 0.6786
6 0.0032 2 2 1 8 6 6 90.0±0.733 85.3±0.63 0.91 0.7098
7 0.0033 1 2 2 7 7 8 93.2±0.844 88.6±0.455 0.94 0.7332
8 0.0035 2 1 2 7 6 8 88.6±0.455 90.0±0.733 0.88 0.6864
9 0.0031 3 1 2 6 6 8 89.6±0.237 93.2±0.783 0.90 0.702
10 0.0028 1 1 3 7 7 8 91.3±0.251 86.2±0.127 0.90 0.702
11 0.0032 1 2 2 6 7 6 87.1±0.673 89.6±0.546 0.87 0.6786
12 0.0037 2 1 1 6 7 7 93.2±0.783 91.3±0.251 0.92 0.7176
13 0.0035 3 2 1 7 8 8 86.2±0.127 87.1±0.673 0.88 0.6864
14 0.0029 2 1 3 8 7 7 89.6±0.546 93.2±0.783 0.90 0.702
15 0.0030 1 2 3 7 7 8 88.6±0.455 86.2±0.127 0.88 0.6864
16 0.0034 2 2 3 6 6 7 88.6±0.455 84.3±0.721 0.87 0.6786
17 0.0038 3 3 2 8 8 7 88.6±0.455 83.8±0.46 0.88 0.6864
Acknowledgements
We acknowledge biomedical engineering department at Al Mustaqbal University College (AMUC) and Al Qasim Green University in Babil for their valuable
assistance and technical support in this project to get on track of success.
Conflict of Interest
The authors declare that there is no conflict of interest with other research work and group.
References
1. Criley JM, D Criley, C Zalace (1995) "The
physiological origins of heart sounds and murmurs: the unique interactive guide to cardiac diagnosis". Boston: Blaufuss Medical Multimedia,.
2. Debbal SM, F Bereksi-Reguig (2004)
”Analysis of the second heart sound using continuous wavelet transforms”. J. Med. Eng. Technol., 28:151-156.
3. El-Segaier M, O Lilja, S Lukkarinen, L
Sornmo, R Sepponen, E Pesonen (2005) "Computer-based detection and analysis of heart sound and murmur". Ann. Biomed. Eng., 33:937-942.
4. Guo Z, LG Durand, HC Lee, L Allard, MC
Grenier, PD Stein (1994)" Artificial neural
networks in computer-assisted
classification of heart sound in patients with porcine bio prosthetic valves". Med. Biol. Eng. Comput., 32:311-316.
5. Leatham A (1998) Auscultation of the
Heart and Phonocardiography, 2nd
Edition. London: Churchill Livingstone, 4th
edition.
6. Li X, M Parizeau, R Plamondon (2000)
"Training hidden Markov models with multiple observations-a combinatorial method". IEEE Trans. Pattern Anal. Mach. Intel., 22:371-377.
7. Liang H, S Lukkarinen, I Hartimo (1997)
Heart sound segmentation algorithm based on heart sound envelogram. Comput. Cardiol., 24:105-108.
8. Brock A, Pateros M, Clifford P (2000)
"Characterization of PCG sound as index for hemodynamic disturbances: review study", IFBME Springer.
9. Abbas K Abbas, RashaBassam, Rana
Mazin (2008)” Spectral Analysis of PCG signal based on ARMAX algorithm’, 3ed Int. Biomedical engineering Conf. Proc. Biomed 2008 Malaysia.
10.Abbas K Abbas, Rasha Bassam (2009)
"Phonocardiography signal processing",
Synthesis lecture on Biomedical