Developing an Interactive Web-Based
Clustering System for Analyzing Students‟Academic
Performances
Lotfi NAJDI, Brahim ER-RAHA
GMES LaboratoryENSA, Ibn Zohr University Agadir, Morocco
Abstract—The analysis of graduate students’ profiles based on theirs educational outcomes is essential for higher education institutions in order to adapt educational strategies and improve academic achievements. In this paper we present the capabilities of clustering techniques in educational environment. We also develop a web-based system to make clustering of students’ performance, more usable for university managers. The resulting system could help universities to transform data accumulated in their systems into valuable knowledge and to enhance the comprehension and monitoring of academics performances of their students.
Keywords— Decision Support System;Educational Data Mining; Unsupervised machine Learning; Clustering ; K-means
I. INTRODUCTION
The amount of data stored in educational databases is rapidly increasing as a result of the adoption of information technology to manage educational information including schools, students, teachers and staff. One of the biggest challenges that higher education faces today is converting these data into valuable and useful knowledge in order to support decision making. Higher education institutions could address this challenge by using data mining in education called Educational Data Mining (EDM). EDM is concerned with developing methods for exploring the unique types of data that come from educational settings, and using those methods to better understand students and the settings they learn in [1]. There are varieties of popular tasks within the educational data mining: prediction, clustering, relationship mining, discovery with models, and distillation of data for human judgment [2].
The purpose of this work is to propose a system for investigating groups and typologies of graduate students based on their educational outcomes. This system implements K-means algorithm to detect similar groups of students according to their academic performance in addition to the time to degree for the completion of bachelor‟s degree.
The rest of the paper is structured as follows. In Section 2, basic clustering techniques are introduced and related works in clustering applied to educational environment are summarized. Section 3 is devoted to the methodology of this work.
Section 4 demonstrates the most relevant features of the proposed system. Finally, this paper is concluded by a summary and an outlook for futures works.
II. CLUSTERING ALGORITHMS APPLIED IN EDUCATIONAL DATA MINING
Data mining is a process of extracting knowledge from massive volume of data. It refers to a way of finding significant and valuable information from large databases. The knowledge which is extracted can include pattern types, association rules and different trends. Data mining techniques can be differentiated by their different model functions and representation, preference criterion and algorithms. Moreover, data mining systems provide the means to easily perform data summarization and visualization. Common representations for models extracted by data mining techniques include rules, decision trees, linear and non-linear functions, instance based examples and probability models.
Clustering is the most common unsupervised data mining method [3]. This technique deals with finding a structure in a collection of unlabeled data and consists of organizing objects into groups whose members are similar, so that observations in the same cluster have some points in common [4]. A cluster is therefore a collection of objects which are “similar” between them and are “dissimilar” to the objects belonging to other clusters.
Clustering methods can be classified into one of the followings categories: hierarchical methods, partitioning methods, density-based methods, model-based clustering and grid-based methods [5]. In this work we will particularly focus on clustering by partitioning, which relies on repositioning the observations by relocating them from one cluster to another, from an initial partition. This technique generally requires that the number of clusters to be informed in advance [6].
clustered together (to examine patterns of behavior) [8]. The application of several clustering algorithm has been applied in many cases to data set, from educational setting, in diverse studies: K-means clustering has been used to uncover interesting patterns that characterize the work of stronger and weaker students in collaboration tool for senior software development project[9]; Expectation Maximization, Hierarchical Clustering, and X-Means have been applied to determining students' learning behaviors by mining Moodle log data[10]; An approach based on Agglomerative hierarchical clustering has been suggested to model learner participation profiles in online discussion forums[11]; Latent Class Analysis has been compared to K-means Algorithms for Clustering Educational Digital Library Usage Data[12]; Clustering combined with classification and association analysis have been proposed for joint use in the mining of student's assessment data[13]. Clustering algorithms have been also proposed to group students based on to their academic outcomes: K-means algorithm and factor analysis have been used to determine profiles of students from course evaluation data [14];K-means clustering with Decision tree have been applied to develop Student‟s Academic Performance [15]; K-means clustering algorithm combined with deterministic model has been described to evaluate students „achievements for a specific semester [16]; Hierarchical clustering and k means clustering have been applied to characterize the students‟ academic performance[17].
In this work, the purpose is to implement the clustering by partitioning in order to enable decision maker, with no technical background, building clustering models for the segmentation of graduate students based on theirs academic performance.
III. METHODOLOGY
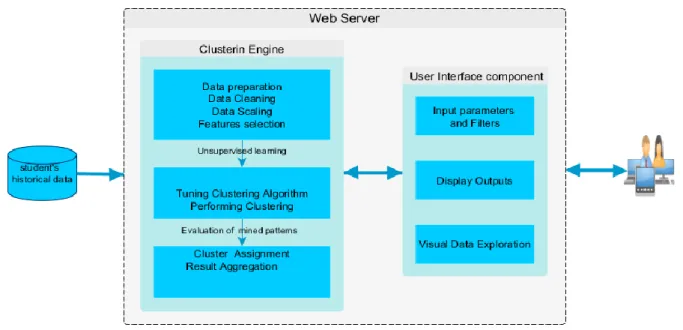
The proposed mining system was designed to interactively generate clusters of students based on theirs academic outcomes. Figure 1 illustrates the client–server architecture and the main components of the system. Namely the user interface component (Front-End Layer) witch deal with data input/output operations and the clustering engine component (Application Layer ) responsible of data management, data preparation and quality control , patterns discovery and generation of plots and statistical analysis. Those components of the web server are controlled by the code written with R language for the back end and Shiny framework for the front end.
R is a language and environment for statistical computing and graphics, largely employed by scientific community for statistical analysis, data visualization, and predictive modeling. R provides a wide variety of statistical (linear and nonlinear modeling, classical statistical tests, time-series analysis, classification, clustering,) and graphical techniques, and is highly extensible.
Shiny is an open source R package that provides web framework for building web applications using R. Shiny allows to turn analyses into interactive web applications without requiring HTML, CSS, or JavaScript knowledge, This
framework is based on a reactive programming [18], which was designed so that each modification in the web client through inputs data or parameters will change the displayed result over the user interface. Shiny offers essentially the benefits that there is no need to combine R code with HTML/JavaScript code as the framework already includes natives features that are needed to develop interactive web application.
The choice of R and shiny was motivated by the advantage of freedom and power of R in performing data mining and statistical analysis tasks, along with interactive and intuitive web-based data visualization.
A. User Interface
The web-based user interface help user to load student‟s historical data, filter the studied population giving the year of diploma and the department, choose the number of clusters and visually inspect results of the learning algorithm. User preferences and inputs are then transferred to the R server for the execution of the supervised learning task and the generation of data visualizations and summarizations before they are displayed afterward by this interface.
B. Clustering Engine
This component involves the necessary modules for performing the clustering task. These modules deal with the necessary routines from data preparation and preprocessing, clustering calibration and identification to the analysis of recognized clusters.
1) Data preparation module
One of the important stages of data mining is preprocessing, where we prepare the data for mining. Real world data tends to be incomplete, noisy, and inconsistent and an important task when preprocessing the data is to fill in missing values smooth out noise and correct inconsistencies. Hence the data preparation module relies on the implementation of necessary functions for the improvement of data quality such as data cleaning and outliers‟ removal. These functions and services are summarized as following:
a)Missing values: The first routine consist of cleaning missing values which trip up a lot of data mining algorithms. Replacement by feature mean value,for that attribute in the database, was selected for this pre-processing step.
b)Outliers detection: This function is concerned with the treatment of outliers. An outlier is a data object that deviates significantly from the rest of the objects, as if it were generated by a different mechanism.
c)Scaling data: The third function is features scaling, which looks for limiting the variation range of independent variables or features of data. In data processing, it is also known as data normalization.
continuous attributs, so only numerical variables must be selected form the original dataset.
2)Clustering module
K-means algorithm was selected to perform the clustering task. K-means partitions data into K clusters represented by their centers. The center of each cluster is calculated as the mean of all the instances of each cluster. The algorithm of K-means can be described as follow:
1. Select K points as the initial centroids. 2. repeat
3. Form K clusters by assigning all points to the closest centroid.
4. Re-compute the centroid of each cluster. 5. until The centroids do not change
This algorithm has been selected because its simplicity and its performance regarding computational memory efficiency
which is very needed for offering maximum interaction through the clustering analysis system. However, k-means has some limitations: In particular, the analyst may not know in advance the number of cluster witch is mandatory parameter of the algorithm; an another problem with K-means is its sensitivity for the initial state of the centroids location, which will make K-means stuck in local minima instead of finding the global minima or the right groups.
The variant of K-means described by Hartigan and Wong algorithm has been used for implementing the system. The number of initial configurations attempts was 20 and K-means reports on the best one, to overcome K-means sensitivity to initial selection of centroids. The distance measure being used was Euclidean distance.
Fig. 1. Clustering system architecture.
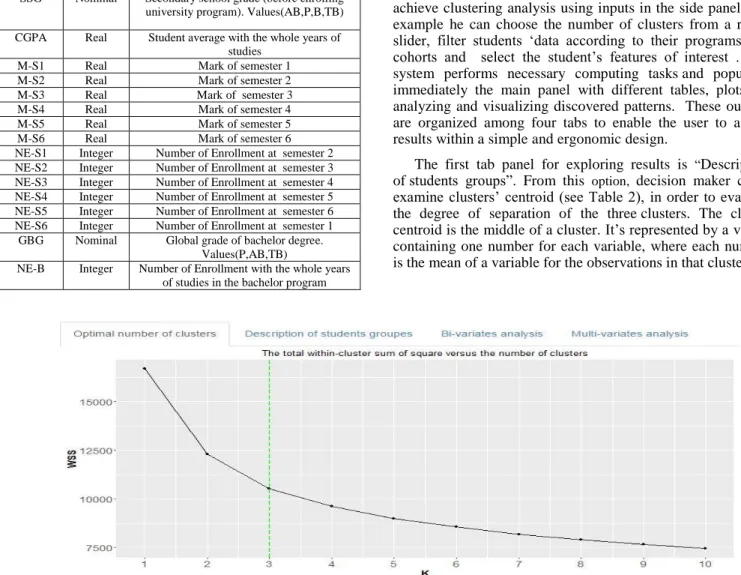
In order to assist decision maker to determine whether they are using the right number of clusters. Elbow method has been proposed to validate the best number of clusters. The idea of the elbow method is to run k-means clustering on the dataset for a range of values of k (say, k from 1 to 10), and for each value of k total within-groups sums of squares (WSS), against the number of clusters.
3) Analysis of mined patterns module
This routine aim to prepare the exploration and visualization of mined patterns. It consists of assigning cluster to the data set that contains both numeric and categorical variables before performing pre-processing actions like scaling. Characteristics of each students „clusters are then investigated by aggregating results and calculating the means
of each of the features across different clusters. Furthermore a visual exploratory data analysis of results has been implemented to gain a deeper insight and understands the structures of mined patterns. Moreover a profile analysis was carried out, including categorical features, in order to examine the variation of other student characteristics among students‟ segments.
IV. A CASE STUDY
“Table 1” shows selected attributes of this dataset covering 2000 students. As already mentioned, elbow method has been implemented to determine the number of groups to be extracted from students „data. As shown in “Fig. 2”, the system display the elbow plot to assist end user defining student‟s segments, the slope changes extremely in the third repetition, therefore we could consider three as the proposed number of clusters.
TABLE 1. Data attributes
Attribute Type Description
SSG Nominal Secondary school grade (before enrolling university program). Values(AB,P,B,TB)
CGPA Real Student average with the whole years of studies
M-S1 Real Mark of semester 1 M-S2 Real Mark of semester 2 M-S3 Real Mark of semester 3 M-S4 Real Mark of semester 4 M-S5 Real Mark of semester 5 M-S6 Real Mark of semester 6 NE-S1 Integer Number of Enrollment at semester 2 NE-S2 Integer Number of Enrollment at semester 3 NE-S3 Integer Number of Enrollment at semester 4 NE-S4 Integer Number of Enrollment at semester 5 NE-S5 Integer Number of Enrollment at semester 6 NE-S6 Integer Number of Enrollment at semester 1 GBG Nominal Global grade of bachelor degree.
Values(P,AB,TB)
NE-B Integer Number of Enrollment with the whole years of studies in the bachelor program
The web interface allows decision maker to interactively achieve clustering analysis using inputs in the side panel. For example he can choose the number of clusters from a range slider, filter students „data according to their programs and cohorts and select the student‟s features of interest . The system performs necessary computing tasks and populates immediately the main panel with different tables, plots for analyzing and visualizing discovered patterns. These outputs are organized among four tabs to enable the user to assess results within a simple and ergonomic design.
The web interface allows decision maker to interactively achieve clustering analysis using inputs in the side panel. For example he can choose the number of clusters from a range slider, filter students „data according to their programs and cohorts and select the student‟s features of interest . The system performs necessary computing tasks and populates immediately the main panel with different tables, plots for analyzing and visualizing discovered patterns. These outputs are organized among four tabs to enable the user to assess results within a simple and ergonomic design.
The first tab panel for exploring results is “Description of students groups”. From this option, decision maker could examine clusters‟ centroid (see Table 2), in order to evaluate the degree of separation of the three clusters. The cluster centroid is the middle of a cluster. It‟s represented by a vector containing one number for each variable, where each number is the mean of a variable for the observations in that cluster.
Fig. 2. Proposed number of clusters based on Elbow method
The centroid is considered as a measure of cluster location. For a particular cluster, the average distance from the centroid is the average of the distances between observations and the centroid. The maximum distance from the centroid is the maximum of these distances.
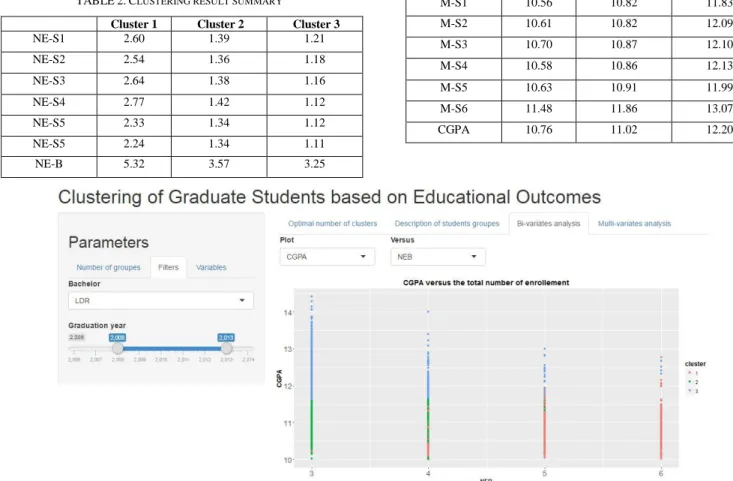
From the “Bi-variates analysis” tab panel, Different scatterplots could be produced interactively to investigate students‟ performances for similar groups at the semester level
of the bachelor degree depending on user choices. This feature allows a visual data exploration of resulting clusters and has been implemented using the ggplot and ggparcoord R packages. For example the cumulative Global Point Average CGPA versus the time to complete the bachelor degree (or
TABLE 2. CLUSTERING RESULT SUMMARY
Cluster 1 Cluster 2 Cluster 3
NE-S1 2.60 1.39 1.21
NE-S2 2.54 1.36 1.18
NE-S3 2.64 1.38 1.16
NE-S4 2.77 1.42 1.12
NE-S5 2.33 1.34 1.12
NE-S5 2.24 1.34 1.11
NE-B 5.32 3.57 3.25
M-S1 10.56 10.82 11.83
M-S2 10.61 10.82 12.09
M-S3 10.70 10.87 12.10
M-S4 10.58 10.86 12.13
M-S5 10.63 10.91 11.99
M-S6 11.48 11.86 13.07
CGPA 10.76 11.02 12.20
Fig. 3. Analysis of CGPA versus the number of enrollment
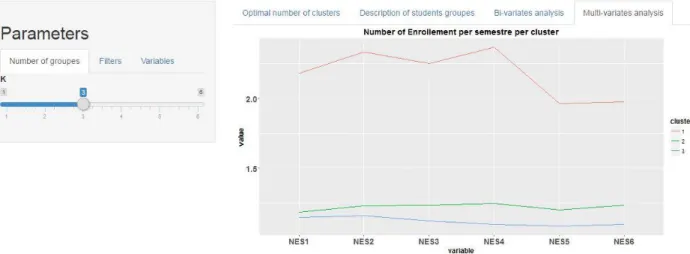
The last tab “Multi-variates analysis” provides an enhanced exploratory data analysis of mined patterns by allowing a multivariate Data Visualization. This feature has been designed using the ggparcoord packages and offers the following two parallel-coordinate plots: The first one displays the mean of the time to degree from semester 1 to semester 6 among the extracted clusters (see “Fig. 4”); the second one shows the mean of the obtained marks from semester 1 to semester 6 among the tree identified clusters (see “Fig. 5”).
As it might be seen in “Fig. 4” and “Fig. 5”, students‟ performance at the first semester of the bachelor degree are the most relevant variables in separating graduate student‟s segments according to academic achievements.
TABLE 3. CHARACTERISTICS OF STUDENTS GROUP
Cluster Description
Cluster 1 Represent 28% of the graduate students. It could be labeled as the cluster of students with poor academic performances for booth obtained marks and the time to degree (almost students have a poor CGPA with a highest
number of enrollments).
Cluster 2 Represent the top number of students in the group. It consists of 50 % of the population.
It could be labeled as the cluster of students with medium academic performances (good level of lengths of study
with moderate marks).
Cluster 3 Could be considered as a group of most successful students. It represents 22% of the graduate students (very
Fig. 4. Analysis of Enrollment Time among Clusters
Fig. 5. Analysis of Student‟s marks among identified Clusters
Through this case study, a clear line of split-up among three groups of graduate students that could be referred to as slow, moderate and fast learners has been drawn under the clustering-based system. The results could be associated to other pre-enrolment data to gain more insight of students‟ characteristics and segments. This system may be of significant interest for the development of student‟s patterns, and for the improvement of different learning outcomes such as graduation rate and time to degree. Indeed through the identification of clusters of learning performance, and the classification of the personalized requirements of each group, decision maker could make informed decision about terms of educating, offering courses and curriculum, required time for teaching and so on.
V. DISCUSSIONANDCONCLUSION
Through this work, Clustering analysis has been discussed and implemented to uncover groups of graduate students from the bachelor program. The Clustering-based system has made
it possible to distinct three groups of students, with similar learning performance such as marks and time to degree. This web-based system has rendered clustering task more usable for decision maker and academic administrator, by enabling them to select the studied variables, choose the number of clusters and interact with the resulting visualization in a friendly manner. Our future work will focus on the following directions. First, we will enhance this system by implementing a module for internal clustering validation to assess the pertinence of the extracted patterns. Second, we plan to expand this work by enabling clustering analysis of student‟s data within both numeric and categorical attributes.
References
[2] R. S. Baker and K. Yacef, “The state of educational data mining in 2009: A review and future visions,” JEDM-J. Educ. Data Min., vol. 1, no. 1, pp. 3–17, 2009.
[3] Data Mining and Predictive Analytics, 2 edition. Hoboken, New Jersey: Wiley, 2015.
[4] C. Romesburg, Cluster Analysis for Researchers. Lulu.com, 2004. [5] J. Han and M. Kamber, Data Mining: Concepts and Techniques. 2000. [6] L. Rokach and O. Maimon, “Clustering methods,” in Data mining and
knowledge discovery handbook, Springer, 2005, pp. 321–352.
[7] D. Neha and B. M. Vidyavathi, “A Survey on Applications of Data Mining using Clustering Techniques,” Int. J. Comput. Appl., vol. 126, no. 2, 2015.
[8] R. Baker and others, “Data mining for education,” Int. Encycl. Educ., vol. 7, pp. 112–118, 2010.
[9] D. Perera, J. Kay, I. Koprinska, K. Yacef, and O. R. Zaïane, “Clustering and Sequential Pattern Mining of Online Collaborative Learning Data,” IEEE Trans Knowl Data Eng, vol. 21, no. 6, pp. 759–772, Jun. 2009. [10] A. Bovo, S. Sanchez, O. Héguy, and Y. Duthen, “Analysis of students
clustering results based on Moodle log data,” in 6th International Conference on Educational Data Mining-EDM 2013, 2013, p. pp–306. [11] G. Cobo, D. García-Solórzano, J. A. Morán, E. Santamaría, C. Monzo,
and J. Melenchón, “Using agglomerative hierarchical clustering to model learner participation profiles in online discussion forums,” in
Proceedings of the 2nd International Conference on Learning Analytics and Knowledge, 2012, pp. 248–251.
[12] N. Flann, B. Xu, M. Recker, X. Qi, and L. Ye, “Clustering Educational Digital Library Usage Data: A Comparison of Latent Class Analysis and K-means Algorithms,” ResearchGate, vol. 5, no. 2, Aug. 2013. [13] A. Banumathi and A. Pethalakshmi, “A novel approach for upgrading
Indian education by using data mining techniques,” in 2012 IEEE International Conference on Technology Enhanced Education (ICTEE), 2012, pp. 1–5.
[14] O. Darcan and B. Badur, “Student Profiling on Academic Performance Using Cluster Analysis,” J. E-Learn. High. Educ., pp. 1–8, Jan. 2012. [15] M. Shovon, H. Islam, and M. Haque, “An Approach of Improving
Students Academic Performance by using k means clustering algorithm and Decision tree,” Int. J. Adv. Comput. Sci. Appl., vol. 3, no. 8, 2012. [16] Rakesh Kumar Arora and Dharmendra Badal, “Evaluating Student‟s
Performance Using K-means Clustering,” Int. J. Comput. Sci. Technol., vol. 4, no. 2, 2013.
[17] N. NorSyazwaniRasid and N. Ahmad, “GROUPING STUDENTS ACADEMIC PERFORMANCE USING ONE-WAY CLUSTERING,” Int. J. Sci. Commer. Humanit., vol. 2, 2014.
[18] C. Beeley, Web Application Development with R Using Shiny. Packt