RESEARCH REPOSITORY
This is the author’s final version of the work, as accepted for publication
following peer review but without the publisher’s layout or pagination.
Bari, M.A. and Smettem, K.R.J. (2003) Development of a salt and water
balance model for a large partially cleared catchment. Australasian
Journal of Water Resources, 7 (2). pp. 93-99.
http://researchrepository.murdoch.edu.au/id/eprint/38122/
Copyright: © Hydrology and Water Resources Symosium 2002.
DEVELOPMENT OF A SALT AND WATER BALANCE MODEL
FOR A LARGE PARTIALLY CLEARED CATCHMENT
M. A. Bari
1,2, K.R.J. Smettem
2,3and M. Sivapalan
41
Water and Rivers Commission, East Perth, W.A. 6004.
2
Soil Science and Plant Nutrition, The University of Western Australia, Crawley, W.A. 6009
3
Cooperative Research Centre for Plant Based Management of Dryland Salinity The University of Western Australia, Crawley, W.A. 6009.
4
Centre for Water Research, The University of Western Australia, Crawley, W.A. 6009.
Abstract
A salt and water balance model was developed to represent stream flow and salinity generation processes following land use changes. At first a fundamental building-block model was developed based on the
‘downward approach’. The building-block model was tested and validated with data from six experimental
sub-catchments within the Collie River basin in Western Australia. The approach requires specification of five physically meaningful key parameters, most of which can be obtained a priori or easily calibrated.
Streamflow and salinity from the Collie River catchment, with an area of 2,545 km2, has increased significantly due to clearing of 26% of the area during 1940-70s. For this study the catchment was divided into 91 sub-catchments and the building-block model was applied to each of the sub-catchments. Most of the known catchment attributes such as stream length, average slope, soil type, profile thickness and salt storage were incorporated into the model. Parameter values obtained from experimental sub-catchments were appropriate for representing the daily streamflow generation processes of the whole catchment. However, the prediction of stream salinity and salt loads was improved by running the model a number of times and taking the final values of the transient stream zone stores as an initial condition. The modelled daily stream flow, salinity and salt load hydrographs matched very well for all gauged sub-catchments.
Key Words:
Collie River, Land use change, Stream flow, Salinity, Catchment modelIntroduction
The Collie River catchment is one of the five Recovery Catchments identified under the State Salinity Action Plan (State Salinity Council, 2000). It was a drinking water-supply catchment before stream salinity increased to unacceptable levels. The salinity increase was due to clearing of native forests for pasture development. Consequently a series of experimental sites were established within the catchment to understand the salinity generation processes and rehabilitation options. In the 1970s, the Western Australian Government enacted legislation to control further large-scale agricultural clearing on the Collie River catchment. At the same time, a catchment rehabilitation program was initiated to maintain these catchments as potable water supplies for the future. The rehabilitation program includes (i) planting of deep-rooted trees, (ii) management of
remnant vegetation, and (iii) improved agricultural practices. The program particularly targeted the lower rainfall zones (600-900 mm mean annual rainfall) of the catchment. A recent review revealed that more than 11,000 hectares of cleared and salt affected land have been reforested with deep-rooted trees, mainly pines and eucalypts (Mauger et al., 2001). The stream salinity is however, still increasing in parts of the catchment. In the 1990s however, the rate of increase has slowed down significantly and is nearly at equilibrium for the catchment as a whole. The combination of forest clearing and possibly lower rainfalls due to the effects of climate change may have significant impact on the stream flow and salinity response of the Collie River catchment. A model used recently (Mauger et al., 2001) to assess the effects of management options produced estimates of the mean annual streamflow and salinity when the catchment had
reached steady state for each option. However, there is still a need to evaluate changes in other statistics of the hydrology, especially the rate of change of hydrologic response following a change in land use. This model has been developed to
rapidly simulate daily streamflow and salinity with vegetation cover being a specific and dynamic input. It can be used as a management tool to aid decision-making on different catchment management options to control salinity.
%
%
$ $ $ $ $ $ $Collie River South Bingham River James Crossing 4 1 0 0 0 0 E 6340000 N 6270000 N James Well Wellington Reservoir 4 7 0 0 0 0 E Harris River Collie
%
Darkan Lemon Coolangata Farm Ernies Willi ams Collie Rd C o llie R d S o uth Ea st
Co alfield s Rd Batalling Creek Wights Salmon Maringee Farm Mungalup Tower
N
Rivers%
Towns Subcatchment Main roads Reservoir Experimental catchment$ Gauging station
Legend
7 0 7 14 Kilometres
W A
Collie River
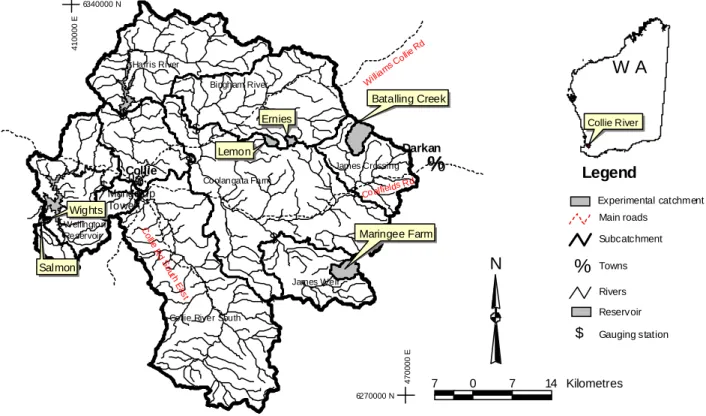
Figure 1 Location of the Collie River catchment, Western Australia
Collie River Catchment
The Collie River is located in the south-west of Western Australia (Figure 1). Annual rainfall varies from approximately 600 mm yr-1 in the eastern part of the catchment increasing westward to about 1200 mm yr-1 at the Wellington Reservoir. Climate is of the Mediterranean type with cool, wet winters and hot, dry summers. Pan evaporation ranges from 1650 to 1400 mm yr-1 (Luke et al., 1988). The dominant forest type throughout the catchment is jarrah (Eucalyptus marginata) and marri (Eucalyptus calophylla). The catchment area to Mungalup Tower was 26% cleared in 1976 when clearing bans were imposed. A considerable amount of area, mainly in the Low Rainfall Zone, has already been planted, predominantly with eucalypts and pines (Table 1).
The Collie River rises in the dissected lateritic landscape of the Darling Range where the relief is gently undulating and relatively flat. Soil profiles are generally deep, typically being 20 m. The depth of weathering is variable but in the high rainfall areas (>1100 mmyr-1) greater dissection occurs, slopes are steeper and bedrock frequently outcrops at the valley invert. The Collie Coal Basin
(area, 230 km2) contains alternating sequences of Permian coal seams, shales and sandstones. Table 1 Gauged catchment areas and land use
Area (km2)
Name Rainfall
(mm).
Total Cleared Planted
Harris R 862 327 2 0
Bingham R 758 365 23 13
James Well 652 184 54 33
James Crossing 628 168 90 13
Coolangata Farm
714 1346 308 69
Collie South 757 657 181 15
Mungalup Tower
759 2545 501 111
Model Development
We followed a ‘downward approach’, originally proposed by Klemes (1983), in developing a simple salt and water balance model. In this approach, the catchment is initially modelled by a single Manabe-type bucket (Manabe, 1969; Milly, 1994) at large space and time scales. As space and/or timescales are reduced, model complexity is increased by adding more buckets in series or
parallel. This leads to better representation of more dynamic hydrologic processes, until an adequate simulation of observed stream flow records is achieved. A single bucket was capable of simulating annual flows observed at a forested control catchment (Ernies) but was inadequate for Lemon catchment, which was cleared for pasture development (Figure 1). More complexity was added to the model by applying multiple buckets (with variable soil depth, i.e. storage capacity) and running simulations on a monthly basis. The model performance improved and additional complexity was then incorporated into the model until it represented the daily flow generation of both the control and treated catchments well. This process of model building is described by Bari et
al. (2002a) in detail. In the final model, the
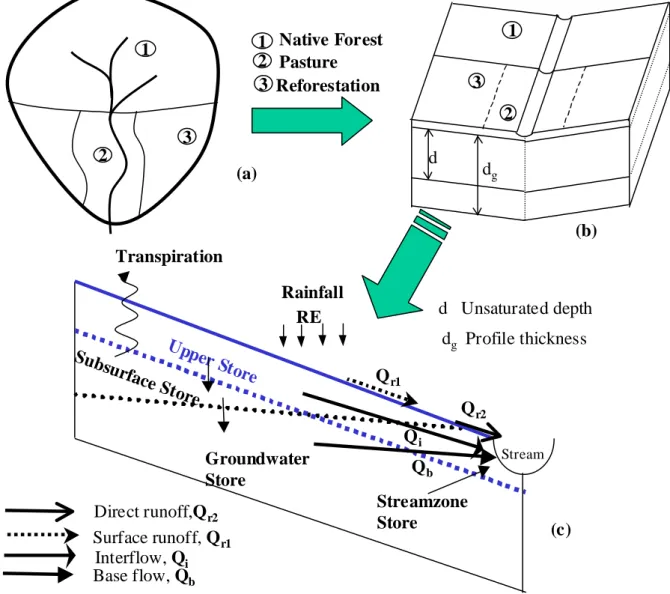
catchment is represented as the ‘open book’ shown in Figure 2, and catchment average soil depth and porosity were introduced. The final model consists of three main components: (i) two-layer unsaturated soil module (upper and lower zone unsaturated store), (ii) saturated sub-surface groundwater module, and (iii) a transient stream zone module. The upper zone unsaturated store is represented by a VIC-type model (Todini, 1995; Zhao and Liu, 1995; Wood et al., 1992), using a simple probability distribution function of the soil moisture capacity. The transient stream zone store represents the groundwater induced ‘saturated areas’ along the stream zone. The model was successfully applied to both Lemon and Ernies catchments.
(a)
(b)
1
2
3
3
2
1
d
d
gGroundwater
Store
Subsu
rface S
Uppe
tore
r Sto
re
Interflow, Q
iSurface runoff, Q
r1Base flow, Q
bDirect runoff,Q
r2Stream
(c)
Q
bQ
iQ
r1Q
r2RE
Transpiration
Streamzone
Store
Rainfall
Native Forest
1
2
3
Pasture
Reforestation
d Unsaturated depth
d
gProfile thickness
Figure 2 Conceptual structure of model: (a) hypothetical catchment, (b) open book representation, (c) model stores
Once the water balance model had been developed, the salt balance component was introduced into the model. Initial salt content of each store was estimated from measured salt
profile data. Two additional parameters were introduced to represent the complex mixing processes associated with stream salinity. Application of the combined salt and water
balance model is described in detail in Bari et al. (2002b).
The conceptual salt and water balance model was applied to four additional experimental catchments within the Collie River (Bari et al., 2002c).
Figure 3 Daily stream flow of Salmon catchment
The climate and land use of the six experimental catchments were very different. Some of them were under native forest experimental control, while others were cleared or reforested. The model was successfully applied to all the catchments and represented the daily stream flow and salinity generation process very well. An example of the modelled and observed stream flow for 1984 in the Salmon catchment is shown in Figure 3. Successful application of the model to experimental catchment runoff and salinity data categorised the model parameters into two groups. One group remained fixed across all catchments once calibrated to one catchment. The other group of five key sensitive parameters reflect specific average catchment characteristics. These five key parameters include the topsoil depth and water holding capacity, lateral and vertical conductivity of the soil column and its relationship with soil moisture content.
Model Application to Collie River
The Collie River catchment was divided into 91 sub-catchments (Figure 1). The fundamental salt and water balance model was applied to each of the sub-catchments.
All the average catchment attributes like soil type and depth, average slope, land use history etc. were determined from available information. Daily rainfall at the centroid of each sub-catchment was calculated using the reciprocal distance method. Soil salt storage was calculated from available profile data and then correlated with long-term
annual rainfall for each sub-catchment. Pan evaporation at the centroid of each of the sub-catchments was estimated from Luke et al. (1988).
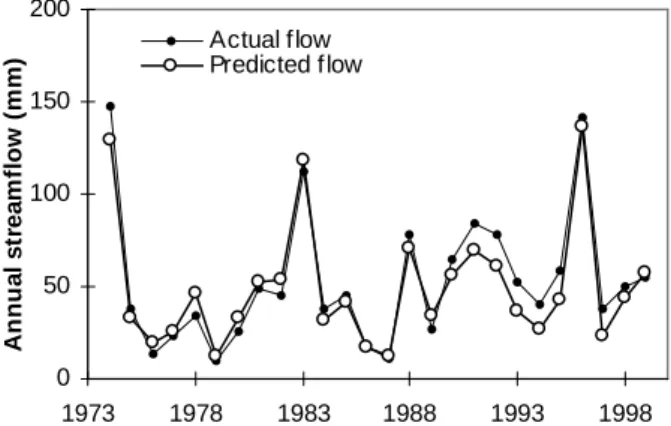
For the initial Collie River model simulation, the fixed parameter values were specified for all sub-catchments. Best estimates for the remaining five key sensitive parameters were also specified. Initial conceptual groundwater levels of different sub-catchments were estimated from clearing history and observed groundwater level trends within similar catchments. The model was successful in representing the stream flow generation process for all the gauged sub-catchments of the Collie River. However, the predicted annual streamflow, for some of the catchments were 10-15% higher than actually observed. This trend is evident at Mungalup Tower gauging station (Figure 4). Except for the low-flow years of 1979, 1987 and 1997, the predicted stream flow was slightly higher than observed.
Figure 4 Annual stream flow at Mungalup Tower
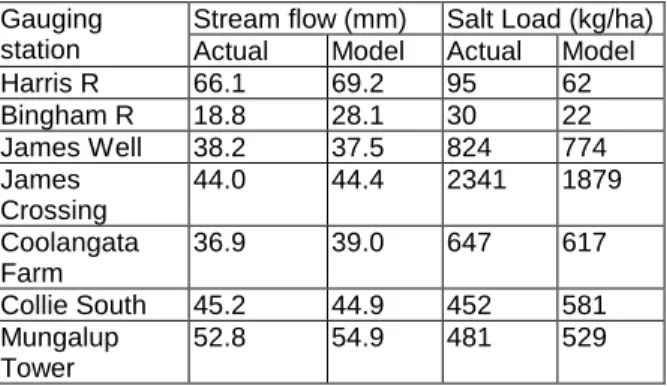
The next step was to adjust the key sensitive parameters so that the predicted and observed stream flow and salinity were better matched. The daily stream flow could be matched very well after a few trials. However, matching the daily stream salinity proved to be difficult. The reason appears to be a failure to adequately account for salt storage in the transient stream zone store of some of the sub-catchments, which were subject to significant clearing in the 1970s. Therefore the model was run a few times and the final salt storage was taken as the initial condition until a reasonable representation of the stream salinity generation process was achieved (Table 2). In the following sections we discuss and present some of the results of the dominant gauged catchments.
0 1 2 3 4 5 6 7 8
May-84 Jun-84 Aug-84 Oct-84 Dec-84
S
tr
e
a
m
fl
o
w
(
m
m
)
Actual flow (mm) Predicted flow (mm)
0 50 100 150 200
1973 1978 1983 1988 1993 1998
A
n
n
u
a
l
s
tr
e
a
m
fl
o
w
(
m
m
Table 2 Observed and simulated stream flow and salt load.
Stream flow (mm) Salt Load (kg/ha) Gauging
station Actual Model Actual Model
Harris R 66.1 69.2 95 62
Bingham R 18.8 28.1 30 22
James Well 38.2 37.5 824 774
James Crossing
44.0 44.4 2341 1879
Coolangata Farm
36.9 39.0 647 617
Collie South 45.2 44.9 452 581
Mungalup Tower
52.8 54.9 481 529
Coolangata Farm is a major catchment, which contains most of the cleared areas (Table 1). The model predicted daily flow matched exceptionally well in terms of peaks, recession and flow duration, given that the model does not have any surface or channel routing component (Figure 5a). However, during the dry period of the year (November to May) when the baseflow dominates the total stream flow, the predicted daily salinity was slightly higher than actually observed (Figure 5b).
Figure 5 Daily (a) stream flow and (b) salinity graph, Coolangata Farm
James Well is another catchment with significant area cleared and subsequently planted. The annual stream flow and salt load averaged to
38 mm and 824 kg/ha respectively. The predicted streamflow and salt loads were 38 mm and 778 kg/ha respectively. However, the model tracked the actual annual stream flow and salinity well (Figure 6) but in low-flow years, the salinity prediction was higher.
Harris River and Bingham River at Palmer are two catchments with very little clearing (Table 1) and naturally both are fresh. Predicted stream flow at Bingham River was higher than actually observed but the salt load was comparable. The predicted stream flow, salinity and salt load trends of other catchments were similar to the results presented.
Figure 6 Annual (a) stream flow and (b) salinity, James Well catchment
Summary and Conclusions
A simple salt and water balance model was developed following the ‘downward approach’. The fundamental model consists of three main components: (i) a two-layer unsaturated soil module, (ii) a saturated sub-surface groundwater and salt flow module, and (iii) a transient stream zone module.
The model was tested and calibrated against observed data obtained from six experimental catchments with different land use and climate conditions. We identified five key sensitive parameters, which are specific catchment
0 0.5 1 1.5 2 2.5 3 3.5
Jan-91 Apr-91 Jun-91 Sep-91 Dec-91
St re a m fl o w ( m m )
Actual flow (mm) Predicted flow (mm)
(a) 0 2000 4000 6000 8000
Jan-91 Apr-91 Jun-91 Sep-91 Dec-91
St re a m s a li n it y ( m g /L T D
S) Actual salinity
Predicted salinity (b) 0 20 40 60 80 100 120 140
1980 1983 1986 1989 1992 1995 1998
A n n u a l s tr e a m fl o w ( m m )
Actual flow (mm)
Predicted flow (mm) (a)
0 2000 4000 6000 8000 10000
1980 1983 1986 1989 1992 1995 1998
S tr e a m S a li n it y ( m g /L T D S ) Actual salinity
characteristics, while the other model parameters remained constant for all applications.
The Collie River catchment was divided into 91 sub-catchments. The sub-catchment area ranged from 2.9 km2 to 327 km2, depending upon the land use and physical properties. The building-block model was applied to all sub-catchments, without any surface or channel routing scheme. Best estimates of the key sensitive parameters were adopted, while the other parameters remained fixed. The model was successful in representing daily stream flow generation process of the whole catchment. However, in some of the gauged catchments predicted annual streamflow was 10-15% more than actually observed.
Initial conceptual groundwater levels and salt storage in the transient stream zone of some of the partially cleared sub-catchments were estimated by running the model a few times and taking the final values as initial conditions. The final model simulated the stream flow and salinity very well for all gauged sub-catchments.
Performance of the model shows that it could be used to aid in developing catchment management plans where the effects of land use change on stream yield and salinity are of concern.
References
Bari, M.A., Smettem, K.R.J. and Sivapalan, M. (2002a). A systematic data-based approach to modelling runoff generation processes following land use changes. In preparation, to be submitted to Hydrol. Process.
Bari, M.A., Smettem, K.R.J. and Sivapalan, M. (2002b). A generalised salt and water balance model for characterizing catchment salinisation process – 2. Fundamental salt balance model. In preparation, to be submitted to J. Hydrol.
Bari, M.A., Smettem, K.R.J. and Sivapalan, M. (2002c).
Parameter sensitivity to climate and
landscape variability of a simple lumped salt
and water balance model.
In preparation, to be submitted to J. Hydrol.Klemes, V., (1983). Conceptualisation and scale in hydrology. J. Hydrol., 65: 1-23.
Luke, G.J., Burke, K.L. and O’Brien, T.M. (1988). Evaporation data for Western Australia. W. Aust. Dept. of Agric., Div. of Resour. Manag., Tech. Rep. No. 65. 29pp.
Manabe, S. (1969). Climate and ocean circulation. 1. The atmospheric circulation and the hydrology of the earth’s surface. Monthly Weather Review, 97(11): 739-774.
Milly, P.C.D. (1994). Climate, Inter-seasonal storage of soil water and the annual water balance. Water Resour. Res., 17: 19-24.
Mauger, G.W., Bari, M.A., Boniecka, L, Dixon, N.R.M. Dogramaci, S.S. and Plat, J. (2001). Salinity situation statement – Collie River. Water and Rivers Commission, Water resource technical report series No. WRT29, 108pp.
State
Salinity
Council
(2000).
Natural
resource management in Western Australia –
the salinity strategy, Govt. of Western
Australia, 72pp.
Todini, E. (1995). The ARNO rainfall-runoff model.
J. Hydrol., 175:339-382.
Wood, E.F., Lettenmaier, D.P., and Zartarian, V.G. (1992). A land-surface hydrology parameter-ization with subgrid variability for general circulation models. J. Geophys. Res., 97: 2717-2728.
Zhao and Liu, (1995). The Xinanjiang model. In: Singh, V.P. (Editor) Computer models of watershed hydrology, Water resources Publications, Louisiana State University, pp. 215-232.
Authors’ Biographies
Mohammed Bari is a Senior Engineer at the Water and Rivers Commission, Western Australia. He holds a Master of Engineering degree in Water Resources. His areas of interests are catchment and lake hydrology, with a particular emphasis on the role of landscape changes on stream flow and salinity. He has a strong interest in the development and application of different types of catchment hydrology models. He is currently completing a (part-time) Doctor of Philosophy degree at the University of Western Australia.
Postal Address: Mohammed Bari, Senior Engineer, Water and Rivers Commission, Hyatt Centre, 3 Plain St, East Perth, WA 6004, Australia.
E-mail: [email protected]
Keith Smettem is an Associate Professor at Soil Science and Plant Nutrition, the University of Western Australia. His areas of interest include the theory and measurement of water and chemical movement through soils and landscapes and the development of indirect methods for parameterising water balance and hydrologic models.
Postal Address: Soil Science and Plant Nutrition, The University of Western Australia, 35 Stirling Highway, Crawley, W.A. 6009, Australia.
E-mail: [email protected]
Murugesu Sivapalan is a Professor of Environmental Engineering at the Centre for Water Research, The University of Western Australia. One of his main areas of interest are hydrology and salinity processes, with a particular emphasis on developing and application of lumped conceptual models to assess the effects of agriculture, mining and forestry activities on water resources.
Postal Address: Centre for Water Research, Department of Environmental Engineering, The University of Western Australia, 35 Stirling Highway, Crawley, W.A. 6009, Australia.
E-mail:
[email protected]
View publication stats View publication stats