ORIGINAL RESEARCH
ADULT BRAIN
How Common Is Signal-Intensity Increase in Optic Nerve
Segments on 3D Double Inversion Recovery Sequences in
Visually Asymptomatic Patients with Multiple Sclerosis?
XT. Sartoretti,XE. Sartoretti,XS. Rauch,X C. Binkert,XM. Wyss,XD. Czell, andXS. Sartoretti-Schefer
ABSTRACT
BACKGROUND AND PURPOSE: In postmortem studies, subclinical optic nerve demyelination is very common in patients with MS but radiologic demonstration is difficult and mainly based on STIR T2WI. Our aim was to evaluate 3D double inversion recovery MR imaging for the detection of subclinical demyelinating lesions within optic nerve segments.
MATERIALS AND METHODS: The signal intensities in 4 different optic nerve segments (ie, retrobulbar, canalicular, prechiasmatic, and chiasm) were evaluated on 3D double inversion recovery MR imaging in 95 patients with MS without visual symptoms within the past 3 years and in 50 patients without optic nerve pathology. We compared the signal intensities with those of the adjacent lateral rectus muscle. The evaluation was performed by a student group and an expert neuroradiologist. Statistical evaluation (the Cohentest) was performed.
RESULTS:On the 3D double inversion recovery sequence, optic nerve segments in the comparison group were all hypointense, and an isointense nerve sheath surrounded the retrobulbar nerve segment. At least 1 optic nerve segment was isointense or hyperintense in 68 patients (72%) in the group with MS on the basis of the results of the expert neuroradiologist. Student raters were able to correctly identify optic nerve hypersignal in 97%.
CONCLUSIONS: A hypersignal in at least 1 optic nerve segment on the 3D double inversion recovery sequence compared with hyposignal in optic nerve segments in the comparison group was very common in visually asymptomatic patients with MS. The signal-intensity rating of optic nerve segments could also be performed by inexperienced student readers.
ABBREVIATION:DIR⫽double inversion recovery
M
R imaging contributes to not only the diagnosis and differ-ential diagnosis of MS but also the monitoring and fol-low-up of patients.1T1-weighted postcontrast, T2-weighted,pro-ton-density, FLAIR, and double inversion recovery (DIR) images are recommended to detect acute and chronic demyelinating le-sions in typical locations.1-9
Acute optic neuritis is an inflammatory demyelination of the optic nerve causing acute visual loss.10-13After recovery, patients
are often visually asymptomatic, but careful visual testing by
sually evoked potentials, optical coherence tomography, and vi-sual disability evaluation may reveal persistent slight vivi-sual defi-cits.14-17These deficits are also observed in patients without any
history of previous acute optic neuritis due to a suspected subclin-ical disease known as subclinsubclin-ical optic nerve demyelination.14-17
Acute optic neuritis is easily diagnosed on MR imaging by focal nerve swelling and segmental T2-weighted hyperintensity, especially on STIR images or on fat-suppressed T2-weighted im-ages and by segmental gadolinium enhancement on T1-weighted fat-suppressed images.10,18-22The enhancement is present for a
mean of 30 days after the onset of visual symptoms.21,23-31
Subclinical optic nerve demyelination, however, is not easily visible on MR imaging. Routine T2-weighted images without fat suppression and contrast-enhanced T1-weighted FSE images do not show any signal abnormality in the affected optic nerve. Fat-suppressed weighted FSE images, especially STIR T2-weighted images, may detect a signal-intensity abnormality in subclinical optic nerve demyelination.23,32,33The highly
diagnos-tic value of fat-suppressed FLAIR images and fat-suppressed 3D
Received February 16, 2017; accepted after revision April 12.
From the Institut fu¨r Radiologie (T.S., E.S., S.R., C.B., M.W., S.S.-S.) and Klinik fu¨r Innere Medizin (D.C.), Abteilung fu¨r Neurologie, Kantonsspital Winterthur, Winterthur, Switzerland.
Thomas Sartoretti and Elisabeth Sartoretti contributed equally to this article.
Institutional review board approval was obtained by the ethics commission of Kanton Zu¨rich on September 26, 2016; Basec No. 2016 – 01396.
Please address correspondence to Sabine Sartoretti-Schefer, MD, Institute of Radi-ology, Kantonsspital Winterthur, Brauerstr 15, 8401 Winterthur, Switzerland; e-mail: [email protected]
DIR images in the detection of any pathologic signal intensity in the optic nerve has been evaluated in acute optic nerve de-myelination.10,34,35 In a few patients with subclinical optic
nerve demyelination, signal-intensity abnormalities have been reported on 3D FLAIR.34However, there are few data about
the use of the 3D DIR sequence in the evaluation of subclinical optic nerve demyelination.36
In our department, patients with MS are routinely and regu-larly monitored for disease progression by a standard protocol with 3D FLAIR, 3D DIR, T2-weighted FSE, and 3D T1-weighted postcontrast images. 3D DIR is added to our standard protocol for improved detection of juxtacortical, cortical, and infratento-rial demyelinating lesions.1-9On the basis of postmortem and
clinical studies having already shown a high percentage of sub-clinical optic nerve demyelination with ongoing axonal loss in patients with MS,37-41we wanted to test 2 hypotheses: first, that it
is possible to detect signal-intensity changes in optic nerve seg-ments on the 3D DIR sequence without the additional application of a STIR T2-weighted sequence over the orbits in patients with MS without a history of clinically obvious visual loss and without a history of acute optic neuritis during the previous 3 years; and second, that the signal-intensity changes on 3D DIR are so obvi-ous that even inexperienced readers can detect them. This second hypothesis is important because in our department, MR imaging examinations of patients with MS are evaluated not only by trained neuroradiologists but also general radiologists. Therefore, it is desirable that the lack of neuroradiologic experience be com-pensated by the application of an easily readable MR image, and the 3D DIR sequence is routinely acquired in our department for the follow-up of patients with MS.
For comparison, the signal intensities of normal healthy optic nerve segments in patients evaluated by the identical 3D DIR se-quence for different diseases (ie, epileptic seizures and posttrau-matic sequelae) were analyzed as well.
MATERIALS AND METHODS
From November 2012 to September 2016, cerebral 3D DIR im-ages were obtained on a 3T MR imaging unit, Achieva (Philips Healthcare, Best, the Netherlands), in both a comparison group and the group of patients with MS.
The comparison group consisted of 50 patients (30 females, 20 males; mean age, 42.5 years; range, 13–78 years) evaluated for epileptic seizures or posttraumatic sequelae after head trauma without any known optic nerve pathology.
The group of patients with MS comprised 95 patients (68 fe-males and 27 fe-males; mean age, 44.5 years; range, 16 –77 years) without clinically obvious visual loss and without any history of previous optic neuritis during the past 3 years. The diagnosis of MS had been present in these patients for a mean of 8.9 years (range, 4.2–26.7 years). Clinical data were obtained with our hos-pital information system.
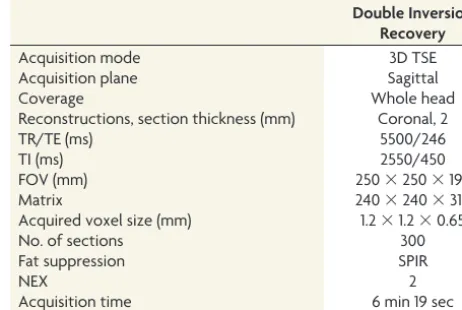
In all patients, the 3D DIR sequence was acquired in the sag-ittal plane. The parameters of this sequence are presented inTable 1. Coronal reconstructions with 2-mm section thickness and 2-mm increments were performed parallel to the long axis of the brain stem covering the orbits and the whole brain.
The optic nerve is divided into 4 segments (ie, the retrobulbar
segment within the orbit, the canalicular segment as the nerve passes through the bony optic canal, the prechiasmatic segment within the suprasellar cistern, and the chiasm). Both prechias-matic segments join at the optic chiasm.23,42The term optic
sys-tem comprises all optic nerve segments.
The evaluation of the signal intensity of the optic nerve seg-ments in both the comparison group and the group of patients with MS was by visual inspection. First, a bilateral analysis of the signal intensity of the 4 optic nerve segments on 3D DIR was performed in the asymptomatic comparison group. Second, the signal intensity of the 4 optic nerve segments on 3D DIR in the group of patients with MS was evaluated.
The signal intensity was separately evaluated for the left and the right optic nerves and for the optic nerve sheath. In the com-parison group, 100 retrobulbar, 100 canalicular, and 100 prechi-asmatic nerve segments and 50 chiasms were evaluated. In the group of patients with MS, 190 retrobulbar, 190 intracanalicular, and 190 prechiasmatic nerve segments and 95 chiasms were ana-lyzed. The signal intensity of the optic nerve segments and of the optic nerve sheath was rated as hypointense, isointense, or hyper-intense compared with the signal intensity of the directly adjacent lateral rectus muscle, thus allowing an easy comparison.
The signal intensity was jointly evaluated by a group of 2 stu-dents (T.S. and E.S.) inexperienced in the evaluation of MR im-ages and by an expert neuroradiologist with 23 years of experience (S.S.-S.). The 2 students had been previously instructed and trained by the expert neuroradiologist by jointly performing cor-rect signal-intensity ratings in 15 randomly chosen MR imaging examinations not included in this study.
The level of the interobserver agreement for the detection of signal abnormalities, considering the different nerve segments, was determined on the basis of the Cohentest, and the results are shown inTables 2and3. Thevalues were interpreted as follows10: Avalue of zero indicated poor agreement; avalue of
0.01– 0.20, minor agreement; avalue of 0.21– 0.40, fair agree-ment; avalue of 0.41– 0.60, moderate agreement; avalue of 0.61– 0.80, good agreement; and avalue of 0.81–1, excellent agreement. Comparisons ofvalues were performed to deter-mine whether the agreements were different for the evaluation of optic nerve signal abnormality.
This retrospective study with the number Basec 2016 – 01396 was approved by the institutional review board Kantonale
Ethik-Table 1: Imaging parameters of the 3D DIR sequence
Double Inversion Recovery
Acquisition mode 3D TSE
Acquisition plane Sagittal
Coverage Whole head
Reconstructions, section thickness (mm) Coronal, 2
TR/TE (ms) 5500/246
TI (ms) 2550/450
FOV (mm) 250⫻250⫻195
Matrix 240⫻240⫻310
Acquired voxel size (mm) 1.2⫻1.2⫻0.65
No. of sections 300
Fat suppression SPIR
NEX 2
Acquisition time 6 min 19 sec
[image:2.594.300.531.57.212.2]kommision Zu¨rich on September 26, 2016, without additional informed con-sent. This article did not receive any grant support and has not been presented at any meetings.
RESULTS
Interobserver Agreement
The agreement was excellent in the as-sessment of the signal intensity of the optic nerve segments on 3D DIR for the comparison group. No interobserver difference was seen. All nerve segments in the comparison group were deemed hypointense for all subjects by the expert reader and the student group.
In the patients with MS group, on 3D DIR, the signal intensity in 6 retrobulbar (3%) and 12 prechiasmatic segments (6%) and 1 chiasm (0.5%) was rated dif-ferently by the student group and the ex-pert reader. The final rating of the signal intensity on 3D DIR was defined accord-ing to the rataccord-ing of the expert neuroradiologist. A correct rataccord-ing of the signal intensity of the different nerve segments on 3D DIR was performed in 97% of all 665 nerve segments by the student reader group.
The level of the interobserver agreement for the detection of signal abnormalities considering the different nerve segments was determined on the basis of the Cohentest (Tables 2and3).
Statistical evaluation yielded an excellent interobserver agreement in the comparison group and in the group of pa-tients with MS, for allvalues were⬎0.8 (Tables 2and3). The 95% confidence interval with a value of 0.901– 0.961 for all nerve segments together proved the very good interobserver agreement.
Signal Intensity in Different Optic Nerve Segments in the Comparison Group
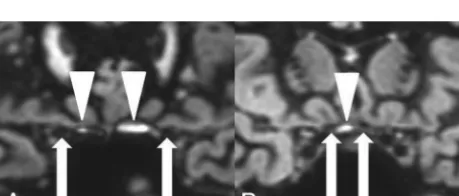
In the comparison group, 100 retrobulbar, 100 canalicular, 100 prechiasmatic, and 50 chiasmatic nerve segments were hypoin-tense on 3D DIR (Fig 1). No isointense or hyperintense nerve signal was observed. The optic nerve sheath was seen as an isoin-tense rim surrounding the hypoinisoin-tense retrobulbar optic nerve (Fig 1A). Small hyperintense artifacts were present at the air-bone interface in 57% of the examinations, both in the comparison group (Fig 2) and in the patients with MS group.
Signal Intensity in Different Optic Nerve Segments in the Patients with MS Group
The results of the signal-intensity rating of the different nerve segments are depicted inTable 4.
On 3D DIR, 27 (28%) of the patients with MS presented with a hypointense optic system without any pathologic signal-inten-sity increase. However, 68 (72%) of the patients with MS pre-sented with an isointense or hyperintense optic nerve signal in at least 1 optic nerve segment on 3D DIR (Fig 3).
FIG 1. On 3D DIR, bilaterally normal hypointense retrobulbar (A), canalicular (B), and prechiasmatic (C) optic nerve segments and a nor-mal hypointense chiasm (D). The normal nerve segments are marked withwhite arrows. The normal hypointense retrobulbar optic nerve is surrounded by an isointense nerve sheath on 3D DIR (A).
[image:3.594.53.378.65.142.2]FIG 2. Hyperintense susceptibility artifacts (white arrowheads) at the air-bone interface next to the canalicular nerve segments (A) and next to the prechiasmatic nerve segments (B). Optic nerve segments are marked withwhite arrows.
Table 2:values and their confidence intervals for 3D DIR, based on nerve segments in the group of patients with MS
3D DIR (No. of Valid Cases)
Symmetric Measures Value
MoA () Asymp.SEa
Approx.
Tb
Approx. Sig.
Exact
Sig. 95% CI
Retrobulbar (190) .942 .023 15.091 .000 .000 0.896–0.987
Canalicular (190) 1.000 .000 15.891 .000 .000 1.000–1.000
Prechiasmatic (190) .704 .065 13.886 .000 .000 0.576–0.832
Chiasm (95) .918 .081 10.084 .000 .000 0.759–1.077
Note:—MoA indicates measure of agreement; asymp. SE, asymptomatic standard error; approx., approximative; sig., significance.
aNot assuming the null hypothesis. b
[image:3.594.52.378.208.266.2]Using the asymptomatic SE assuming the null hypothesis.
Table 3:values and their confidence intervals for 3D DIR, in the group of patients with MS in all 665 nerve segments combined
3D DIR
Symmetric Measures Value
MoA ()
Asymp. SEa
Approx.
Tb
Approx. Sig.
Exact
Sig. 95% CI
665 Valid cases (all nerve segments)
.931 .015 29.761 .000 .000 0.901–0.961
Note:—MoA indicates measure of agreement; asymp. SE, asymptomatic standard error; approx., approximative; sig., significance.
a
Not assuming the null hypothesis.
[image:3.594.54.285.317.515.2] [image:3.594.54.284.588.686.2]DISCUSSION
The optic system comprises 4 different optic nerve segments, namely the retrobulbar, canalicular, and prechiasmatic segments and the chiasm.23,42An analysis of the signal intensity of the
dif-ferent optic nerve segments in a comparison group without any known optic nerve pathology showed that these 4 optic nerve segments presented with hypointensity on 3D DIR compared with the signal intensity of the directly adjacent lateral rectus mus-cle. This finding allowed us to define optic nerve segments in patients in the comparison group as hypointense on 3D DIR. A meningeal sheath that presented as an isointense circular rim around the hypointense optic nerve on 3D DIR surrounded the retrobulbar optic nerve segment.42
The signal-intensity rating of the different optic nerve seg-ments could be easily performed by visual inspection by both inexperienced readers and expert readers, leading to very good interoberserver reliability in our study. The inexperienced stu-dent readers were able to perform a correct rating of the signal intensity of the different nerve segments on 3D DIR in 97% of all nerve segments based on avalue of⬎0.8 in the Cohen inter-observer agreement test. Therefore, the 3D DIR sequence allows recognizing signal intensity changes in optic nerve segments even if the reader is not an experienced neuroradiologist. Differences in
the signal-intensity rating between the student group and the expert reader could be explained by 2 possibilities: First, hyperintense susceptibility arti-facts at the skull base common on 3D DIR were present in 57% of all examina-tions (in both the comparison group and the group of patients with MS) in various intensities and obscured the cor-rect identification of 12 prechiasmatic nerve segments and 1 chiasm for the student readers and pre-vented accurate signal-intensity analysis of these nerve segments on 3D DIR for the unexperienced readers.10No artifacts were
observed along the retrobulbar and the canalicular nerve seg-ments on 3D DIR.
Second, a prominent isointense optic nerve sheath masked the central hypointense optic nerve segment on 3D DIR and was therefore confused with increased signal intensity of the retrobul-bar optic nerve itself in 6 retrobulretrobul-bar nerve segments, leading to an incorrect pathologic signal-intensity rating in the student reader group.
Acute optic neuritis is easily diagnosed by contrast enhance-ment on T1-weighted fat-suppressed images and T2-weighted hy-perintensity on fat-suppressed T2-weighted FSE images and FLAIR images10,24-26,30-31,34,35or by hypersignal on 3D DIR,10for
the 3D DIR sequence suppresses fat, white matter, and fluid and gives optimal contrast between a pathologic hyperintense lesion and the surrounding suppressed background.10
The diagnosis of subclinical optic nerve demyelination, how-ever, is challenging on MR imaging. Contrast enhancement of the optic nerve segments on T1-weighted MR images is absent. Slight optic nerve atrophy is possible.37It has been reported that a
signal intensity increase of optic nerve segments in subclinical demyelination can be demonstrated on T2-weighted FSE se-quences with fat suppression and on STIR T2-weighted im-ages, and there are also rare reports of optic nerve hypersignal on FLAIR sequences.23,32,34
In a very recent study of 25 patients with MS, an optic nerve hypersignal was found on 3D DIR in 38.5% of optic nerves with-out a history of previous optic neuritis.36Our systematic
investi-gation of the reliability of the 3D DIR sequence in the detection of subclinical optic nerve demyelination in a large group of patients with MS without clinically obvious visual symptoms and without any previous history of optic nerve neuritis within the last 3 years showed an even higher percentage of pathologic hypersignal in optic nerves in 78% of patients. Only 28% of all patients in the MS group did not present with an increased signal intensity in the optic system on 3D DIR. Therefore, a high value of the 3D DIR sequence in the diagnosis of subclinical optic nerve demyelination can be suspected according to the results of our study. Moreover, the 3D DIR sequence has the great advantage of being easily read even by inexperienced readers who are not routinely assessing neuroradiologic examinations. Thus, in patients with MS, a hy-persignal in an optic nerve segment on 3D DIR that is different from a hypointense optic nerve signal in the comparison group should be considered pathologic.
The presence of a 3D DIR hypersignal in 78% of visually
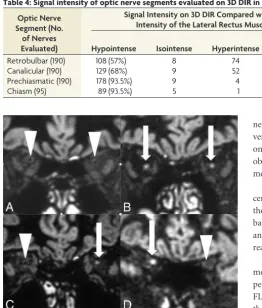
[image:4.594.51.314.49.357.2]FIG 3. On 3D DIR, bilateral normal hypointense retrobulbar nerve segments (A) are compared with bilateral pathologic hyperintense retrobulbar nerve segments (B), with a unilateral pathologic hyperin-tense retrobulbar nerve segment on the left side (C) and a unilat-eral pathologic hyperintense canalicular nerve segment on the right side (D) in 3 different asymptomatic patients with MS. The hyperintense optic nerve segments are marked withwhite arrows. The normal hypointense optic nerve segments are marked with white arrowheads.
Table 4: Signal intensity of optic nerve segments evaluated on 3D DIR in patients with MS
Optic Nerve Segment (No.
of Nerves Evaluated)
Signal Intensity on 3D DIR Compared with Signal Intensity of the Lateral Rectus Muscle (%)
Hypointense Isointense Hyperintense
Isointense or Hyperintense
Retrobulbar (190) 108 (57%) 8 74 82 (43%)
Canalicular (190) 129 (68%) 9 52 61 (32%)
Prechiasmatic (190) 178 (93.5%) 9 4 13 (6.5%)
asymptomatic patients with MS in our study also correlates very well with the results of postmortem and clinical studies that have already shown the high percentage of subclinical optic nerve demyelination with ongoing axonal loss in patients with MS.25,36,38-41The high percentage of optic nerve hypersignal on
DIR in the retrobulbar nerve segments in 43% and in the canalic-ular nerve segments in 32% of the patients with MS but with only rare hypersignal in the prechiasmatic segment and the chiasm in 6.5% of patients with MS correlates with the distribution of acute demyelinating lesions in optic nerves.26,30In postmortem studies,
however, chronic demyelinating lesions are very common, not only in retrobulbar and canalicular but also in intracranial nerve segments.30,38,39Evidently, the evaluation of demyelination in
in-tracranial nerve segments on MR imaging seems to be difficult with the MR images currently available. This subclinical optic nerve demyelination occurs with or without previous clinical ep-isodes of acute optic neuritis.36,38-41,43-45The ongoing axonal loss
correlates with functional disability and quality of life in these patients.14-17,36,46-48
However, we cannot be sure whether our patients with MS who were visually asymptomatic had subtle visual deficits that would have been obvious only by special visual testing (visual-evoked potentials, optical coherence tomography, visual disabil-ity evaluation36), for our patients had not been specifically
exam-ined before the MR imaging examination. Additionally, a possible episode of acute optic neuritis in the years before the 3 years in-cluded in our study design could have been possible. Thus, subtle visual deficits may have gone undetected in our study, and further studies combining radiologic findings of DIR hypersignal within optic nerve segments and clinical correlation based on specific visual testing with visual evoked potentials and optical coherence tomography and visual disability testing36are mandatory.
There are several limitations to this study. First, the main one is that optic nerve signal intensity was not assessed with a standard sequence, specifically the STIR T2WI sequence of the orbits. As a result, the sensitivity and specificity of the 3D DIR sequence could not be evaluated.
Second, we have assumed that a signal-intensity increase in different optic nerve segments, based on hypersignal of optic nerve segments on 3D DIR compared with the signal intensity of the lateral rectus muscle, was always pathologic because of the hyposignal of optic nerve segments in 50 patients in the compar-ison group. This assumption may be wrong.
Third, the hypersignal of different optic nerve segments on 3D DIR in patients with MS was always related to possible subclinical optic nerve demyelination, even though it also could have been caused by other concomitant disease processes such as, for exam-ple, ischemic optic neuropathy.
Fourth, it has been assumed that subclinical optic nerve demy-elination always leads to hypersignal of optic nerve segments on 3D DIR. However, we did not know whether subclinical nerve demyelination could also go undetected on 3D DIR.
Fifth, a correlation between hypersignal of optic nerve seg-ments on 3D DIR and histologic findings and specific visual test-ing as mentioned above had not been performed.
Sixth, the patients in the comparison group evaluated for ep-ileptic seizures or posttraumatic sequelae might also have had
subclinical optic nerve damage and thus did not really represent a reliable control group.
CONCLUSIONS
Compared with hypointense optic nerve segments in patients without MS, in 72% of clinically asymptomatic patients with MS, 3D DIR showed hypersignal in at least 1 optic nerve segment. We have speculated about whether the hypersignal of the different optic nerve segments on 3D DIR in the group of patients with MS was related to subclinical optic nerve demyelination. The signal intensity of the different optic nerve segments could easily and reliably be determined on 3D DIR by both inexperienced and expert readers; therefore, evaluation of subclinical optic nerve pa-thology in patients with MS can also be performed without an experienced neuroradiologist.
ACKNOWLEDGMENTS
Statistical tests were performed by Nicole Tracy Graf, Graf Bio-statistics, Winterthur, Switzerland.
Disclosures: Simon Rauch—UNRELATED:Employment: Kantonsspital Winterthur Hospital.
REFERENCES
1. Wattjes MP, Rovira A`, Miller D, et al; MAGNIMS study group. Evi-dence-based guidelines: MAGNIMS consensus guidelines on the use of MRI in multiple sclerosis— establishing disease prognosis and monitoring patients.Nat Rev Neurol2015;11:597– 606CrossRef Medline
2. Polman CH, Reingold SC, Edan G, et al.Diagnostic criteria for mul-tiple sclerosis: 2005 revisions to the “McDonald Criteria.”Ann Neu-rol2005;58:840 – 46CrossRef Medline
3. Polman CH, Reingold SC, Banwell B, et al.Diagnostic criteria for multiple sclerosis: 2010 revisions to the McDonald criteria.Ann Neurol2011;69:292–302CrossRef Medline
4. Swanton JK, Rovira A, Tintore M, et al.MRI criteria for multiple sclerosis in patients presenting with clinically isolated syndromes: a multicentre retrospective study.Lancet Neurol2007;6:677– 86
CrossRef Medline
5. McDonald WI, Compston A, Edan G, et al.Recommended diagnos-tic criteria for multiple sclerosis: guidelines from the International Panel on the diagnosis of multiple sclerosis.Ann Neurol2001;50: 121–27CrossRef Medline
6. Geurts JJ, Pouwels PJ, Uitdehaag BM, et al.Intracortical lesions in multiple sclerosis: improved detection with 3D double inver-sion-recovery MR imaging.Radiology2005;236:254 – 60CrossRef Medline
7. Simon B, Schmidt S, Lukas C, et al.Improved in vivo detection of cortical lesions in multiple sclerosis using double inversion recov-ery MR imaging at 3 Tesla.Eur Radiol2010;20:1675– 83CrossRef Medline
8. Coebergh JA, Roosendaal SD, Polman CH, et al.Acute severe mem-ory impairment as a presenting symptom of multiple sclerosis: a clinical case study with 3D double inversion recovery MR imaging.
Mult Scler2010;16:1521–24CrossRef Medline
9. Wattjes MP, Lutterbey GG, Gieseke J, et al.Double inversion recov-ery brain imaging at 3T: diagnostic value in the detection of multi-ple sclerosis lesions.AJNR Am J Neuroradiol2007;28:54 – 49Medline
10. Hodel J, Outteryck O, Bocher AL, et al.Comparison of 3D double inversion recovery and 2D STIR FLAIR MR sequences for the imag-ing of optic neuritis: pilot study. Eur Radiol 2014;24:3069 –75
CrossRef Medline
12. Foroozan R, Buono LM, Savino PJ, et al.Acute demyelinating optic neuritis.Curr Opin Ophthalmol2002;13:375– 80CrossRef Medline
13. Frohman EM, Frohman TC, Zee DS, et al.The neuro-ophthalmol-ogy of multiple sclerosis.Lancet Neurol 2005;4:111–21CrossRef Medline
14. Hickman SJ, Toosy AT, Miszkiel KA, et al.Visual recovery following acute optic neuritis: a clinical, electrophysiological and magnetic resonance imaging study.J Neurol2004;251:996 –1005Medline
15. Beck RW, Gal RL, Bhatti MT, et al; Optic Neuritis Study Group.
Visual function more than 10 years after optic neuritis: experience of the optic neuritis treatment trial.Am J Ophthalmol2004;137: 77– 83CrossRef Medline
16. Brusa A, Jones SJ, Plant GT.Long-term remyelination after optic neuritis: a 2-year visual evoked potential and psychophysical serial study.Brain2001;124:468 –79CrossRef Medline
17. Cleary PA, Beck RW, Bourque LB, et al.Visual symptoms after optic neuritis: results from the Optic Neuritis Treatment Trial.J Neu-roophthalmol1997;17:18 –23; quiz 24 –28Medline
18. Guy J, Mao J, Bidgood WD Jr, et al.Enhancement and demyelination of the intraorbital optic nerve: fat suppression magnetic resonance imaging.Ophthalmology1992;99:713–19CrossRef Medline
19. Guy J, Fitzsimmons J, Ellis EA, et al.Intraorbital optic nerve and experimental optic neuritis: correlation of fat suppression mag-netic resonance imaging and electron microscopy.Ophthalmology 1992;99:720 –25CrossRef Medline
20. Hendrix L, Kneeland JB, Haugthon VM, et al.MR imaging of optic nerve lesions: value of gadopentetate dimeglumine and fat-suppression technique.AJR Am J Roentegenol1990;155:849 –54CrossRef Medline
21. Johnson G, Miller DH, MacManus D, et al.STIR sequences in NMR imaging of the optic nerve.Neuroradiology1987;29:238 – 45CrossRef Medline
22. Sartoretti-Schefer S, Wichmann W, Valavanis A.Optic neuritis: characteristic magnetic resonance features and differential diagno-sis.Int J Neuroradiol1997;3:417–27
23. Gala F.Magnetic resonance imaging of optic nerve.Indian J Radiol Imaging2015;25:421–38CrossRef Medline
24. Rizzo JF 3rd, Andreoli CM, Rabinov JD.Use of magnetic resonance imaging to differentiate optic neuritis and nonarteritic anterior isch-emic optic neuropathy.Ophthalmology2002;109:1679 – 84CrossRef Medline
25. Rocca MA, Hickman SJ, Bo¨ L, et al.Imaging the optic nerve in mul-tiple sclerosis.Mult Scler2005;11:537– 41CrossRef Medline
26. Kupersmith MJ, Alban T, Zeiffer B, et al.Contrast-enhanced MRI in acute optic neuritis: relationship to visual performance.Brain2002; 125:812–22CrossRef Medline
27. Hickman SJ, Miszkiel KA, Plant GT, et al.The optic nerve sheath on MRI in acute optic neuritis.Neuroradiology2005;47:51–55CrossRef Medline
28. Youl BD, Turano G, Towell AD, et al.Optic neuritis: swelling and atrophy.Electroencephalogr Clin Neurophysiol Suppl1996;46:173–79
Medline
29. Youl BD, Turano G, Miller DH, et al.The pathophysiology of acute optic neuritis: an association of gadolinium leakage with clinical and electrophysiological deficits.Brain1991;114:2437–50CrossRef Medline
30. Miller DH, Newton MR, van der Poel JC, et al.Magnetic resonance imaging of the optic nerve in optic neuritis.Neurology1988;38: 175–79CrossRef Medline
31. Jackson A, Sheppard S, Laitt RD, et al.Optic neuritis: MR imaging with combined fat- and water-suppression techniques.Radiology 1998;206:57– 63CrossRef Medline
32. Davies MB, Williams R, Haq N, et al.MRI of optic nerve and postchias-mal visual pathways and visual evoked potentials in secondary pro-gressive multiple sclerosis.Neuroradiology1998;40:765–70CrossRef Medline
33. Katdare A, Ursekar M.Systematic imaging review: multiple sclerosis.
Ann Indian Acad Neurol2015;18(suppl 1):S24 –29CrossRef Medline
34. Aiken AH, Mukherjee P, Green AJ, et al.MR imaging of optic neu-ropathy with extended echo-train acquisition fluid-attenuated in-version recovery.AJNR Am J Neuroradiol2011;32:301– 05CrossRef Medline
35. McKinney AM, Lohman BD, Sarikaya B, et al.Accuracy of routine fat-suppressed FLAIR and diffusion-weighted images in detecting clinically evident acute optic neuritis.Acta Radiol2013;54:455– 61
CrossRef Medline
36. Hadhoum N, Hodel J, Defoort-Dhellemmes S, et al.Length of optic nerve double inversion recovery hypersignal is associated with ret-inal axonal loss.Mult Scler J2016;22:649 –58CrossRef Medline
37. Tur C, Goodkin O, Altmann DR, et al.Longitudinal evidence for anterograde trans-synaptic degeneration after optic neuritis.Brain 2016;139:816 –28CrossRef Medline
38. Ikuta F, Zimmerman HM.Distribution of plaques in seventy au-topsy cases of multiple sclerosis in the United States.Neurology 1976;26:26 –28CrossRef Medline
39. Toussaint D, Pe´rier O, Verstappen A, et al.Clinicopathological study of the visual pathways, eyes, and cerebral hemispheres in 32 cases of dis-seminated sclerosis.J Clin Neuroophthalmol1983;3:211–20CrossRef Medline
40. Frohman EM, Costello F, Stu¨ve O, et al.Modeling axonal degenera-tion within the anterior visual system: implicadegenera-tions for demon-strating neuroprotection in multiple sclerosis.Arch Neurol2008;65: 26 –35Medline
41. Frohman EM, Fujimoto JG, Frohman TC, et al.Optical coherence tomography: a window into the mechanisms of multiple sclerosis.
Nat Clin Pract Neurol2008;4:664 –75Medline
42. Hayreh SS.Structure of the optic nerve.In: Hayreh SS, ed.Ischemic Optic Neuropathies. Heidelberg: Springer; 2011:7–34
43. Lamirel C, Newman NJ, Biousse V.Optical coherence tomography (OCT) in optic neuritis and multiple sclerosis.Rev Neurol (Paris) 2010;166:978 – 86CrossRef Medline
44. Thrower BW.Clinically isolated syndromes: predicting and delay-ing multiple sclerosis.Neurology2007;68:S12–25CrossRef Medline
45. Frise´n L, Hoyt WF.Insidious atrophy of retinal nerve fibers in multiple sclerosis: funduscopic identification in patients with and without vi-sual complaints.Arch Ophthalmol1974;92:91–97CrossRef Medline
46. Bambo MP, Garcia-Martin E, Perez-Olivan S, et al.Detecting optic atrophy in multiple sclerosis patients using new colorimetric anal-ysis software: from idea to application.Semin Ophthalmol2016;31: 459 – 62CrossRef Medline
47. Garcia-Martin E, Rodriguez-Mena D, Herrero R, et al. Neuro-oph-thalmologic evaluation, quality of life and functional disability in patients with MS.Neurology2013;81:76 – 83CrossRef Medline