CLINICAL APPLICATIONS OF RETINAL OXIMETRY AND FLUORESCEIN ANGIOGRAPHY TO DIABETIC RETINOPATHY
Teresa Martz
Honors Thesis Department of Biology
University of North Carolina, Chapel Hill May 2015
Approved: _______________________________ Research Advisor: ________________________
Dr. Seema Garg, M.D., Ph.D.
Research Sponsor: ________________________
ABSTRACT
Diabetic retinopathy (DR) is a disease caused by damage to retinal blood vessels as a
result of chronic hyperglycemia, and thus has been linked to blood supply deprivation in
certain retinal areas. My study aimed to determine whether quantitative analysis of retinal
imaging methods could effectively evaluate DR patients. Retinal oximetry (RO), a new
modality to determine relative retinal vessel oxyhemoglobin saturation, and intravenous
fluorescein angiography (IVFA), which demonstrates patterns of retinal blood flow, were
quantitatively analyzed for 27 healthy and 60 diabetic patients with a range of DR severity
as determined qualitatively by clinicians. RO results showed a relationship between
increased DR severity and higher oxygenation levels in retinal vessels, and IVFA results
showed a similar correlation with increased DR severity and increased tissue
ischemia. These results suggest decreased oxygen delivery to retinal tissue as DR severity
increases. In the future, quantitative IVFA and RO may be used for risk stratification in DR
diagnosis in asymptomatic patients at risk for vision loss from DR.
INTRODUCTION
Diabetic Retinopathy:
Diabetes mellitus (DM) is a disease in which a person has chronic hyperglycemia,
which, over time, can cause microvascular damage in multiple organ systems including the
retina. Diabetic retinopathy (DR) has four stages, the first three of which are categorized as
nonproliferative diabetic retinopathy (NPDR). Microaneurysms form in mild NPDR,
followed by blood vessel blockage in moderate NPDR, and greater vessel blockage and
of fluid from blood into the center of the retina) or macular ischemia (loss of blood supply).
The most advanced stage of DR, proliferative retinopathy (PDR), is marked by the growth
of new, fragile, abnormal blood vessels on the retina, which can leak blood into the vitreous
humor and lead to even more severely blurred vision.1 Beginning in early stages of DR,
endothelial damage causes blood vessel walls to weaken; some vessels dilate and other
close. This leads to alterations in retinal blood flow, which subsequently affects
oxygenation in the retina. DR is first treated by controlling diabetes systemically, that is,
encouraging the patient to maintain normal blood glucose and blood pressure levels.
NPDR without macular edema is not necessarily treated but is observed closely. NPDR
must be identified early in order to minimize further disease development and adverse
vision effects. To reduce the risk of vision loss, macular edema is treated with intravitreal
anti-‐VEGF medications +/-‐ focal laser surgery, and PDR is treated with scatter laser
photocoagulation or vitrectomy surgery.1
Retinal Oximetry:
Inner retina hypoxia as a result of blood supply deprivation has been linked to
diabetic retinopathy in various studies.2,3,4 It is further suggested that poor oxygen
distribution in the retina of DR patients leads to high SO2 (oxygen saturation) in retinal
blood vessels.2,5 However, constraints in non-‐invasive measurement techniques have
limited the understanding of this relationship. As such, retinal oximetry may prove to be a
valuable tool in evaluating the relationship between retinal oxygenation and DR by
allowing precise quantitative measurements of retinal vessel oxygenation.
The retinal oximeter consists of a fundus camera with an attached image splitter, as
the original beam from the fundus image into four smaller beams based on wavelengths of
light, which are further filtered by different narrow band-‐pass filters in each of the four
channels. In this study, two distinct wavelengths were used: one sensitive to
oxyhemoglobin at 600 nm and one not sensitive to oxyhemoglobin at 570 nm.6 Computer
software (Oxymap Analyzer Software, version 2.3.2; Oxymap ehf., Reykjavik, Iceland)
detects retinal vessels and uses relative light intensities inside and outside a vessel to
calculate relative vessel oxygenation. The optical density (OD) of a vessel is a measure of
the blood’s light absorbance, calculated using a ratio of light intensity inside and outside of
a vessel. The hemoglobin oxygen saturation (SO2) of a vessel can be calculated using this
information, as the optical density ratio (ODR) of ODs at specific wavelengths has been
shown to have an approximately inverse linear relationship with SO2. RO software color-‐
codes the vessels and the rest of the fundus image based on an oxygen saturation scale.
The software also allows the user to automatically select vessels in the fundus image, and
aggregates pixel measurements to yield measurements for vessel SO2, as well as data on
oxygen partial pressure and vessel width. 7 RO thus allows for a non-‐invasive approach that
can provide detailed information on retinal oxygenation, indicating significant diagnostic
promise in the clinical setting for conditions that alter retinal oxygenation such as diabetic
retinopathy, retinal vein occlusions, 8,9 and glaucoma9,10.
Research on RO and DR is now underway, and early RO analysis of blood vessels
indicates that patients with DR in general have higher vessel SO2 levels than healthy
subjects.3,4,5,11 These results may indicate decreased oxygen delivery or decreased oxygen
such, analysis correlating retinal vessel oxygenation with increasing severity of DR may
yield further information towards understanding this relationship.
Fluorescein Angiography:
Intravenous fluorescein angiography (IVFA) is a diagnostic tool used to visualize
blood flow in the retina. The photographic equipment consists of a motorized fundus
camera that can capture rapid sequential images, as well as an excitation filter. The
capturing of images is preceded by the intravenous injection of a sodium fluorescein dye
that becomes luminescent when excited by certain wavelengths of light (between 465 and
490 nm). The camera then captures fundus images in rapid sequence to allow the
visualization of blood flow through the retina and choroid, with the excited dye indicating
the flow of blood. Physicians can then use these images to visualize abnormalities in the
progression of blood flow compared to that of a normal eye by looking for blockages in
fluorescein flow, abnormal presence of fluorescein, or unusual concentrations or speeds of
transmission of fluorescein.13 IVFA is a current standard diagnostic imaging tool for
diagnosing DR severity. The diagnostic utility of the IVFA is typically focused on
observable microaneurysms, hemorrhages, and neovascularization in the fluorescent
images.14 IVFA has further been used to examine the pathogenesis of DR, demonstrating
the phenomenon of capillary shunting around areas of non-‐perfusion.15
While IVFA has been primarily used as a qualitative diagnostic tool for DR, this
study explored the potential use of quantitative information on retinal oxygenation.16
IVFA shows retinal blood flow, and as such, ischemic areas, or lack of blood flow, are
indicated by areas of non-‐perfusion by the fluorescein dye. Analyzing the ischemic ratio,
quantitative measurement for retinal perfusion and thus oxygenation.17 This quantitative
approach may yield more information on the relationship between DR severity and retinal
oxygenation.
My Study:
The study aims to further the understanding of the relationship between diabetic
retinopathy and retinal oxygenation by quantifying changes in retinal oxygenation with DR
disease stage using RO as well as quantitatively comparing retinal oxygenation and
ischemia using IVFA. I hypothesize that there is a correlation between increasing severity
of DR and both increasing retinal vessel oxygenation and increasing retinal tissue ischemia.
This result would reflect the processes of thickened retinal vessel walls in diabetics, as well
as retinal capillary shunting, in which capillary networks are circumvented and less oxygen
is provided to tissue.15 Both mechanisms would likely reduce the amount of oxygen
delivered to retinal tissues, leading to hypoxia of the retinal tissue and hyperoxia of retinal
vessels. Quantitative examination of oximetry among DR disease stages is vital because
early RO studies have not yet fully addressed the relationship between increasing severity
of DR and retinal vessel oxygenation. Additionally, in developing a standardized method
for IVFA analysis of retinal tissue ischemia, the study will allow for a greater understanding
of retinal blood flow and ischemia in relation to distinct stages of DR. Correlating RO and
IVFA results will yield further information about whether retinal vessel hyperoxia and
retinal tissue hypoxia are related processes as DR progresses. Understanding DR’s effect on
oxygenation and vasculature as the disease advances may lead to improvements in both
METHODS
A) Subjects
Eighty-‐seven patients were enrolled in this study from the University of North
Carolina (UNC) Department of Ophthalmology clinics. The study protocol was approved
by the UNC Institutional Review Board, with 27 patients as healthy controls and 60 patients
with Type I or Type II diabetes. Healthy patients were enrolled from the general
ophthalmology clinic on routine check-‐ups. Diabetic patients were enrolled with the
following clinical diagnoses: no DR (n = 16), mild NPDR (n = 6), moderate NPDR (n = 14),
severe NPDR (n=7), or PDR (n=17). Inclusion criteria were: patients at least 18 years of
age with Type I or Type II diabetes. Ophthalmologic exclusion criteria were: history of
retinal vascular occlusions, glaucoma, macular degeneration, conditions with a media
opacity such as dense cataracts or severe hemorrhaging that may obscure retinal
photography, or prior vitrectomy or laser photocoagulation. Medical exclusion criteria
were: severe respiratory disease (e.g. COPD), severe anemia, or sickle cell anemia.
Exclusion criteria for diabetic patients that are contraindications for fluorescein dye (used
in IVFA) were: cardiovascular event within 2
years, severe congestive heart failure, or
chronic renal failure. Patients were enrolled
after giving informed consent.
Retinal Oximetry
Image Acquisition:
Prior to image capture, patients’ eyes
were dilated with one drop each of 1%
A
B
C
tropicamide and 2.5% phenylephrine. Ophthalmic photographers obtained images of both
eyes with the Oxymap T1 system (Oxymap T1 device connected to Topcon TRC50-‐DX
fundus camera; Oxymap ehf., Reykjavik, Iceland) (Figure 1).18 The device captures images
at two distinct wavelengths, one sensitive to oxyhemoglobin (600 nm) and one isosbestic
(570 nm), where the absorption spectra of oxyhemoglobin and hemoglobin cross. The
images are each 1200 x 1600 pixels and cover a 50–degree angle of the retina, and were
centered on the optic disc.
Image Processing:
For each patient, one eye was randomly selected for analysis. Images were analyzed
with the Oxymap Analyzer software (version 2.3.2), which automatically detects vessels
greater than 8 pixels in diameter, using the ring-‐method protocol previously established by
this research group (Figure 2).19
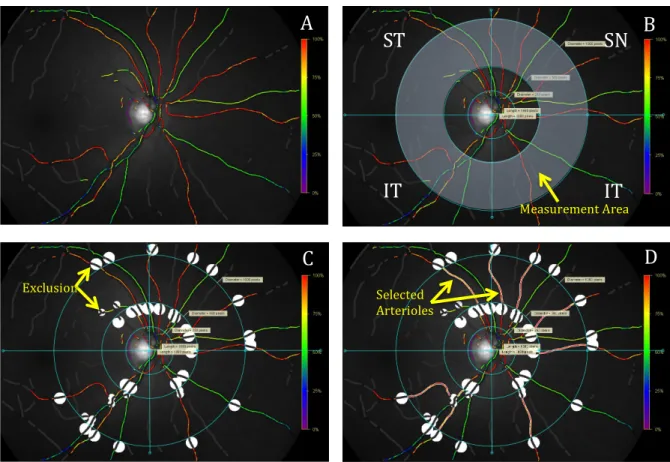
The optic disc was excluded with a circle 250 pixels in diameter. Two additional
circles with the same central point were applied with two and four times the diameter of
the optic disc exclusion circle. Only the area between these two circles was used for
analysis, with area within the inner circle excluded. Using the center of the optic disc as the
central point, perpendicular lines were drawn to separate the image into four quadrants:
superonasal (SN), inferonasal (IN), superotemporal (ST), and inferotemporal (IT).
Exclusion of vessels beyond the diameter of the third circle and within the diameter of the
second circle was implemented with a 31-‐pixel border. 19-‐pixel circles were as used to
exclude certain areas where vessel detection would prove inaccurate (branching,
Vessels to be measured were selected manually. Measurements were first taken to
yield arteriolar SO2 (SaO2) by quadrant, starting with arterioles in the ST quadrant.
Arterioles were subsequently selected in the IT, IN and SN quadrants, and then globally to
measure the average SaO2 for the image. These steps were repeated for venules to yield
venular SO2 (SvO2) by quadrant and globally. As Oxymap software delivers measurements
calibrated to healthy young individuals, results are relative to that calibration, occasionally
allowing for SO2 measurements greater than 100%. These values were not truncated to
100% as physiology would infer, per established oximetry protocol.3,4
ST
IT
SN
IT
A
B
C
D
Measurement Area
Exclusion Selected
Arterioles
B) IV Fluorescein Angiogram
Image Acquisition:
DR patients were taken
directly to the ultra-‐widefield
scanning laser ophthalmoscope
(Optos 200 Tx; Optos plc.,
Queensferry House, Scotland,
UK) (Figure 3) following
oximetry image capture. Color
fundus photographs were
obtained of both eyes. Sodium Fluorescein (5 cc) was injected intravenously by a
physician. IVFA images were first captured on the transit eye indicated by the physician
and the imaging sequence continued according to clinic protocol. In this study, the IVFA
image with optimal perfusion of dye (about 40-‐50 seconds after injection) was used for
analysis, and the corresponding color image was used to aid in detecting blood flow
abnormalities.
Image Processing:
For each patient, one eye was selected for analysis. This selection was the same eye
analyzed for RO except in the case of image acquisition complications. In order to mask the
analysis and increase objectivity, the selected analysis images and corresponding reference
color fundus images were de-‐identified by a third party, unaware of the DR status of the
patient and the RO results.
A
B
C
IVFA images were analyzed using ImageJ Software (Version 1.48v; U.S. NIH,
Bethesda, Maryland) (Figure 4). Quadrant lines were transferred from RO analysis images.
An ellipse was drawn to delineate the analysis area, capturing the optimal area of retina
with dye perfusion (approximately 4.2 megapixel area). Pixel area measurements were
obtained for the ellipse and each of the four quadrants. Ischemic areas were manually
selected in each quadrant and area measurements were recorded.
C) Statistical Analyses
Statistical analyses were implemented with SPSS software (version 20.0; SPSS, Inc.,
Chicago, IL). For retinal oximetry, one-‐way analysis of variance (ANOVA) was used to test
the significance of difference in retinal oxygenation between each DR stage. This test was
repeated for fluorescein angiography analysis results to test the significance of difference
in ischemic ratio between each DR stage. Pearson’s two-‐tailed correlation test was used to
A
B
C
D
Figure 4. (A) Fluorescein angiogram image opened in ImageJ software. (B) Quadrants and ellipse in place. (C) Ischemic areas indicated with yellow arrows. (D) Selections of ischemic areas outlined in yellow for pixel measurement.
ST
IT
IN
assess the association between the two imaging methods by patient, correlating both SaO2
and SvO2 with ischemic ratio.
RESULTS
Demographic data for all study patients is displayed in Table 1, including group
sample size, age, and marker of diabetes control (HbA1c).
Table 1. Demographic data for study patients.
Group Value Normal (n=27) Age (years) 56 ± 10 History of hypertension, # of patients (%) 8 (30) DM w/o DR (n=16) Age (years) 59 ± 9 History of hypertension, # of patients (%) 15 (94) Hemoglobin A1c (%) 7.7 ± 2.4 Mild NPDR (n=6)
Age (years) 58 ± 19 History of hypertension, # of patients (%) 4 (67) Hemoglobin A1c (%) 7.6 ± 1.2 Moderate NPDR (n=14)
Age (years) 53 ± 10 History of hypertension, # of patients (%) 13 (93) Hemoglobin A1c (%) 8.5 ± 2.2 Severe NPDR (n=7)
Age (years) 53 ± 11 History of hypertension, # of patients (%) 5 (83) Hemoglobin A1c (%) 8.1 ± 1.3 PDR (n=17)
Retinal oximetry images opened in Oxymap are displayed in Figure 5 for a normal
patient (A) and a PDR patient (B). Arterioles appear mostly red in both images,
representing oxygen saturation of approximately 90-‐100%. The normal patient has many
yellow areas interspersed, indicating oxygen saturation of approximately 75% and yielding
a lower overall SaO2. The difference in venular SO2 is more apparent, with the normal
patient showing a fairly consistent SO2 of approximately 50% as indicated by green
coloration (A). The PDR patient, in contrast, shows increased SvO2, with coloration ranging
from green to dark orange (approximately 50-‐95%) (B).
In general, global SaO2 and SvO2 values increased with increasing DR severity. Table
2 summarizes global retinal vessel oxygenation values by DR stage. Global SaO2 values
tended to increase with increasing DR severity: normal 91 ± 4%; DM without DR 89 ± 8%;
mild NPDR 92 ± 11%; moderate NPDR 93 ± 5%; severe NPDR 96 ± 14%; PDR 100 ± 7%
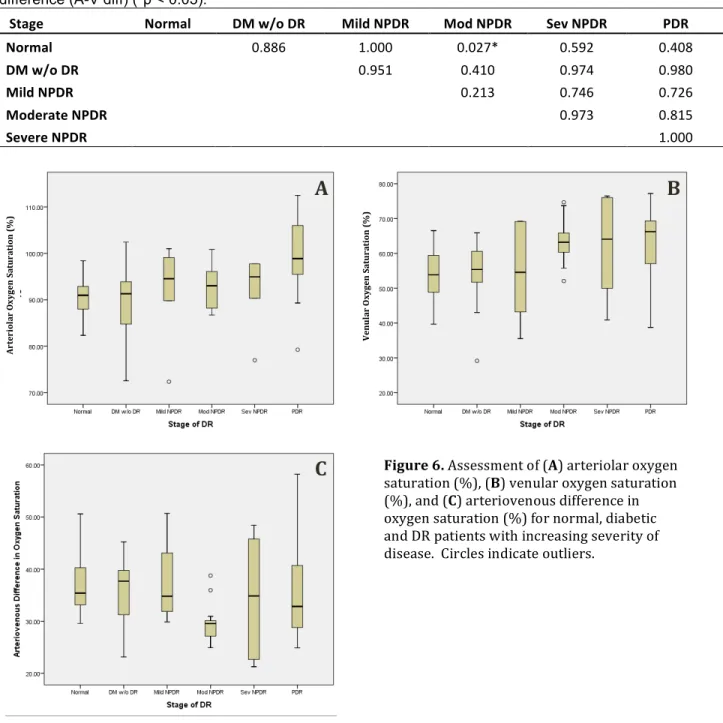
(Figure 6A). Global SvO2 values also tended to increase with increasing DR severity:
normal 53 ± 6%; DM without DR 53 ± 10%; mild NPDR 53 ± 14%; moderate NPDR 62 ±
6%; severe NPDR 63 ± 13%; PDR 66 ± 11% (Figure 6B). Pair-‐wise ANOVA indicated a
statistically significant increase in SaO2 in PDR patients compared to normal patients
Figure 5. Oxymap images for (A) a healthy and (B) a PDR patient. As indicated by the oxygen
(p=0.003) and diabetic patients without DR (p=0.001). Table 3 lists p-‐values for pair-‐wise
comparison of SaO2 and SvO2 for all groups. By pair-‐wise ANOVA, there was also a
statistically significant increase in SvO2 in moderate NPDR patients compared to normal
patients (p=0.038), as well as in PDR patients compared to normal patients (p<0.000) and
diabetic patients without DR (p=0.004). Pair-‐wise ANOVA also yielded significant increase
in the arteriovenous difference in moderate NPDR patients compared to normal patients
(p=0.027); Table 4 lists arteriovenous difference between all groups. However there was
not a distinct trend in arteriovenous difference with increasing DR severity: normal 38 ±
5%; DM without DR 36 ± 6%; mild NPDR 39 ± 8%; moderate NPDR 31 ± 4%; severe NPDR
33 ± 11%; PDR 34 ± 11% (Figure 6C).
Table 2. Global oxygen saturation values (%) for retinal arterioles, venules, and the arteriovenous difference in oxygen saturation for all patients, given as mean ± s.d. (min to max).
Stage Arterioles (SaO2) Venules (SvO2) Arteriovenous (A-‐V) difference Normal (n=27) 91±4 (82.5 to 100.7) 53±6 (40.9 to 64.9) 38±5 (29.9 to 49.1)
DM w/o DR (n=16) 89±8 (66.8 to 102.0) 53±10 (23.4 to 65.0) 36±6 (24.4 to 43.6) Mild NPDR (n=6) 92±11 (71.5 to 102.4) 53±14 (34.6 to 69.1) 39±8 (30.6 to 52.3) Moderate NPDR (n=14) 93±5 (87.1 to 99.7) 62±6 (53.1 to 74.4) 31±4 (25.3 to 38.1) Severe NPDR (n=7) 96±14 (77.0 to 124.5) 63±13 (40.9 to 76.5) 33±11 (21.3 to 48.4) PDR (n=17) 100±7 (85.3 to 112.5) 66±11 (40.0 to 83.4) 34±11 (20.2 to 58.2)
Table 3. P-values for ANOVA pair-wise comparison using Tukey’s post-hoc test for global venular oxygen saturation (SvO2) and global arteriolar oxygen saturation difference (SaO2) (*p < 0.05).
Stage Normal DM w/o DR Mild NPDR Mod NPDR Sev NPDR PDR Normal
1.000 1.000 0.038* 0.126 0.000* DM w/o DR 0.969
1.000 0.123 0.234 0.004* Mild NPDR 1.000 0.973
0.367 0.425 0.059 Moderate NPDR 0.966 0.725 1.000
1.000 0.886 Severe NPDR 0.558 0.293 0.894 0.931
0.982 PDR 0.003* 0.001* 0.218 0.116 0.887
Upper right: values for global venular oxygen saturation (SvO2); lower left: values for global arteriolar oxygen saturation (SaO2).
Table 4. P-values for ANOVA pair-wise comparison using Tukey’s post-hoc test for global arteriovenous difference (A-V diff) (*p < 0.05).
Stage Normal DM w/o DR Mild NPDR Mod NPDR Sev NPDR PDR Normal
0.886 1.000 0.027* 0.592 0.408 DM w/o DR
0.951 0.410 0.974 0.980 Mild NPDR
0.213 0.746 0.726 Moderate NPDR
0.973 0.815 Severe NPDR
1.000
IVFA images opened in ImageJ software are shown in Figure 7 for a mild NPDR
patient (A) and a PDR patient (B). The mild NPDR patient does not have any significant
areas of ischemia or abnormalities in blood flow (A). The PDR patient has significant blood
flow abnormalities, including noticeable vascular leakage (areas of white outside vessel
Figure 6. Assessment of (A) arteriolar oxygen saturation (%), (B) venular oxygen saturation (%), and (C) arteriovenous difference in oxygen saturation (%) for normal, diabetic and DR patients with increasing severity of disease. Circles indicate outliers.
A
B
C
A rt er io lar
O xy ge n Sa tu ra ti on ( % ) V en u la
r
delineations in the image) and substantial ischemia (indicated in B with yellow arrows).
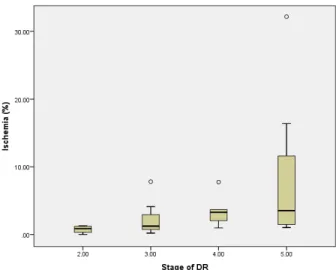
Results from IVFA indicate that percentage of ischemic pixels increased with
increasing DR stage: mild NPDR 0.76 ± 0.6%; moderate NPDR 2.21 ± 2%; severe NPDR 3.50
± 2%; PDR 7.92 ± 9% (Table 5). This trend is displayed in Figure 8. However, pair-‐wise
ANOVA did not yield significance in ischemia between any groups (Table 6). However,
pairwise ANOVA did yield significance in percentage of ischemia between all NPDR patients
(2.31 ± 2%) and PDR patients (7.92 ± 9%) (p=0.017).
Table 5. Global percentage of ischemic pixels in IVFA analysis of DR patients, given as mean ± s.d. (min to max).
Stage Ischemic Pixels (%) Mild NPDR (n=4) 0.76±0.6 (0.00 to 1.29) Mod NPDR (n=9) 2.21±2 (0.21 to 7.81) Sev NPDR (n=6) 3.50±2 (0.98 to 7.74) All NPDR (n=19) 2.31±2 (0.00 to 7.81) PDR (n=12) 7.92±9 (1.03 to 32.17)
Table 6. P-‐values for ANOVA pair-‐wise comparison using Tukey’s post-‐hoc test for percentage of retinal ischemia (p < 0.05).
Stage Mod NPDR Sev NPDR PDR Mild NPDR 0.979 0.900 0.209 Mod NPDR 0.978 0.179
Figure 7. Fluorescein angiogram images for a (A) mild NPDR patient and (B) PDR patient. Yellow arrows indicate significant areas of ischemia in the PDR patient, in contrast with no ischemia in the mild NPDR patient.
A
B
B
The association between global ischemia and global venular oxygen saturation (A)
and global arteriolar oxygen saturation (B) is displayed by scatterplot in Figure 9. Pearson
two-‐tailed correlation analysis indicated significance in the positive correlation between
global SaO2 and percentage of ischemia (p=0.011). While not statistically significant,
Pearson two-‐tailed correlation also indicated a slight positive correlation between global
SvO2 and percentage of ischemia (Table 7).
Table 7. Pearson correlation tests (2-‐tailed) for ischemia and venular oxygen saturation and ischemia and arteriolar oxygen saturation (*p < 0.05).
Ischemia (%) Global SaO2 Pearson Correlation 0.467
Sig. (2-‐tailed) 0.011*
Global SvO2 Pearson Correlation 0.254 Sig. (2-‐tailed) 0.184
DISCUSSION
Summary:
My study demonstrates that retinal oxygenation is altered in late stages of diabetic
retinopathy. I found a significant increase in retinal venular oxygenation in moderate
Figure 9. Scatterplot depicting the relationship of patients’ tissue ischemia (%) and (A) venular oxygen saturation (%) and (B) arteriolar oxygen saturation (%) (n=29).
A
B
A rt er io lar
O xy ge n S at u ra ti on ( % ) V en u la
r
NPDR and PDR patients compared to diabetics without retinopathy and to the normal
controls. I also observed a significant increase in retinal arteriolar oxygenation in PDR
patients compared to diabetics without retinopathy and to the normal control patients.
Additionally, I found an increase in retinal tissue ischemia in PDR patients compared to
NPDR patients.
Retinal Oximetry and Diabetic Retinopathy:
Khoobehi et al.4 reported a similar trend in retinal vessel oxygenation, showing
increasing venous and arterial oxygenation with increasing severity of diabetic
retinopathy. Khoobehi et al. observed increasing vessel oxygenation as disease severity
increased, but only found significance in the comparison of healthy controls to severe
NPDR and PDR groups. Similarly, I observed a similar trend with increasing disease
severity, but only determined significance in the comparison of healthy controls and
diabetics without retinopathy with PDR, as well as the comparison of healthy controls with
moderate NPDR for venular oxygenation. The lack of significance in my comparison of
healthy controls with the severe NPDR group for venular oxygenation may be due to the
small sample size of the severe NPDR group (n=7). A substantial limiting factor in my
study was patient sample size, and small sample sizes for mild NPDR (n=6) and severe
NPDR (n=7) groups likely affected the lack of significance in oxygenation measurements
when comparing those groups. For future analyses, increased sample sizes of all disease
groups could allow better understanding of this relationship. My results are also similar to
Bek21, who observed significantly increased venous and arterial oxygenation with
Jorgensen et al. did not observe a trend of increasing arteriolar oxygenation in non-‐
proliferative stages of retinopathy, but rather a distinct increase in the proliferative stage.
While not accounting for increasing severity of disease, Hardarson11 and Stefannson3 also
found similar results, observing increased venular and arteriolar oxygenation with diabetic
retinopathy compared to healthy controls.
Fluorescein Angiography and Diabetic Retinopathy:
While significantly less research has been done on correlating quantitative
fluorescein angiography with retinopathy, Silva et al.17 did find that angiography had
substantial agreement with other diagnostic methods for determining severity of
retinopathy, and that more lesions correlate with greater severity of DR. My study found a
similar trend, observing increasing retinal tissue ischemia with increasing severity of DR.
For this study, healthy and diabetic patients without retinopathy did not undergo
fluorescein angiography due to the invasive nature of the imaging method. However,
without healthy controls the study found significance only in its analyses between all NPDR
groups and the PDR group, rather than between each stage. While control patients should
exhibit no ischemia, including these patients could potentially give a more complete
statistical analysis of progression of ischemia. Additionally, for the purpose of my study
fluorescein angiography analysis was completed manually in ImageJ, and more consistency
could be provided if ischemic areas were analyzed with an automated program.
Retinal Oximetry and Fluorescein Angiography:
The study found significance in the correlation between higher SaO2 saturation and
increased retinal tissue ischemia. However, I did not observe significance in the
results suggest the possibility of a weak correlation between analyses of retinal oximetry
and fluorescein angiography, but significant further research would have to be undertaken
to define that relationship. This relationship would likely reflect physiological mechanisms
affecting blood flow that lead to both retinal tissue hypoxia and retinal vessel hyperoxia.
For future studies, all patients should undergo both imaging methods to better correlate
results.
Physiological Explanations:
There are two major mechanisms that explain the increase in retinal vessel
oxygenation and increase in retinal tissue ischemia in diabetic retinopathy: (1) capillary
non-‐perfusion and shunting and (2) thickening of capillary vessel walls. Both of these
mechanisms affect retinal blood flow, and thus the distribution of oxygen in the retina. In
capillary shunting, some vessels dilate and others enlarge, leading to blood flow bypassing
parts of the capillary network. Cogan and Kuwabara15 observed that shunting occurs in
diabetic retinopathy, and fluorescein angiography shows that enlarged capillaries shunt
blood directly from retinal arterioles to retinal venules, bypassing retinal capillary
networks. This leads to capillary non-‐perfusion, where blood is quickly transported
through dilated capillaries, reducing the amount of oxygen provided to retinal tissues. This
mechanism results in an unbalanced oxygen distribution, with hyperoxic retinal vessels
and hypoxic retinal tissue. Secondly, thickening of capillary vessel walls may also decrease
the amount of oxygen released to retinal tissue and increase the amount of oxygen retained
in the blood. Ashton23 and Roy et al.24 have reported that capillary walls thicken with
and hypoxia of retinal tissue in diabetic retinopathy. Blood flow maldistribution and
changes in oxygen extraction are the most likely explanation for my results, supporting the
increase in arteriolar and venular oxygenation and increase in tissue ischemia in later
stages of retinopathy.
CONCLUSION
This study found that retinal oxygenation is altered in later stages of diabetic
retinopathy. There is a significant increase in retinal venular oxygenation in moderate
NPDR and PDR patients, and an increase in arteriolar oxygenation in PDR patients
compared to diabetics without retinopathy and to the normal controls. Ischemia of retinal
tissue was also found to increase in PDR patients compared to NPDR patients. These results
could reflect retinal capillary non-‐perfusion and thickened retinal vessel walls in diabetics,
which reduce the amount of oxygen delivered to retinal tissues. This would match results
of hypoxia of retinal tissue and hyperoxia of retinal venules as diabetic retinopathy
progresses. For future studies, a larger sample size of mild and severe NPDR patients could
help confirm the results and likely provide statistical significance between all DR stages. In
the future, retinal oximetry may be used as an effective non-‐invasive tool to augment the
diagnosis and risk stratification of diabetic retinopathy patients, and quantitative IVFA
could provide standardization for existing qualitative IVFA studies.
ACKNOWLEDGEMENTS
I would like to thank my research sponsor, Dr. Seema Garg, for her guidance in the
project. I would also like to extend thanks to the technicians, ophthalmic photographers,
ophthalmology residents and research staff at the UNC Kittner Eye Center for their help
to express gratitude to my fellow research assistant this past summer, UNC medical student
Abhi Guduru, as well as former UNC undergraduate Alexa Waters who set the foundation
for the project in retinal oximetry. Further thanks to Dr. Tyson Hedrick, my Biology
Department sponsor, who gave me significant guidance in project protocol, especially in
the development of fluorescein angiography analysis. This research was also supported by
a Summer Undergraduate Research Fellowship from the UNC Office of Undergraduate
Research.
REFERENCES
1. “Facts About Diabetic Retinopathy." National Eye Institute. National Institute of Health, June 2012. Web. 14 Jan. 2014.
2. Hammer M, Vilser W, Riemer T, et al. Diabetic patients with retinopathy show increased retinal venous oxygen saturation. Graefes Arch Clin Exp Ophthalmol.
2009;247:1025-‐1030.
3. Stefansson E and Hardarson SH. Retinal oxygen saturation is altered in diabetic retinopathy. Br J Ophthalmol. 2011;96:560-‐563.
4. Khoobehi B, Firn K, Thompson H, Reinoso M, Beach J. Retinal arterial and venous oxygen saturation is altered in diabetic patients. Invest Ophthalmol Vis Sci.
2013;54:7103–7106.
5. Stefánsson E. Ocular oxygenation and the treatment of diabetic retinopathy. Surv Ophthalmol. 2006 Jul-‐Aug;51(4):364-‐80.
6. Beach JM, Schwenzer KJ, Srinivas S, Kim D, Tiedeman JS. Oximetry of retinal vessels by dual-‐wavelength imaging: calibration and influence of pigmentation. J Appl Physiol. 1999;86:748–758.
7. Hardarson, Sveinn Hakon, et al. Automatic retinal oximetry. Investigative ophthalmology & visual science 47.11 (2006): 5011-‐5016.
8. Hardarson SH, and E Stefánsson. Oxygen saturation in central retinal vein occlusion. American journal of ophthalmology 150.6 (2010): 871-‐875.
9. Boeckaert, J., E. Vandewalle, and Ingeborg Stalmans. Oximetry: recent insights into retinal vasopathies and glaucoma. Bull Soc Belge Ophtalmol 319 (2012): 75-‐83. 10. Olafsdottir, Olof Birna, et al. Retinal oximetry in primary open-‐angle glaucoma.
Investigative ophthalmology & visual science 52.9 (2011): 6409-‐6413. 11. Hardarson SH. Retinal oximetry. Acta Ophthalmologica. 2012;91: 489–490.
14. Ivanisević M. and Stanić R. Importance of fluorescein angiography in the early detection and therapy of diabetic retinopathy. Ophthalmologica 201.1 (1990): 9-‐13. 15. Cogan, DG., and T Kuwabara. Capillary shunts in the pathogenesis of diabetic
retinopathy. Diabetes 12 (1963): 293-‐300.
16. Silva, Paolo S., et al. Nonmydriatic ultrawide field retinal imaging compared with dilated standard 7-‐field 35-‐mm photography and retinal specialist examination for evaluation of diabetic retinopathy. American journal of ophthalmology 154.3 (2012): 549-‐559.
17. Silva, Paolo S., et al. Peripheral lesions identified by mydriatic ultrawide field imaging: distribution and potential impact on diabetic retinopathy severity.
Ophthalmology 120.12 (2013): 2587-‐2595.
18. The Oxymap T1. Oxymap ehf. Reykjavik, Iceland. Retrieved from http://www.oxymap.com/?page_id=1196.
19. Jani PD, Mwanza JC, Billow KB, Waters AM, Moyer S, Garg S. Normative Values and Predictors of Retinal Oxygen Saturation. RETINA, In Press (2013).
20. Optos 200 Tx. Retrieved from https://www.optos.com/Global/documents/
200TX_Brochure.pdf.
21. Bek, T. Retinal oximetry in diabetic retinopathy. Acta Ophthalmologica. 2014; 92.s253: 0-‐0.
22. Jorgensen, CM., SH Hardarson, and T Bek. The oxygen saturation in retinal vessels from diabetic patients depends on the severity and type of vision-‐threatening retinopathy. Acta ophthalmologica 92.1 (2014): 34-‐39.
23. Ashton N. Vascular basement membrane changes in diabetic retinopathy.
Montgomery lecture, 1973. The British Journal of Ophthalmology. 1974;58(4):344-‐ 366.