Compound
Disasters
Federal buyouts and the Great Recession’s effect
on Black and White household resilience
Table of Contents
I. Abstract 3
II. Introduction 4
III. Literature Review 5
IV. Hurricanes Fran and Floyd in North Carolina 11
V. Methodology 13
VI. Findings 15
VII. Conclusion and Implications 27
VIII. Appendix 31
I. Abstract
The intention of the buyout program is to reduce vulnerability by removing homes from the floodplain. But vulnerability is not just measured by physical exposure to risk. It is the capacity to anticipate, cope with, resist, and recover from shocks (Fothergill & Peek 1999, cited Blaikie et al., 1994), which must account for the social, economic, and political context in which a disaster occurs. While experts see the buyout program as a viable hazard mitigation strategy, buyouts may have unknown consequences as they permanently alter the physical, social, and economic landscape. To better understand their impact, I studied the effect of the buyouts in North Carolina following Fran and Floyd after the Recession on communities that participated. The findings indicate that buyout neighborhoods have a larger percent Black population and are more economically stressed than those without buyouts. Buyout
neighborhoods also fared worse after the Recession than those without buyouts. When assessing the impact of buyouts on home purchase loan approvals, the likelihood of being approved for a
II. Introduction
Natural disasters, such as hurricane Katrina, Matthew, Irma, and Harvey, force us to confront the reality that many of our communities are vulnerable to serious environmental hazards. In the U.S., floods are the costliest of natural disasters and the financial losses to homeowners and government are climbing (Brody, Zahran, Maghelal, Grover, & Highfield, 2007). As more people move to flood prone areas and coastal development increases, the concentration of assets in high-risk areas will likely lead to greater losses in the future (NRC, 2006). This forecast has already proven true. From 1960 to 2004 the average annual property damages totaled $290.5 billion and as of 2015, this average has tripled to $686.3 billion (2015 dollars), according to data from the Spatial Hazard Events and Losses Database for the United States (SHELDUS).
The extent to which government is responsible for reducing vulnerability and losses is a focal point of criticism and debate. Currently, hazard mitigation strategies and policies are the primary means by which governments intervene to reduce loss of life and property in the face of risk. In particular, acquisition of flood-prone properties using Federal Hazard Mitigation Grant Program (HMGP) and Community Development Block Grant – Disaster Recovery (CDBG-DR) monies is considered a successful hazard
mitigation strategy. These acquisitions are commonly referred to as “buyouts.”
While immense time and money is spent on administering public post-disaster programs, their effectiveness remains uncertain. As disaster events become more prevalent, the costs of disaster recovery have skyrocketed and brought the buyout program under scrutiny (Song and Shaw 2017; de Vries, 2017; Mcghee, Albright, & Binder, 2017). To reduce losses, removing assets from high-risk areas seems a logical solution. The intention of the buyout program is to reduce vulnerability by removing homes from the floodplain. But vulnerability is not just measured by physical exposure to risk. It is the capacity to anticipate, cope with, resist, and recover from shocks (Fothergill & Peek 1999, cited Blaikie et al., 1994, p. 9), which must account for the social, economic, and political context in which a disaster occurs.
There is a gap in our understanding of how to use the buyout program to better serve communities that are most vulnerable to flooding. They create new open which can be converted into public recreational areas, adding an amenity for the surrounding community. Conversely, the impact of buyouts on the municipalities tasked with maintaining that space is uncertain. Municipalities that participate simultaneously sustain losses to their tax base as homeowners move out and receive additional public space they are responsible for managing. To improve disaster recovery and increase resilience, the pre-disaster recovery planning should include strategies for how to employ the buyout program so that it adds amenities and value to communities rather than leaving behind vacant and often unkempt lots.
After hurricane’s Fran and Floyd, North Carolina implemented a massive buyout program acquiring over
5,000 properties across the state. Using data from the buyouts following Fran and Floyd, I assess how the concentration of buyouts within a neighborhood affects the likelihood of being approved for a home loan for Black and White applicants after the Great Recession. The results reveal that the bulk of the participants in the Floyd and Fran buyouts were in socially vulnerable neighborhoods (Cutter et al., 2008). Neighborhoods with buyouts improved in economic health, measured by median household income and median house value, at a lower rate compared to those without buyouts.
to non-buyouts neighborhoods. Additionally, stricter lending regulations affected the application sample post-Recession.
This research sheds light on the disproportionate impact of buyouts on Black communities and
households as they seek wealth building opportunities in neighborhoods that are not only economically struggling but flood prone. This research adds to our understanding of the long-term impacts of the buyout program by assessing whether buyouts effect access to home loan credit in the wake of a financial crisis. The findings underscore the importance of pre-disaster planning for buyouts to better
account for and take advantage of the program’s externalities. We will better understand how
government programs that attempt to reduce vulnerability have long term but varied effects on Black and White applicants and neighborhoods.
The thesis is organized as follows. In the literature review, I first provide background information regarding the flood recovery process in the United States and how federal policy interventions in local contexts post-disaster have changed over time. In this section I will also explain the details of the buyout program. Next, I describe current and past research on in impacts of buyouts, racial disparity in disaster recovery, access to housing credit via home loans at various points in U.S. history and with a review of what should be expected regarding changes in home loan approval rates before and after the Recession and how this may differ across racial lines also explains. Following the literature review, I narrate the effects of hurricanes Fran and Floyd and the subsequent buyout. I detail the methodology for this research project, and its limitations. I then present my results and discuss the findings and their implications for hazard mitigation and post-disaster recovery planning and policy.
III. Literature Review
Flood Recovery in the U.S.
Federal acquisition of flood prone homes dates back to the relocation of flooded homes and businesses in Soldiers Grove, Wisconsin in the 1970s (David and Mayer 1984; Greer & Brokopp Binder, 2017). Hazard mitigation in the U.S historically consists of structural solutions, such as levees and damns; economic solutions, such as insurance; and educational approaches, including trainings and public risk awareness campaigns (Rubin, 2012). Structural mitigation efforts in particular have been criticized for incentivizing
development in risky areas by creating a “safe-development paradox” (Burby, 2006).1 Non-structural
mitigation techniques include educating property owners about their flood risk, providing flood insurance,
altering zoning regulations, and conducting property acquisitions or “buyouts” (Zavar, 2015).
The Robert T. Stafford Disaster Relief and Emergency Restrictive Act of 1988 details the extent of public assistance for presidential disaster declarations. The HMGP program outlined in the Act describes the three options for homeowners participating in the buyout program; the home can be elevated in place above the base flood elevation and any required freeboard; moved to another lot through demolition and rebuilding; or acquired and demolished. The latter of these options is what is most commonly referred to
1 As Burby (2006) explains, structural mitigation measures such as levees and damns reduce risk in previously risky
as a “buyout”. The homeowner voluntarily participates and is compensated for their property at pre-flood market value through a combination of federal and local government contributions2.
The decision to offer a homeowner a buyout relies on the results of a cost-benefit analysis prioritizes maximizing the ratio of the cost of future losses to cost of acquiring the property. Buyouts are prioritized in areas most vulnerable to future flooding (within the 100-year floodplain). If the property owner takes the buyout, the property is usually acquired by the City, its structure removed, and the it is converted into public open space in perpetuity through a restrictive covenant. Since the 1990s, buyouts are increasingly used as a non-structural measure (Greer & Brokopp Binder, 2017). Between 1993 and 2011, the Federal Emergency Management Agency (FEMA) acquired over 40,000 flood-damaged properties through their Hazard Mitigation Grant Program (HMGP) (Aronoff 2017).3
Not all buyouts involve the federal government but most occur in the aftermath of a federally declared disaster with the help of federal resources.4 Federal buyouts are funded through the (HMGP) as the primary source and Community Development Block Grants for Disaster Recovery (CDBG-DR)5 as the secondary. FEMA dedicates about 15-20% of their total funds in a disaster situation towards HMGP. These funds are only available to communities that participate in the National Flood Insurance Program. Both HMGP and CDBG-DR maintain the requirements that the buyouts be voluntary, homeowners be offered fair market value, and the land be maintained as open space in perpetuity (Greer & Brokopp Binder, 2017).6 While buyout participants receive fair market value for their home, the net amount is often reduced after paying off the mortgages, and outstanding taxes. Furthermore, if the household received any FEMA monetary assistance, the sum of that assistance will also be subtracted from the final check
they receive for their house. Each individual applicant’s own financial circumstances are a huge influence
on the decision to take a buyout, sometimes despite the risk they face to future flooding.
There is general agreement between floodplain managers, disaster recovery experts, FEMA, and local public officials that the higher the rate of participation in the buyout program, the more successful it is (Daniel H. de Vries, 2017; McCann, 2006; FEMA, 2003). However, success is measured by reduction in potential asset losses, not effects on neighborhood characteristics or housing markets (Zavar, 2015). Recent studies question the extent to which buyouts reduce vulnerability for those who participate
2 The federal government usually commits 75% of the funds with a local 25% match.
3 The total today is likely much higher as it does not account for Hurricanes Sandy, Matthew, Harvey, or Irma
buyouts.
4 Buyout programs do not only happen post-disaster with primarily federal monies. For example,
Charlotte-Mecklenburg, NC created a floodplain buyout program funded partially through grants from FEMA but also contains substantial local programmatic components. Since 2003, a portion of the local storm water fee has been
set aside for the “rainyday fund” to be used for “Quick Buys”. Since 2012, a program called the Local Risk-Based Buyouts essentially does the same thing as post-disaster HMGP buyouts but is funded with 100% local monies from the storm water fee as well.
http://charlottenc.gov/StormWater/Flooding/Pages/FloodplainBuyoutProgram.aspx
5 CDBG-DR funds have been used since 1992 after Hurricane Andrew but have been used for recovery efforts
beyond hurricanes including after the bombing of the Alfred P. Murrah Federal Building in Oklahoma City and the terrorist attacks in New York City on September 11, 2001. CDBG-DR funds can be used for three broad categories of activities including short-term disaster relief, mitigation activities, and long-term recovery. Buyouts generally fall within the mitigation activities category. (Gotham, 2014b)
6 Traditionally, CDBG-DR funds are more flexible than HMGP with regard to what can be done with buyout
(McGhee, Albright, & Binder, 2017) and there is still little empirical consensus on how buyouts impact neighborhoods. Reviewing the literature on open space, social vulnerability, disaster recovery, and decision-making post-disaster provides a foundation to understanding buyout’s impacts.
Buyouts as public open space
Elyse Zavar is one of the few researchers investigating the impact of buyout induced open space induced on surrounding communities (Zavar & Hagelman III, 2016). Her study of the re-use of buyout properties found that residents viewed the buyout properties differently depending on how they were maintained and landscaped. In areas with little landscaping, they were seen as a wasted opportunity, but in areas with more investment in the buyout open space, the community perceived it as an amenity (Zavar, 2015). The greater the investment in the open space, the more likely it serves as an amenity. Moreover, high quality open space has significant positive effects on health outcomes (Cohen et al., 2007; Larson, Jennings, & Cloutier, 2016; Nowak, Crane, & Stevens, 2006; Villeneuve et al., 2012), and property values (Anderson & West, 2006; Lewis, Provencher, & Butsic, 2009), and a negative effect on crime rates (Kuo, Sullivan, Coley, & Brunson, 1998). Conversely, poor quality open space negatively effects the surrounding community by contributing to poorer mental health outcomes (Francis, Wood, Knuiman, & Giles-Corti, 2012) and less time spent outdoors (Lestan, Eržen, & Golobič, 2014). For buyout properties, local context is crucial to understanding whether surrounding neighborhoods consider them an amenity or burden.
Disaster Induced Relocation
Relocation is inevitable following a buyout. Forced relocation disrupts one’s sense of place and the social fabric of neighborhoods. Buyouts are an instance of pseudo-voluntary relocation, as those who participate often decide to do so under unusual pressure and trauma (de Vries, 2017). De Vries and colleagues (2017) found that trauma experienced immediately after a disaster is sometimes exploited as a window of
opportunity to “woo” homeowners into accepting a buyout.7 The offer to participate in the program
requires homeowners weigh the pros and cons of moving out of harm’s way and sacrificing their sense of belonging in their community. Place attachment is often a reason for not taking a buyout. The emotional bonding of people, groups, and communities to their physical surroundings is a significant part of people’s lives (Mishra, Mazumdar, & Suar, 2010), and is strongly correlated with robust neighborhood and community ties (Lewicka, 2010). Place attachment and community attachment produces a sense of comfort and security which is often disrupted in disaster events (Mishra et al., 2010; Phillips, Stukes, & Jenkins, 2012). Buyouts contribute to increased stress and anxiety for those who participate as they lose the benefits of place attachment and community (Hogg, Kingham, Wilson, & Ardagh, 2016).
Neighborhood Change and Hazards
As a dynamic social and political entity, endogenous and exogenous shocks constantly change neighborhoods. Disasters can act as exogenous shocks that induce shifts in a neighborhood’s trajectory (Lee, 2017). A natural disaster’s effect on a neighborhood’s change trajectory depends on the pre-disaster conditions and composition of the neighborhood. Disasters are the product of the social, political, and economic environments in which they occur (Fothergill & Peek, 1999 cited Blaikie, Cannon, Davis, and Wilsner, 1994, p.3).
7 Dr. Daniel De Vries (2017) studied the buyouts after Hurricane Floyd in Kinston, NC where 95% of those offered a
Neighborhood change is measured by studying changes in an neighborhood’s socio-economic status, household value and type, and racial diversity (Galster, Hayes, & Johnson, 2005; Quercia & Galster, 2000). The more damage sustained, the more likely a neighborhood undergoes change. However, similar levels of damage do not indicate similar levels or directions of change across neighborhoods of differing characters. Socio-economic status and race are strong determinants of disaster induced neighborhood change (Lee, 2017). For example, wealthier coastal communities may sustain the same or more severe levels of damage as those inland but a household’s individual resources and their community’s political sway can reduce negative impacts and induce less neighborhood change than communities with fewer resources (Lee, 2017).
Inequitable Disaster Recovery
Inequitable recovery results in spatially uneven recovery as the disaster recovery system often fails to meet the needs of those most vulnerable (Bullard & Wright, 2012; Gotham, 2014(a); Gotham 2014 (b)). Disasters amplify pre-disaster conditions making equity central to discussions of the disaster recovery system (Cutter, Mitchell, & Scott, 2012; Fothergill, Maestas, & Darlington, 1999; Gotham, 2014a; Montgomery & Chakraborty, 2015). Socially vulnerable communities have less control over local governments and weaker political power to direct resources and attention to their recovery needs (Lee 2017). Susan Cutter’s social vulnerability index (SVI) identifies demographic, economic, and built environment characteristics as key contributors to hazard vulnerability (Cutter et al., 2008; Cutter, Boruff, & Shirley, 2003; Cutter et al., 2012; Emrich & Cutter, 2011). Communities of color, aging populations, older homes, and gender are just a few of the indicators. Cutter argues that communities with higher levels of social vulnerability (Cutter et al., 2003, 2012) have less access to financial and economic capital and resources needed for complete recovery. As a consequence, these households are more reliant on government monies to recover yet, they are the least likely to receive it. They often have little experience with the recovery system and navigating government programs, affecting their access to much needed help (Lee, 2017). Socially vulnerable populations are also more likely to be permanently displaced from their homes and participate in the buyout program (de Vries, 2017; Fothergill et al., 1999; Fothergill & Peek, 2004; Gotham, 2014a, 2014b).
Race in particular has a significant impact on one’s social vulnerability. Black neighborhoods on average have lower home values and less access to credit than White.8 In a disaster event, Black households are then at a significant disadvantage because recovery aid and insurance payouts are based on the dollar amount of losses. People with higher value assets then receive the majority of financial assistance which is critical to recouping losses and rebuilding homes (Peacock & Girard, 1997). Additionally, communities of color are more exposed to environmental hazards than White communities (Blaikie et al., 1994; Fothergill & Peek, 1999; Abel, 2008; Fussel, 2010; Lerner & Brown, 2012; Banzhaf, 2012; Johnson Gaither, 2015; Montgomery & Chakraborty, 2015). Hurricane Katrina has iconized the inequity of disaster recovery.
As one of the largest disaster’s in US history, Katrina’s aftermath is one of the most studied disasters
because of the its disparate impact on communities of color. Effectiveness of Buyouts in Reducing Vulnerability
While buyouts are considered an effective means of reducing losses of life and property, McGhee and colleagues (2017) found that those who participate do not always move into less vulnerable areas. After
hurricane Sandy, over 20% of buyout participants moved areas at least as exposed to coastal flood hazards as their previous residence (McGhee, Albright, & Binder, 2017). Additionally, 321 of the 323 buyout participants studied relocated to areas with higher levels of social vulnerability (Mcghee et al., 2017). These findings stress the need for more comprehensive evaluation of buyouts beyond simplistic economic indicators.
Who Takes a Buyout?
The factors influencing one’s decision to take a buyout ranges from perceived flood-risk, socio-economic status, length of residence, and the broader community’s participation (Binder et al., 2015; Kick, Fraser, Fulkerson, Mckinney, & de Vries, 2011). The research suggests that peer influence (i.e. if you’re neighbor participates or not) is the strongest influence on participation (Binder et al., 2015). However, this finding does not support theories of collective relocation organized by residents to maintain community cohesion (Bukvic & Owen, 2017). After Fran and Floyd, flooded Black communities such as Princeville, North Carolina mistrusted the State and Federal authority and were less willing to participate in the buyout program (Phillips et al., 2012).
Between the cost of rebuilding and rising flood insurance premiums, a buyout offer is enticing. Recently, New Orleans Public Radio, WWNO, conducted several interviews with Louisiana residents, hazard mitigation officials, and flood management specialists. When asked, many residents initially did not want to leave their homes. However, investigators found that at the right price, they would leave. Some residents even hoped to be bought out just to be given the opportunity to leave the flood prone area. Financial security is to a strong factor in a homeowner’s decision to take a buyout (Wendland, 2018). Factors Determining Home Loan Denials
Economic characteristics of a loan applicant and the neighborhood they are in are strong predictors of loan denials. Traditionally there are three elements to consider when writing a mortgage loan. They include assessing the capacity of the borrower to manage the mortgage payments, assessing the credit worthiness of the borrowers, and assessing the strength of the collateral backing the loan(Munnell, Tootell, Browne, & Eneaney, 1996). The probability of default can be predicted by the applicant’s credit worthiness, their debt to income ratio, the stability of their income, housing price index, regional unemployment rates, and the loan amount requested (Ards, Ha, Mazas, & Myers, 2014; Munnell et al., 1996; Wheeler & Olson, 2015). Race and ethnicity are strong determinants (Ards et al., 2014; Munnell et al., 1996; Wheeler & Olson, 2015; Ezeala-Harrison & Glover, 2008; Cherian, 2014).
The three loan standards mentioned above were relaxed in the 1990s. IT was uncommon to relax more than one but in by the early and mid-2000s, lenders often relaxed all three standards (Belsky & Richardson, 2010). As more and more people gained access to housing credit, homeownership became possible for a larger portion of the population. This fueled an increase in home prices as demand for homes outpaced supply (Weinberg, 2013). Home prices more than doubled in the U.S. between 1998-2006 and mortgage debt rose from 61% to 97% in the same period. The expansion of the housing market peaked in 2006 and by December of 2007, the US economy entered into a recession and bottomed out in the middle of 2009. Home prices fell by over one fifth from the first quarter of 2007 to the second quarter of 2011 (Weinberg, 2013).
subprime lending activity occurred in majority Black or Hispanic , with lower incomes, higher unemployment rates, but low poverty levels (Kingsley & Pettit, 2009; Mayer & Pence, 2008). ).
Subprime lending increased foreclosures., For those who were able to hold onto their homes, recovery of property values depended on the racial majority of the neighborhood. Black neighborhood property values declined sharply post-Recession while, predominantly White, middle and upper-income neighborhoods recovered from any housing price declines (Raymond et al., 2016).
After the Recession, access to home credit through loans dropped across the U.S (Mccoy, 2017). However, the tighter mortgage markets disproportionately affected racial minorities, curbing housing demand in Black and Hispanic neighborhoods (Goodman, Zhu, & George, 2015). Due to stricter credit requirements, the number of home purchase loans to Black borrowers in 2013 declined by 50 percent compared to 2001 levels, pre-subprime boom while for White borrowers, it declined 31 percent (Goodman et al., 2015).
Following the Recession, unemployment rose more for socially disadvantaged groups including African Americans and Hispanics compared to White (Danziger, 2013). Fewer Black men are now in high-wage and mid-wage occupations while their representation in low-wage occupations did not change (Holder, 2011). This indicates they were pushed out of the labor market entirely and are still over-represented in low-wage occupations.
Changes to mortgage lending practices post-Recession
In response to the Great Recession, the federal government took steps to regulate banking activities including the passing of the Dodd Frank Wall Street Reform Act of 2010. The Act details regulations for Wall Street with three sections dedicated to mortgage lending regulations. The Act also instituted the Consumer Financial Protection Bureau (CFPB) tasked with ensuring compliance with federal law governing residential mortgage loans. The CFPB has helped reduce the likelihood of predatory lending and misleading advertising for mortgage products including instituting the Qualified Mortgage Rule in January of 2014 (Belsky & Richardson, 2010; Olsen & Nguyen, 2014). Qualified mortgages are those in which the borrower does not have a debt-income ratio of greater than 43%, lenders have verified the borrower’s income, the mortgage does not last for more than 30 years, and fees and points do not exceed 3% of the loan amount.
Small creditors loan denial rates increased slightly in the 40 days after the rules implementation for both refinancing and home purchase loans while other creditors saw a small decline in denial rates (Bhutta & Ringo, 2015). Nationwide, the Federal Reserve determined the number of mortgage originations have increased consistently from 2012-2015 with a 22 percent increase from 2014-2015 (Bhutta & Ringo, 2016). This increase is due in part to the QRM pre-screening applicants and eliminating high-risk borrowers before they apply.
IV. Hurricanes Fran and Floyd in North Carolina
Hurricanes Fran and Floyd hit North Carolina just three years apart, becoming the two costliest disasters
in the State’s history. In North Carolina alone, Fran caused over $5 billion in damage and Floyd over $6
billion. Fran’s damage resulted from mostly high winds while Floyd brought significant inland flooding
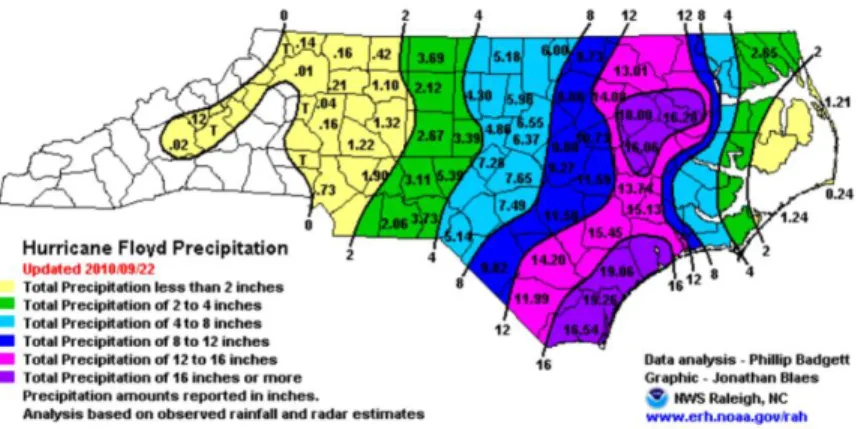
In the evening of September 16, 1999, Hurric ane Floyd made landfall in Cape Fear, North Carolina, dumping 15-20 inches of rain in under 24 hours.9 While Floyd had downgraded from a category 4 to a category 1 hurricane by the time it made landfall, Hurricane Dennis had already saturated the land 11 days prior. As a result, Floyd, caused unprecedented flooding for North Carolina, which disproportionately affected lower-income and mid to small-sized communities in the Eastern part of the state (Glovovic and Smith, 2014).
Floyd caused 52 deaths in North Carolina, flooded over 45,000 homes, and destroyed 7,300 (over 50% damaged). The Red Cross housed about 50,000 people in emergency shelters. Many of the communities most affected were already experiencing economic hardship with high unemployment rates and related outmigration (Delia 2001). The effects of Floyd in many cases expedited the areas trajectories.
The buyout program also contributed to significant population loss in these towns. After Fran, many residents were reluctant to participate. Upon seeing surrounding homes demolished to be turned into open space, remaining residents realized holding out would result in being one of a few residents left and decided to take the buyout. After Fran, in anticipation of receiving more federal funding to continue the program, municipalities prepared grant proposals to continue acquisitions.
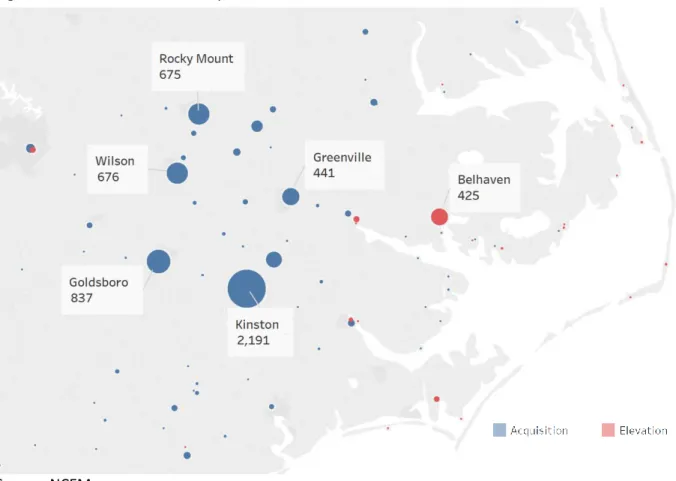
Floyd hit most of the same areas inundated by Fran. As expected, funding from the federal and state government flowed to the same communities to continue the buyout process and this time, local officials had experience administering the program and already prepared applications for property acquisition. Institutional memory and the readily available funding allowed the buyout process after Floyd to occur relatively quickly (Glovovic and Smith, 2014). Following both Fran and Floyd, $500 million was invested in hazard mitigation, thereby allowing the acquisition of 4,667 and elevation of 636 homes in North Carolina. Figure 2 indicates where these acquisitions and elevations occurred throughout the state.
9 http://www4.ncsu.edu/~nwsfo/storage/cases/19990915/
Source: http://www4.ncsu.edu/~nwsfo/storage/cases/19990915/
Figure 2: Location of Floyd & Fran Buyouts in North Carolina
Source: North Carolina Emergency Management (NCEM)
Figure 3: Cities with the Most Acquisitions and Elevations in NC
Source: NCEM
After the buyouts following Fran and Floyd, community landscapes resembled a checkerboard of green spaces and remaining homes. The homes that remain in buyout neighborhoods were either were not flooded at all, not flooded significantly to justify a buyout, did not pass the cost-benefit analysis required by FEMA to be offered a buyout, or qualified for a buyout but the homeowner did not participate. Neighborhoods with buyouts are more vulnerable to flooding than areas without and given the likelihood of increased severe weather patterns due to climate change, buyout neighborhoods will likely become more vulnerable to flooding as the floodplain expands.
V. Methodology
Using Housing Mortgage Disclosure Act data, I complied a dataset of 183,364 conventional, home purchase loan applications in North Carolina from 2004 to 2015. Looking at home purchase loans addresses the question of wealth building through homeownership more directly and only using conventional loans better reflects adjustments in the private lender environment. Each loan application was joined with decennial census data for the census tract that it corresponded to. In the process of creating this dataset I removing applications without a recorded census tract,10 applicant race, sex,
10 Lenders are allowed to suppress census tract numbers for small counties (less than 30,000 population)
amount applied for in the loan, or applicant income. I also only analyzed Black and White applicants and l loans for owner-occupied units.
The data set treats the individual loan applicant as the unit of observation. To determine the relative concentration of buyouts in a census tract, I created a variable that represents the ratio of total buyouts to total number of units in a tract. This is referred to as the buyout ratio. This ratio was also joined to each loan application corresponding to the census tract in the decade the observation occurred.
I ran a series of logistic regressions estimating the likelihood of being approved for a home loan. I used loan approval or denial as the dependent variable and a series of HMDA variables, decennial census tract variables, and the variable describing the buyout properties to total housing units ratio (buyout ratio) in each tract as the independent variables (Table 1 & 2). In addition to logistic regressions, I conducted a series of independent sample t-tests for at the census tract level (operationalized as the neighborhood) comparing neighborhoods without buyouts to those with buyouts in 2000 and 2010 and their change from 2000 to 2010.
Data limitations
There are a limited number of tracts with higher buyout ratios compared to those with lower making the accuracy in the model much higher for approval likelihoods in areas with fewer buyouts. The amount of the loan application, income of the loan applicant, and the buyout ratio are also skewed. To correct for the skewness, I took the log of the loan amount and the applicant’s income.
Most studies on home loan approval rates emphasizes the importance of credit scores and debt to income ratios. This information is not recorded in HMDA data and therefore is not included in this analysis. However, using indicators of economic stability such as income, unemployment rates, median house value, and poverty rates serve as proxies for credit scores and debt to income ratios.
Using HMDA data to study rural tracts also presents challenges. Small or non-metropolitan lenders are exempt from HMDA disclosure requirements which limits the comprehensiveness of the dataset. In particular, for North Carolina, many of the areas impacted by Fran and Floyd are rural. Additionally, the date a loan is recorded refers to the date an action was taken on the loan, not the date of filing the application. Denials tend to be recorded faster than approvals. Therefore, there may be a slight lag in the approval rates.
Lenders are allowed to suppress census tract numbers for loans in counties with populations under 30,000 although most do report this data (Avery, Brevoort, & Canner, 2007). Therefore, it is more difficult to study the impact of buyouts on home credit access in rural areas. Unfortunately, many of the buyouts
from Hurricane’s Fran and Floyd occurred in rural North Carolina.
Additional data limitations stem from the change in the type of data reported in 2000 census data compared to 2010. As a result, American Community Survey 5-year estimates (2008-2012) were used for median household income, black and white median household income, unemployment rate, median rent, percent with high school education or less, and poverty rate. Because most of the buyouts occurred in low-density areas of North Carolina, there is a question of how accurate the ACS data is for certain tracts, given their margin of error.
and depth data. An even more robust analysis would also include level of flooding in structures that participated and did not participate in the buyout program.
Summary of data used in logistic regression
Table 1: Variable definitions
Source: HMDA 2004-2015, NCEM, Decennial Census 2000 & 2010, ACS 5-year estimates (2008-2012)
Table 1 above describes the variables included in the regression analysis. It is a mix of categorical, continuous, and discrete variables that represent factors influencing the likelihood of loan approval. The “acquired” variable is the variable of interest as it represents the buyout ratio of the total properties bought out to the total number of housing units in the tract of the loan application.
VI. Findings
Before reporting the results from the regression analyses and t-tests, I summarize the descriptive statistics of the variables included in the analysis in Table 2.
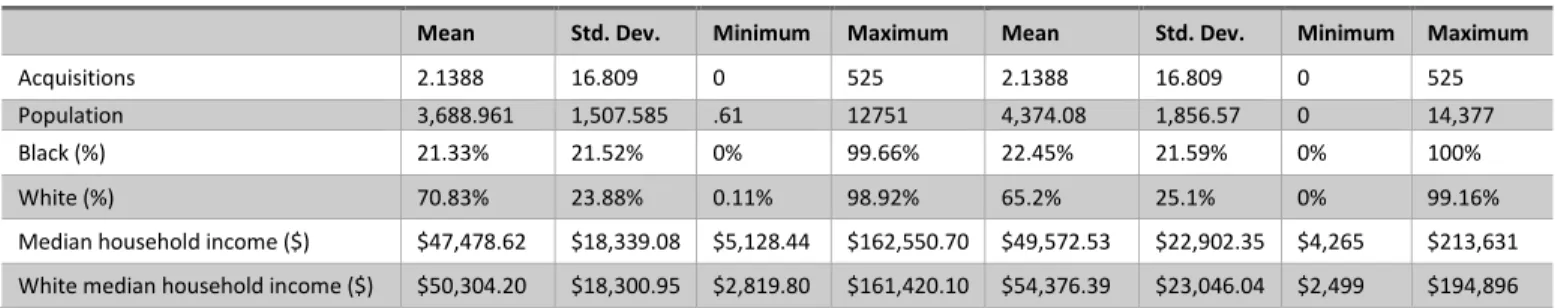
Table 2: Descriptive Statistics of variables included in the t-tests 2000 and 2010
Variable Name Definition
Acquired Ratio of total buyouts from Floyd and Fran to total number of units in the tract
Approved 0=denial 1=approved loan application
White_applicant 0=Black 1=White
Female 0=male 1=female
Logamount log of the amount asked for in the loan application
Logincome log of the income of the loan applicant
Cosigner 0=no cosigner 1=yes cosigner
Loan to income ratio (loainc) Loan amount divided by the income of the applicant
Year Each application given a binary code for year (ex: If year=2004, yr04=1, if not 2004, yr04=0
Density Population density of the tract per square mile
Owner_occupied (%) Percent of owner-occupied units in tract Housing value (median) median house value in tract
Vacancy (%) Percent vacant housing units in tract
Unemployment (%) Percent of population unemployed in tract White (%) Percent of total population that is White in tract
Variable 2000 2010
Mean Std. Dev. Minimum Maximum Mean Std. Dev. Minimum Maximum
Acquisitions 2.1388 16.809 0 525 2.1388 16.809 0 525
Population 3,688.961 1,507.585 .61 12751 4,374.08 1,856.57 0 14,377
Black (%) 21.33% 21.52% 0% 99.66% 22.45% 21.59% 0% 100%
White (%) 70.83% 23.88% 0.11% 98.92% 65.2% 25.1% 0% 99.16%
Median household income ($) $47,478.62 $18,339.08 $5,128.44 $162,550.70 $49,572.53 $22,902.35 $4,265 $213,631
Source: HMDA 2004-2015, NCEM, Decennial Census 2000 & 2010, ACS 5-year estimates (2008-2012)
The average number of buyouts in a tract is just over 2. Incomes grew from 2000 to 2010 and house values grew slightly. Black and Hispanic populations grew as a proportion of the total population while White declined. Labor force participation dropped, percent in poverty increased significantly, and the rate of owner-occupied housing units dropped significantly.
Table 3: Summary Statistics of Variables included in the Regression Analysis
Black median household income ($) $38,781.46 $19,675.60 $2,819.80 $172,537.90 $41,228.74 $28,805.98 $2,499 $250,001
Per capita income ($) $23,642.80 $9,377.302 $3,850 $100,641.60 $25,540.85 $22605.79 $2,059 $177,039
Civilian labor force (%) 63.58% 9.78% 1.2% 89.66% 60.82% 10.78% 0% 100%
Unemployment (%) 5.44% 4.64% 0% 51.57% 11.19% 5.94% 0% 50.41%
Poverty (%) 12.24% 8.82% 0% 93.23% 17.63% 12.19% 0% 96.25%
White poverty (%) 9.19% 8.7% 0% 100% 13.07% 11.58% 0% 100%
Black poverty (%) 19.13% 15.26% 0% 100% 25.52% 22.91% 0% 100%
Median House Value ($) $123,179.20 $60,867.02 $0 $618,233.90 $168,569.30 $99,003.80 $10,600 $1,000,001
Median Rent ($) $521.09 $187.95 $0 $1,444.17 $557.22 $403.24 $0 $2.790
Owner Occupied (%) 62.02% 18.17% 0% 95.59% 57.42% 19.5% 0% 100%
Occupied (%) 89.69% 9.95% 10.34% 100% 87.22% 11.25% 0% 100%
Source Variable Type Mean Std. Dev. Min Max
Floyd Buyouts by Census Tract (acquired 2017)
Acquired Continuous 0.5% 1.6% .019% 48.1%
HMDA Data, Individual-level (2004-2015)
Approval Binary 0.899 0.302 0 1
White_applicant Binary 0.806 0.395 0 1
Female Binary 0.343 0.475 0 1
Logamount Continuous 11.713 0.823 6.907 15.687
Logincome Continuous 11.08 0.696 6.907 16.092
Loaninc Continuous 2.32 7.1 0.13 2590
Cosigner Binary 0.418 0.493 0 1
Yr04 Binary .119 .324 0 1
Yr05 Binary .148 .355 0 1
Yr06 Binary .144 .351 0 1
Yr07 Binary .113 .317 0 1
Yr08 Binary .060 .238 0 1
Yr09 Binary .040 .197 0 1
Yr10 Binary .040 .196 0 1
Yr11 Binary .043 .202 0 1
Yr12 Binary .041 .198 0 1
Yr13 Binary .051 .220 0 1
Source: HMDA 2004-2015, NCEM, Decennial Census 2000 & 2010, ACS 5-year estimates (2008-2012)
In Table 3, the “acquired” variable describes the number of properties acquired from the buyouts as a percentage of the total number of units in the census tract. This is the primary variable of interest of the independent variables listed. The acquired variable’s value ranges from 0.019% to 48.1% in a tract. There are significantly more tracts with lower buyout ratios than higher, which results in a larger standard deviation and a mean closer to zero. About half of the loan applications also had cosigners and the majority of the loan applications occurred prior to the Recession. There are also more White applicants than Black and more male applicants than female. Over 70% of the population is White and over 70% of the housing units in the tracts of the applications are owner occupied. The vacancy rate in tracts with loans is over 10% and the standard deviation is large indicating a wide variation in vacancy rates. The median house value is $158,698 and mean unemployment is 6.3%, both with large standard deviations.
Figure 4: Total home purchase loan applications overtime
Source: Housing Mortgage Disclosure Act Data 2004-2015
There is an uptick in total loan applications in 2005 and this slowly then quickly falls until 2009 when total loan applications stabilize and begin to increase slowly.
Decennial Census by Census Tract (2000 & 2010) &
ACS 5-year (2008-2012)
Median Household Income ($) Discrete $56,538 $23,032 $7,906 $204,990
Owner occupied (%) Continuous 70.6% 16.6% 3.3% 96.2%
Housing value ($) (median) Discrete $158,698 $101,674 $35,660 $871,768
Vacancy (%) Continuous 10.7% 8.5% 2.8% 77.3%
Unemployment (%) Continuous 6.3% 4.4% 0.6% 47.5%
White (%) Continuous 72.4% 21.1% 0% 100%
0 5,000 10,000 15,000 20,000 25,000 30,000
2004 2005 2006 2007 2008 2009 2010 2011 2012 2013 2014 2015
N
u
m
b
er
o
f Ap
p
lic
at
ion
s
Figure 5: Number of White and Black home purchase loan applicants in buyout neighborhoods, 2004-2015
Source: Housing Mortgage Disclosure Act Data 2004-2015
Figure 5 shows the number of Black and White applicants in neighborhoods with buyouts. Not surprisingly, White applicants consistently outpaced Black applicants from 2004 to 2015. The number of Black applicants has stabilized since the Recession while the number of White applicants increases slightly. The fact that loan applications have not returned to pre-Recession levels is likely due to changes in regulations that prevented lenders from originating loans without “[making] a reasonable and good faith determination based on verified and documented information that, at the time the loan is consummated, the consumer has a reasonable ability to repay the loan, according to its terms, and all applicable taxes,
insurance . . . , and assessments.”11 These regulatory changes reduced the raw number of applicants by
pre-screening for unqualified potential borrowers before they could submit an application.
0 5,000 10,000 15,000 20,000 25,000
2004 2005 2006 2007 2008 2009 2010 2011 2012 2013 2014 2015
N
u
m
b
er
o
f Ap
p
lic
at
ion
s
Year
Figure 6: Number of Black applicants as a percent of White applicants in buyout neighborhoods, 2004-2015
Source: HMDA 2004-2015
The number of Black applicants as a percent of White applicants in buyout neighborhoods starts above 20% and then sharply declines during the Recession. It then jumps back above 20% from 2010 to 2011 and remains there until 2015, albeit declining from 25% to just above 20% from 2012 to 2015. I assume that due to Dodd Frank, the pool applicants after the Recession are more qualified borrowers than prior to the Recession. Therefore, the ratio of Black applicants to White after the Recession is comprised of fundamentally different kinds of applicants than prior to the Recession.
Tract Characteristics – With and without buyouts
Before analyzing the likelihood of home loan approvals, it is important to understand the characteristics of tracts with buyouts compared to those without. Are these neighborhoods fundamentally different? Did they change in different ways from 2000 to 2010? How significant is the correlation between the buyout ratio and various neighborhood characteristics and how they changed over time? The following analysis, using descriptive statistics and t-tests answers these questions.
I conducted a series of independent sample t-tests comparing areas without buyouts to those with buyouts. The data used for this analysis includes 2000 and 2010 census tracts and corresponding census variables. The tracts are normalized to 2010 boundaries. This dataset comes from the Longitudinal Tract Database12. For year 2010, the LTDB took ACS 2008-2012 estimates for some variables due to the inconsistencies in the information collected from 2000 to 2010 decennial censuses. The variables that came from the 2010 decennial census are total population, number of White (non-Hispanic), number of Black (non-Hispanic), total housing units, occupied housing units, vacant units, renter occupied units, and owner-occupied units.
12http://www.s4.brown.edu/us2010/Researcher/Bridging.htm
0% 5% 10% 15% 20% 25% 30%
2004 2005 2006 2007 2008 2009 2010 2011 2012 2013 2014 2015
N
u
m
b
er
Black
Ap
p
lic
an
ts
a
s %
o
f W
h
ite
The two samples do not have equal variances as there is a total of 1,923 tracts without buyouts and 259 with buyouts. Tracts with buyouts were coded as “1” and tracts without buyouts “0”. Table 4 provides the results of the t-tests (difference = mean(0)-mean(1)). The number of buyouts in a neighborhood ranges from 1 to 525 or .001- 48.1% buyout ratio.
Table 4: T-tests comparing characteristics of neighborhoods with and without buyouts, 2000 and 2010
Variable 2000 2010 t-value p-value With
buyouts
Without
buyouts t-value p-value
With buyouts
Without buyouts
Black (%)** -7.9478 0 32.75% 19.8% -7.2545 0 32.67% 21.07%
White (%)** 6.8016 0 60.49% 72.23% 5.3293 0 57.12% 66.29%
Hispanic (%)** 0.9698 0.3329 4.03% 4.34% 2.3482 0.0194 6.99% 8.16%
Median household income ($)** 9.3711 0 $38,885.24 $48,640.07 6.7625 0 $41,733.07 $50,661.84
White median household income ($)** 7.0986 0 $43,715.16 $51,190.07 4.6450 0 $48,992.75 $55,104.80
Black median household income ($)** 8.2790 0 $30,802.82 $39,852.65 9.4206 0 $30,812.07 $42,732.31
Per capita income ($)** 5.5766 0 $20,589.46 $24,054.04 3.9761 0.0001 $22,803.79 $25,927.32
Civilian labor force (%)** 8.9738 0 59.13% 64.18% 4.7792 0 58.46% 61.22%
Unemployment (%)** -5.2050 0 6.93% 5.24% -4.4875 0 12.92% 10.94%
Poverty (%)** -8.6882 0 17.22% 11.57% -6.2427 0 22.24% 16.97%
White poverty (%)** -4.5048 0 11.33% 8.9% -1.9332 0.0540 14.22% 12.88%
Black poverty (%)** -6.3490 0 25.1% 18.32% -5.8720 0 33.18% 24.46%
Median House Value ($)** 4.7196 0 $104,651.60 $125,677.20 3.2142 0.0014 $147,834.90 $171,396.80
Median Rent ($)** 9.4280 0 $430.94 $533.23 -4.2787 0 $662.51 $543.74
Multi-family units (% of total units) -0.6286 .5300 17.17% 16.38% -0.9532 0.3412 18.34% 17.09%
Owner Occupied (%)** 4.1425 0 57.71% 62.60% 3.5365 0.0005 53.75% 57.92%
Occupied (%)** 3.3604 0.0009 87.84% 89.94% 1.3682 0.1721 86.48% 87.32% ** p<0.05 for 2000 or 2010
* p<0.10 for 2000 or 2010 All dollars are in 2010 dollars
The differences between neighborhoods with and without buyouts are highly significant (p<0.05). The differences between neighborhoods with and without buyouts confirm that buyouts happen mostly in areas with a higher percent Black population which correlates to lower median household incomes than tracts without buyouts. The percent owner occupied, median house value, median rent, labor force participation, and percent White are all higher in areas without buyouts in both 2000 and 2010. Conversely, unemployment rates, poverty, and percent Black are all higher in neighborhoods with buyouts in both 2000 and 2010.
Effect of buyouts in conjunction with the Recession on neighborhood change
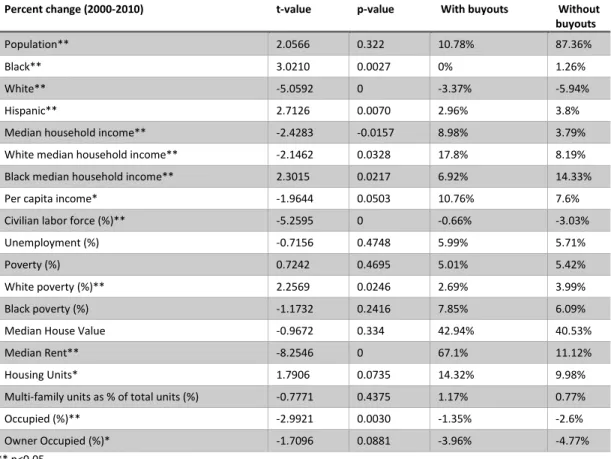
Table 5: Change in neighborhood characteristics (2000-2010)
Percent change (2000-2010) t-value p-value With buyouts Without buyouts
Population** 2.0566 0.322 10.78% 87.36%
Black** 3.0210 0.0027 0% 1.26%
White** -5.0592 0 -3.37% -5.94%
Hispanic** 2.7126 0.0070 2.96% 3.8%
Median household income** -2.4283 -0.0157 8.98% 3.79%
White median household income** -2.1462 0.0328 17.8% 8.19%
Black median household income** 2.3015 0.0217 6.92% 14.33%
Per capita income* -1.9644 0.0503 10.76% 7.6%
Civilian labor force (%)** -5.2595 0 -0.66% -3.03%
Unemployment (%) -0.7156 0.4748 5.99% 5.71%
Poverty (%) 0.7242 0.4695 5.01% 5.42%
White poverty (%)** 2.2569 0.0246 2.69% 3.99%
Black poverty (%) -1.1732 0.2416 7.85% 6.09%
Median House Value -0.9672 0.334 42.94% 40.53%
Median Rent** -8.2546 0 67.1% 11.12%
Housing Units* 1.7906 0.0735 14.32% 9.98%
Multi-family units as % of total units (%) -0.7771 0.4375 1.17% 0.77%
Occupied (%)** -2.9921 0.0030 -1.35% -2.6%
Owner Occupied (%)* -1.7096 0.0881 -3.96% -4.77%
** p<0.05 * p<0.10
The presence of buyouts is correlated significantly with differences in rates of change for various neighborhood characteristics. Tracts with buyouts saw significantly less population growth than neighborhoods without buyouts. Unemployment and poverty rates increased more in neighborhoods with buyouts and median house values increased much more in neighborhoods without buyouts. Median rents in tracts with buyouts saw a significant increase (67.1%) compared to those without (11.12%). The loss of housing stock due to the flooding and the buyout program likely put a strain on the housing market by reducing the supply at a faster rate than demand. The slight increase in occupied housing as a percent of all housing units from 2000 to 2010 for neighborhoods with over 1% buyout ratio supports this assumption as well.
One would expect the percent of Black residents to increase in neighborhoods with buyout and decrease in neighborhoods without but this is not the case. One explanation for this finding is that the Hispanic population in North Carolina grew as a proportion of the total population from 2000 to 2010. This explains why we see a decline in percent White population in both neighborhoods, no change Black percent of population in neighborhoods with buyouts and a small increase in percent Black population in neighborhoods without buyouts.
Analysis of home loan approval likelihood in relation to concentration of buyouts using logistic regression
White neighborhoods were defined as over 70% White because the percent White in North Carolina has remained around 70% on average. Neighborhoods with less than 50% White residents were considered minority neighborhoods.
Regression equation
𝑙𝑜𝑔𝑖𝑡(𝑎𝑝𝑝𝑟𝑜𝑣𝑎𝑙𝑠)
= 𝑏(𝑎𝑐𝑞𝑢𝑖𝑟𝑒𝑑) + 𝑏(𝑟𝑎𝑐𝑒) + 𝑏(𝑠𝑒𝑥) + 𝑏(𝑙𝑜𝑔𝑎𝑚𝑜𝑢𝑛𝑡) + 𝑏(𝑙𝑜𝑔𝑖𝑛𝑐𝑜𝑚𝑒) + 𝑏(𝑙𝑜𝑎𝑛𝑖𝑛𝑐) + 𝑏(𝑐𝑜𝑠𝑖𝑔𝑛𝑒𝑟) + 𝑏(ℎ𝑜𝑢𝑠𝑖𝑛𝑔_𝑣𝑎𝑙𝑢𝑒) + 𝑏(𝑝𝑒𝑟𝑐𝑒𝑛𝑡_𝑤ℎ𝑖𝑡𝑒) + 𝑏(𝑦𝑒𝑎𝑟) + 𝑏(𝑣𝑎𝑐𝑎𝑛𝑐𝑦)
+ 𝑏(𝑚𝑒𝑑𝑖𝑎𝑛_ℎ𝑜𝑢𝑠𝑒ℎ𝑜𝑙𝑑_𝑖𝑛𝑐𝑜𝑚𝑒) + 𝑏(𝑢𝑛𝑒𝑚𝑝𝑙𝑜𝑦𝑚𝑒𝑛𝑡) + 𝑏(𝑜𝑤𝑛𝑒𝑟 𝑜𝑐𝑐𝑢𝑝𝑖𝑒𝑑) + 𝑏(𝑑𝑒𝑛𝑠𝑖𝑡𝑦) Results from Logistic Regressions
Table 6: Pre-Recession, all applicants
Number of observations 96,071
LR chi2(16) 5646.53
Prob>chi2 0
Log likelihood -30704.86
Pseudo R2 0.0842
Variable Coef. Std. Err. z P>z [95% CI]
acquired -0.167336 0.605588 -0.28 0.782 -1.354267 1.019595 white_applicant 0.744024 0.0264847 28.09 0 0.692115 0.795933 female 0.0496884 0.0230437 2.16 0.031 0.0045236 0.0948533 logamount 0.2568791 0.0224067 11.46 0 0.2129627 0.3007955
logincome 0.65521 0.030572 21.43 0 0.59529 0.71513
loaninc 0.0240266 0.0106724 2.25 0.024 0.0031092 0.0449441 cosigner -0.040965 0.0248191 -1.65 0.099 -0.089609 0.00768 mhmval12 -3.18E-06 3.53E-07 -9.03 0 -3.88E-06 -2.49E-06
hinc12 0.0000306 1.52E-06 20.1 0 0.0000276 0.0000336
pwhite -0.068007 0.0637906 -1.07 0.286 -0.193035 0.05702
year
2005 0.0320906 0.0291934 1.1 0.272 -0.025127 0.0893087 2006 0.0149551 0.0294504 0.51 0.612 -0.042767 0.0726767 2007 0.147693 0.0328403 4.5 0 0.0833273 0.2120588 vacancy -0.27089 0.1391974 -1.95 0.052 -0.543712 0.0019315 owner_occupied -1.741988 0.1321244 -13.18 0 -2.000947 -1.483029
density 5.98E-06 0.000015 0.4 0.69 -2.35E-05 0.0000354
_cons -8.66775 0.2566423 -33.77 0 -9.17076 -8.16474
Table 7: Post-Recession, all applicants
Number of observations 35,652
LR chi2(16) 620.06
Prob>chi2 0
Log likelihood -8188.749
white_applicant 0.1743336 0.0570565 3.06 0.002 0.062505 0.2861622 female 0.1321865 0.0474561 2.79 0.005 0.0391742 0.2251988 logamount 0.4340412 0.03514 12.35 0 0.3651681 0.5029143 logincome -0.114528 0.0449661 -2.55 0.011 -0.20266 -0.026396
loaninc -0.01546 0.0039523 -3.91 0 -0.023207 -0.007714
cosigner 0.2032275 0.0488214 4.16 0 0.1075392 0.2989157 mhmval12 -5.54E-07 4.05E-07 -1.37 0.171 -1.35E-06 2.38E-07 hinc12 5.97E-06 2.44E-06 2.45 0.014 0.0000012 0.0000108
pwhite 0.5933929 0.1419781 4.18 0 0.3151209 0.8716649
year
2013 0.1016419 0.0575733 1.77 0.077 -0.0112 0.2144835 2014 0.4841576 0.0638279 7.59 0 0.3590573 0.609258 2015 0.5463366 0.0634881 8.61 0 0.4219022 0.6707709
vacancy -1.136144 0.2596297 -4.38 0 -1.645009 -0.62728
owner_occupied -0.694653 0.2247551 -3.09 0.002 -1.135164 -0.254141 density 0.0000562 0.000031 1.81 0.07 -4.55E-06 0.000117
_cons -1.639219 0.4542166 -3.61 0 -2.529467 -0.748971
Table 8: White applicants post-Recession
Number of observations 29,059
LR chi2(16) 445.56
Prob>chi2 0
Log likelihood -6204.961
Pseudo R2 0.0347
Variable Coef. Std. Err. z P>z [95% CI]
acquired -2.972266 1.822564 -1.63 0.103 -6.544426 0.5998946 female 0.0538836 0.0555317 0.97 0.332 -0.054957 0.1627237 logamount 0.4420728 0.0406306 10.88 0 0.3624382 0.5217073 logincome -0.108819 0.0516387 -2.11 0.035 -0.210029 -0.007609
loaninc -0.016594 0.0041769 -3.97 0 -0.02478 -0.008407
cosigner 0.1695206 0.0559484 3.03 0.002 0.0598638 0.2791774 mhmval12 -6.2E-07 4.27E-07 -1.45 0.146 -1.46E-06 2.17E-07
hinc12 4.94E-06 2.64E-06 1.87 0.062 -2.39E-07 1.01E-05
pwhite 0.5249216 1.68E-01 3.13 0.002 0.1962087 0.8536346
year
Table 9: Black applicants post-Recession
Number of observations 6,593
LR chi2(16) 123.64
Prob>chi2 0
Log likelihood -1961.884
Pseudo R2 0.0305
Variable Coef. Std. Err. z P>z [95% CI]
acquired 5.185746 2.404199 2.16 0.031 0.4736015 9.89789
female 0.3284216 0.0890755 3.69 0 0.1538367 0.5030064
logamount 0.3625962 0.0818783 4.43 0 0.2021177 0.5230746 logincome -0.091149 0.1087165 -0.84 0.402 -0.304229 0.1219318 loaninc 0.0061227 0.0290372 0.21 0.833 -0.050789 0.0630346 cosigner 0.2752455 0.1016262 2.71 0.007 0.0760617 0.4744293 mhmval12 -4.66E-07 0.0000015 -0.31 0.756 -3.4E-06 2.47E-06
hinc12 9.39E-06 7.16E-06 1.31 0.19 -4.64E-06 2.34E-05
pwhite 0.6919623 2.98E-01 2.33 0.02 0.1086436 1.275281
year
2005 0.0827104 0.1107146 0.75 0.455 -0.134286 0.2997071 2006 0.5996926 0.1282488 4.68 0 0.3483296 0.8510557 2007 0.6966856 0.1302783 5.35 0 0.4413449 0.9520263 vacancy 0.5492382 0.7751745 0.71 0.479 -0.970076 2.068552 owner_occupied -1.290844 0.428137 -3.02 0.003 -2.129977 -0.451711 density -0.000154 0.000066 -2.33 0.02 -0.000283 -2.45E-05 _cons -1.236362 1.027823 -1.2 0.229 -3.250857 0.7781334
Black and White applicants
At first glance, buyouts seem to not influence the approval of a conventional home purchase loan applicant, the “acquired” variable representing the buyout ratio was not significant for either pre or post-Recession period (Tables 6 & 7). However, looking specifically at White and Black applicants, the buyout ratio had a significantly positive impact on approval likelihood for Black applicants after the Recession (p>z=0.031) (Table 9). The buyout ratio remains insignificant before the Recession for both Black and White applicants (Tables A & B in Appendix) and for White applicants after the Recession (Table 8). Depending on the race of the applicant and timing of the application (pre or post-Recession), buyouts had varying impacts on loan approval likelihoods.
White and minority neighborhoods
Applicants in minority neighborhoods also saw a significant positive relationship between the buyout ratio and approval likelihoods both before and after the Recession (p>z=0.086 and p>z=0.041 respectively) (Table F in Appendix). For applicants in White neighborhoods, after the Recession there is a significant negative relationship (p>z=0) between the buyout ratio and loan approval likelihood (Tables C & E in Appendix).
values and adjusting the buyout ratio at .001 increments from .001 to .5. I then graphed the estimated likelihood of approval at each value. The following graphs describe the likelihood of loan approval given changes of the neighborhood’s buyout ratio in which the applicant is applying. The lines describe the likelihood of approval at a given buyout ratio holding all other variables constant.
Figure 9: Post-Recession Approval Likelihoods for Black and White applicants
Source: HMDA 2004-2015, NCEM, Decennial Census 2000 & 2010, ACS 5-year estimates (2008-2012)
After the Recession, the buyout ratio White and Black applicants differently. On average, White applicant’s likelihood of loan approval declined as the buyout ratio increased. Black applicant’s approval likelihood increased as the buyout ratio increased. In the tracts with lower buyout ratios, White applicant’s approval likelihoods are higher than Black applicants. They then flip at about 0.03 buyout ratio.
Figure 10: White Applicants before and after the Recession
Source: HMDA 2004-2015, NCEM, Decennial Census 2000 & 2010, ACS 5-year estimates (2008-2012)
80% 82% 84% 86% 88% 90% 92% 94% 96% 98% 100%
0 0.05 0.1 0.15 0.2 0.25 0.3 0.35 0.4 0.45 0.5
Ap p ro val Lik eliho o d
Buyout Ratio (total buyous in a tract/total housing units) Black Applicants White Applicants
80% 82% 84% 86% 88% 90% 92% 94% 96% 98% 100%
0 0.05 0.1 0.15 0.2 0.25 0.3 0.35 0.4 0.45 0.5
Ap p ro val Lik eliho o d
The buyout ratio’s influence on White approval likelihoods is smaller before the Recession than after. The trend remains that as the buyout ratio increases, White approval likelihoods decrease.
Figure 11: Before and After the Recession Black Applicants
Source: HMDA 2004-2015, NCEM, Decennial Census 2000 & 2010, ACS 5-year estimates (2008-2012)
In contrast to White applicants, Black applicants saw a significant change in their approval likelihood from before and after the Recession. The buyout ratio became more significant after the Recession for Black applicants.
Figure 12: Post-Recession Loan Approval Likelihood for Majority White and Minority Neighborhoods
80% 82% 84% 86% 88% 90% 92% 94% 96% 98% 100%
0 0.05 0.1 0.15 0.2 0.25 0.3 0.35 0.4 0.45 0.5
Ap
p
ro
val
Lik
eliho
o
d
Buyout Ratio (total buyous in a tract/total housing units) Pre-Recession Post-Recession
92% 94% 96% 98% 100%
0 0.05 0.1 0.15 0.2 0.25 0.3 0.35 0.4 0.45 0.5
Ap
p
ro
val
Lik
eliho
o
d
After the Recession, applicants in minority neighborhoods with buyouts were more likely to be approved for a loan than those in White neighborhoods with buyouts. Both applicants in minority and White neighborhoods increase their approval likelihood as the buyout ratio increases at about the same rate. Discussion of Findings
At first an increase in buyouts leading to an increased likelihood of loan approval would seem counter intuitive, but the explanation lies in the relationship between incomes, loan amounts, home values, and the relative differences in these values between areas with and without buyouts. It is logical to assume that because neighborhoods with buyouts have lower home values and median household incomes than
those without, applicant’s in these neighborhoods have to put in a smaller down payment to be approved
for a loan. To test this assumption, Table 10 below compares incomes and loan amounts in areas with and without buyouts.
Table 10: Applicant income and loan amount pre- and post-Recession for home purchase loans
Pre-Recession (2004-2007) Post-Recession (2012-2015) % Change (pre to post-Recession) Applicant
Income (mean)
Loan Amount (mean)
Applicant Income (mean)
Loan Amount (mean)
Applicant Income
Loan Amount Without
Buyouts $ 93,160 $175,959 $ 92,082 $ 192,947 -1.2% 9.65% With
Buyouts $ 88,204 $ 165,604 $ 87,650 $ 174,461 -0.06% 5.3%
The average loan amount for applicants in buyout neighborhoods is lower than non-buyout neighborhoods both before and after the Recession. From before to after the Recession, the average loan amount increased more for applicants in neighborhoods without buyouts while incomes in neighborhoods with and without buyouts stayed relatively stable. Median house values in buyout neighborhoods remained lower than those without buyouts (Table 4) and did not change as much as non-buyout neighborhoods pre to post-Recession (Table 5). Additionally, the loan amounts applied for in neighborhoods with buyouts were lower and increased less pre- to post-Recession than neighborhoods without buyouts (Table 9 above). The results in Table 9 confirm that the likely reason for an increase in approval likelihoods in buyout areas is related to the disproportionate effect of the Recession on incomes and home values in areas with buyouts compared to those without.
VII. Conclusion and Implications
decline in labor force participation, and a significant increase in median rents among other indicators of economic hardship (Table 5).13
While homeownership is touted as the primary means of building wealth, the longevity of an investment in a buyout neighborhood is uncertain due to its proximity to the floodplain. The households leftover in a buyout neighborhood were either not significantly damaged from flooding, did not pass FEMA’s cost benefit analysis to qualify, or qualified but refused the buyout offer. In general, neighborhoods with buyouts are at higher risk of flooding than areas without buyouts. For many areas, this risk will likely only increase in the future as climate change produces more severe weather events and extends the floodplain boundary.
Black borrowers are able to invest in homes in neighborhoods at risk of flooding and this could have long-term ramifications for increasing the racial wealth disparity. Investing in a home in a buyout neighborhood may be a smart financial decision, but the vulnerability of that investment, because of its flood risk, is not accounted for in the value of the home. If it were, it would likely prevent one from investing in it to build wealth. The market is essentially incentivizing investment in environmentally vulnerable areas through lower home values in flood prone areas.
Buyouts only become a statistically significant factor of loan approvals for Black applicants after the Recession. Before the Recession the buyouts had no significant impact on the likelihood of loan approvals but after the Recession, buyout neighborhood’s lower home values presented an opportunity for home ownership for lower or moderate-income borrowers; unfortunately, this opportunity is mostly in high risk areas. In turn, the Recession affected buyout neighborhoods differently than it did non-buyout neighborhoods. This ultimately undermines the security of lower and middle-class borrower’s investment. In particular, Black households have disproportionately invested in these high-risk neighborhoods. As a consequence, Black borrowers are at risk of losing their investment and failing to build wealth more so than their White counterparts.
The disproportionate impact on Black households is not an innate characteristic of the buyout program. A community’s affordable housing stock is often destroyed after a flooding event as most naturally occurring affordable housing and public housing is vulnerable to flooding (Glavovic & Smith 2014). As Glavovic and Smith explain, after Fran and Floyd, the loss of affordable housing posed a serious issue and inhibited municipalities ability to attract residents back to their communities. Therefore, the issue is not the location of buyouts but the location of affordable housing. If there is little affordable housing outside of flood prone areas, home buyers looking for more affordable investment options outside of high-risk areas have little recourse than to make the riskier investment.
Practically speaking, naturally occurring affordable housing will be smaller than surrounding homes so as to be more affordable. While size may deter borrowers from investing in a home, if the intention of the borrower is to make a secure investment to build wealth, investing in a smaller home not exposed to flood risk would provide more security.
The conversation surrounding affordable housing post-disaster focuses on rebuilding rental units. I emphasize in importance of naturally occurring affordable housing because this analysis shows there is a demand is for for-sale affordable units, not rentals. Constructing subsidized affordable housing through the Low-Income Housing Tax Credit would serve renters and demand for affordable home investment options would still not be redirected out of the floodplain. This is not to say that affordable rental housing is not an equally important issue, but, LIHTC is not a solution for the purpose of addressing the disproportionate risk of Black borrowers making high risk investments.
It is important to note that the ability to create more affordable housing that will remain affordable for years to come may be an option unique to rural areas. For example, this suggestion may be irrelevant in post-Sandy New York, where most construction, may still become unaffordable for those looking for lower cost home investment opportunities (regardless of if it was inside or outside of the floodplain, or the size of the house). In rural areas with stable or declining populations, the risk of housing markets outpricing lower-income investors is lower. Additionally, the opportunities for infill development in less dense rural settings may be greater.
There are also significant complexities and complications to building new housing stock in any municipality or community especially after a disaster. There is often a strong racial and economic divide between areas in and outside of the floodplain. This is a significant issue, in rural North Carolina. Cultural difference intertwined with unequal economic opportunity are often long standing and deeply entrenched in the social fabric of a town. Building more affordable for-sale housing outside of the floodplain would likely disrupt familiar and established racial, economic, and cultural divides. It may also bring concerns over home devaluation if smaller homes are sited near larger ones. The complexity of each communities’ situation and needs would have to be considered in any proposed development.
Considering the legacy of residential segregation and environmental racism in the U.S., it is not surprising that Black populations today reside in proximity to the floodplain. However, buyouts do not automatically result in negative outcomes for participating neighborhoods or exposure to high-risk investment for Black borrowers. The conditions of the neighborhoods in which buyouts occur are crucial to better understanding how buyouts may impact different groups. The buyout program should be implemented with an understanding of how it may impact the neighborhoods that participate given their particular context.
The findings from this research have far reaching implications for disaster recovery policy and add to our understanding of how buyouts interact with financial crises and contribute to racial disparities. While buyout neighborhoods may create opportunities for Black homeownership, they may not be good wealth building opportunities. Creating affordable for-sale housing options outside of the floodplain will increase
a community’s resilience to future disasters. Additionally, pre-disaster planning for buyouts that account
for these predictable outcomes can mitigate their negative consequences.
Notes and suggestions for future research
The results from this research imply that the use of buyouts as a hazard mitigation strategy is producing market conditions that further segregate residential areas. Future research should look further into this hypothesis to understand how neighborhood diversity and economic opportunity change in communities, towns, and cities that participate in the buyout program. Anecdotally, some towns in North Carolina noted a jump in foreclosure rates in the years after Floyd and have attributed this to the fact that buyout participants received the extra SARF money from the State and purchased a home but their incomes did not change and they could not keep up with taxes and mortgage payments. Future research on this topic should use foreclosure rates to assess the impact of the buyouts before and after the Recession. Relatedly, future research should assess how neighborhoods adjacent to areas with buyouts are impacted by the
program’s implementation. Buyout participants move to other areas, purchasing or renting homes, maybe