CO-OCCURRENCE OF INTIMATE PARTNER VIOLENCE AND OPIOID USE IN NORTH
CAROLINA: A COUNTY-LEVEL ANALYSIS
By
Eliza Johannah Filene
Senior Honors Thesis Department of Public Policy
University of North Carolina at Chapel Hill March 22, 2018
Approved:
_______________________ (Student’s Chair)
ABSTRACT
This paper examines the relationship between assault against women and death from
unintentional opioid overdose across counties in North Carolina between the years 2010 and
2015. This analysis uses opioid overdose death data as well as assaults against women in North
Carolina to examine co-occurrence across counties.
Using county and year fixed-effects, I found a positive relationship between assault
against women and opioid overdose death in non-rural counties and a slightly negative
relationship in rural counties. This is finding may be due to measurement error created by low
levels of assault reporting in some counties over time. Based on findings of the geographical
trends of co-occurring overdose and assault against women as well as the limitations of this
analysis, this paper makes recommendations for future research and policy initiatives for
ACKNOWLEDGMENTS
This project was made possible by the Tom and Elizabeth Long Research Award.
Thank you to Dr. Christine Durrance, my incredible faculty mentor, for your unwavering support, generosity, and coaching throughout this process. Thank you to Dr. Meghan Shanahan, my second reader, for your invaluable guidance in developing my topic and your input over the past year.
TABLE OF CONTENTS
CHAPTER I: SIGNIFICANCE AND SPECIFIC AIMS………...5
CHAPTER II: BACKGROUND AND CONCEPTUAL FRAMEWORK………...8
CHAPTER III: DATA AND EMPIRICAL STRATEGY………..…..………14
CHAPTER IV: RESULTS………..………..…..………21
CHAPTER V: CONCLUSIONS……….………..…….…………26
REFERENCES…..……….………..………33
CHAPTER I: SIGNIFICANCE AND SPECIFIC AIMS
The opioid epidemic has garnered considerable attention for the high numbers of
opioid-related deaths and overdoses that have affected communities across the U.S. Opioids are a
category of drug taken to reduce pain. The opioid epidemic refers to a rapid influx of illicit use
of prescription opioids such as oxycodone, hydrocodone, morphine, and methadone, as well as
illicit opioids such as heroin and synthetic fentanyl. In the United States, more than six out of ten
deaths from drug overdose were due to opioids in 2014 (Rudd 2016, p. 1445). Since 1999, the
number of people who died due to heroin or prescription opioid overdose has quadrupled (CDC
2017a). While the opioid epidemic first came about due to a rapid increase in physician
prescribing and manufacturer distribution of prescription opioids, the epidemic has now morphed
to be an issue of illegal markets and illegal drug use.
The opioid epidemic has taken a harsh toll on the state of North Carolina. According to
the North Carolina Department of Health and Human Services (DHHS), between 1999 and 2016,
opioid-related overdose deaths increased by over 800% (Prescription Drug Abuse Advisory
Committee (PDAAC), 2017). In particular, heroin and other synthetic narcotics are a growing
concern in North Carolina, with 2,277 emergency department visits related to heroin overdose in
2016 compared to 311 in 2011 (NC DHHS, 2017, p. 2), an increase of 632%.
Women’s risk of dying from an opioid overdose is increasing at a greater rate compared
to men. Between 1999 and 2010, overdose deaths from prescription painkillers increased more
than 400% among women, compared to an increase of 265% among men (CDC 2017b). Women
of reproductive age are prescribed opioids at higher rates, with one in four women with private
insurance filling a prescription for opioids, and one in two women with Medicaid (Ailes et al.,
related to emotional distress (McHugh et al., 2013, 41) (Back 2011, p. 829). This trend extends
beyond legal opioids— between 2002 and 2013, heroin use increased 100 percent among
women, twice the rate of men (CDC, 2015a).
Women may become addicted to opioids more quickly than men, after using smaller
amounts drugs (NIDA, 2017, p. 1). Women are more likely to experience physical and sexual
trauma compared to men, putting them at higher risk for substance abuse disorders. In addition,
women are often introduced to intravenous drug use by their sexual partners (Greenfield, 2011,
p. 5). In turn, these substance abuse disorders put them at risk for intimate partner violence
(Smith 2012, p. 9).Women in rural areas are particularly at risk for opioid use disorders and
domestic violence due to economic vulnerability, availability of drugs, and social factors
(Lenardson 2016, p. 2) (Cole and Logan, 2010, p. 396) (Keyes et al., 2014).
I hypothesized that as county opioid overdoses increase over time, county reports of
violence against women would also increase. I expected that this relationship to be stronger in
rural counties compared to non-rural counties given the barriers to access to care and services in
those counties. This project uses assault on women as a proxy for intimate partner violence (IPV)
and opioid overdose death as a proxy for opioid use. By identifying areas of high co-occurrence
in North Carolina, this analysis will expose potential avenues for addressing opioid dependence
and domestic violence, thereby helping to protect the health of some of our state’s most
vulnerable citizens.
The relationship between female victimization and abuse of opioids has been well
established. However, little data have been analyzed in the context of the recent dramatic
increase in abuse of prescription opioids and other synthetic opioids across the United States. By
Carolina, this paper will explore the ways violence, addiction, and rurality are linked at a macro
as well as micro level.
In the following chapter, I will outline the findings of other studies about the opioid
epidemic in the context of women, and the complex links between domestic violence, addiction
and opioid use disorders, and geography. Chapter 3 will describe the data sources and empirical
methodology used for this project. Chapter 4 will display the empirical results of the data
analysis as well as assess the strengths and weaknesses of the empirical design. Lastly, Chapter 5
CHAPTER II: BACKGROUND AND CONCEPTUAL FRAMEWORK
Research supports that women’s health is particularly at risk in the opioid epidemic.
Opioid use disorders increase women’s likelihood of experiencing violence. Conversely, women
who have experienced violence are at risk for developing opioid misuse disorders. The literature
finds that this cycle is particularly difficult to break in rural areas in the United States, where
numerous factors put people at risk and hinder their ability to emerge from the cycles of
addiction.
Women and Opioid Use Disorders
In general, women tend to progress more quickly than men from the point of initial
substance use to problematic use of the substance. This rapid progression from the onset of
substance use disorders to addiction is referred to as “telescoping” in the literature and is largely
due to physiological differences between men and women. This phenomenon has been observed
in alcohol addiction as well as in women who are drug dependent (Hernandez-Avila, 2004: 265).
Consistent with the telescoping trend, women may become addicted to opioids more quickly than
men, after using smaller amounts of the drug (NIDA, 2017).
Studies have shown women’s risk of dying from an opioid overdose is increasing at a
greater rate compared to men. Between 1999 and 2010, overdose deaths from prescription
painkillers increased more than 400% among women, compared to an increase of 265% among
men (CDC 2017b). Women’s use of heroin is also a growing concern— between 2002 and 2013,
heroin use increased 100 percent among women, twice the rate of men (CDC, 2015a).
Women face certain mental health factors that increase their risk for substance abuse
disorders, including opioid use. Emotional and psychological stress is a more pronounced risk
likely to use opioids to cope with personal stress compared to men—72.7% of women in the
sample versus 27.3% men (Back 2011, p. 5). Women are more likely than men to have
co-occurring mental health problems such as anxiety and depression along with substance use
disorders. In addition, women often start using drugs in the context of an interpersonal
relationship (Greenfield, 2011, p. 5).
Numerous studies have explored the links between substance abuse and trauma in
women. Adult experiences of trauma and adverse childhood experiences have been shown to
increase a person’s likelihood to experience substance use disorders. Women who misuse
substances are significantly more likely to have experienced trauma in their lifetimes compared
to women in the general population (Najavit 1997, p. 274). Physical and sexual trauma are more
likely to be experienced by women struggling with substance abuse disorders compared to men
(Covington 2008, p. 380). Cocaine and opioids are significantly more linked to PTSD compared
to marijuana and alcohol. Women are more likely to have co-occurring PTSD and substance
abuse disorders compared to men, thereby increasing their risk for opioid use disorders—
substance abuse disorders also increase a person’s risk for PTSD (Najavit 1997, p. 274).
Women’s unique roles in family structures impede their desires to seek treatment for
opioid misuse disorder. Women who are caregivers are less likely to seek treatment because of
the responsibilities associated with caring for children and fear that their children will be taken
away. In addition, there is a greater societal stigma associated with substance abuse disorders in
women compared to men(SAHMHSA 2009, p. 2). Women’s high risks for opioid use disorders
as well as co-occurring experiences of violence and mental illness suggest that they are an
Domestic Violence and Opioid Use Disorders
Intimate partner violence (IPV) and the opioid epidemic are inextricably linked (Smith
2012, p. 1). Trauma and mental health issues put women at risk for opioid misuse disorders
while also increasing women’s chances of experiencing violence.
Domestic violence is a complex public health issue. Male-perpetrated IPV against women
has been linked to traditional gender roles in our society, specifically the norm of male
dominance (Santana 2006, p. 576). Domestic violence is widespread—over 1/3 of women will
experience domestic violence in their lifetime—including rape, physical violence, or stalking
(Black et al. 2010, p. 2). Both domestic violence victimization and perpetration have been
strongly associated with mental disorders such as depression and substance abuse.
The directionality of the relationship between domestic violence and substance use
disorders has long been disputed. The experience of violence can bring on substance use
disorders. On the other hand, substance abuse disorders may bring about victimization or
perpetration of violence.
In a study by Smith et al, opioid use disorders were associated with intimate partner
violence victimization in women but not in men. This suggests that a woman having an opioid
use disorder increases the likelihood that she will experience violence (Smith et al., 2012, p. 1).
Women experiencing violence may also be more likely to turn to opioids to relieve physical
and/or emotional pain. As explained by the authors, this difference in victimization between men
and women may be due to the fact that the using patterns of opioids are different for women
compared to men, and that women are more likely to experience psychological and physical
Women are at risk in many ways when they are in an environment of addiction. The
positive and complex association between domestic violence and opioid use disorders
enumerated in the literature further illustrates the importance of considering this link.
Opioids in the Southern United States
This analysis will focus on counties across the state of North Carolina. According to a
CDC analysis of a large commercial database of prescriber trends, Southern states have higher
rates of overprescribing of opioid pain relievers compared to other regions in the United States.
In 2012, North Carolina ranked 13th in the nation for prescribing of opioid pain relievers, with
96.6 prescriptions per 100 people (Paulozzi, 2012, 126). Between 1999 and 2016, over 12,000
North Carolinians died from an opioid overdose.
Opioids in Rural Areas
People living in rural areas in the United States are particularly at risk for opioid misuse
disorders. According to a report by the Office of Women’s Health, death rates from drug
overdose for women are most pronounced in rural areas in the South and Midwest (Office on
Women’s Health).
In 2015, rates of drug overdose deaths in rural areas surpassed rates in urban areas in the
United States, reversing a previous trend. In 2015, the nonmetropolitan rate of overdose was 17
per 100,000 and the metropolitan rate was 16.2. The percentage change in the number of drug
overdose deaths for females increased nearly 350% in non-metropolitan areas (Mack, 2017, p.
5).
Certain vulnerable populations are especially at risk in rural areas, including young
people, pregnant women, women experiencing domestic violence, and people with co-occurring
adolescents to engage in non-medical prescription drug use (Havens, 2011, p. 250). Additionally,
people with opioid use disorders are more likely to be under the age of 20, have poor health,
have low levels of education, be low income, be unmarried, and lack health insurance. People
who use opioids in rural areas are more likely to be unemployed compared to those in urban
areas (Lenardson, 2016, p. 3). In a sample of women who had recently experienced domestic
violence, using opioids was significantly associated with the cumulative amount of interpersonal
violence experienced throughout her lifetime as well living in rural Appalachia (Cole and Logan,
2010). Certain factors that put rural areas in the South at risk for non-medical prescription drug
use have been identified in the literature. According to Keyes et al., these factors include greater
availability of opioid drugs, out-migration of young people, interconnected kinship networks,
and economic vulnerability (Keyes et al., 2014, p. e54-e55).
Strengths and Weaknesses of Prior Research
Prior research on this topic has focused on observing the relationship between opioid use
disorders and risk for violence at the individual level. However, no research examines this
relationship at the macro level. In order to create policies that are cost-effective and successful in
reducing opioid use disorders and domestic violence, we must inform public policy using
evidence-based approaches at the population level. This analysis will attempt to observe trends
discovered in small sample sizes at a larger scale. It is important to observe such trends at the
state level in order to identify the policy manifestations of smaller scale trends in individual
behavior. By using population-level data, we can pinpoint opportunities for policy intervention—
analysis at the broader level considers the collective aspects of these individual-level processes,
whereas existing literature identifies the trends in how individuals in a small sample experience
Existing literature about the opioid epidemic largely focuses on men. This analysis will
examine the impact of the opioid epidemic on women, giving special consideration to the
circumstances faced by people living in rural areas. Policies to combat opioid misuse typically
are made at the state level. As such, analysis of county-level data is important in order to provide
clear and persuasive information on the burden of opioid use disorders and violence against
women. This analysis will inform interventions designed to mitigate that burden.
This analysis will not be able to identify the direction of causation due to the
bi-directional nature of the relationship between substance use and violence against women—
women’s experience of violence puts them at risk for substance use disorders. On the other hand,
substance abuse disorders may bring about victimization. Many other factors such as
socioeconomic status, availability of resources, and other mental health factors are also at play.
This analysis will control for county-level measures including unemployment, availability of
healthcare providers, and poverty, as well as county and year fixed effects. Regardless of the
causality of the relationship, it is important for policymakers to be aware of the co-occurrence of
CHAPTER III: DATA AND EMPIRICAL STRATEGY Description of Data
In this analysis, I explore the relationship between opioid use and violence against
women. To measure this relationship, data from the Injury and Violence Prevention Branch
Epidemiology Surveillance Unit of the North Carolina Division of Public Health at the North
Carolina Department of Health and Human Services (DHHS) for counts of opioid overdose
death. Using a linear regression model (Ordinary Least Squares) and a Poisson count model with
fixed effects, the relationship between assault against women and opioid overdose death in
counties across North Carolina between the years 2010-2015 will be investigated.
North Carolina has 100 counties, which I observe over a period of 6 years from
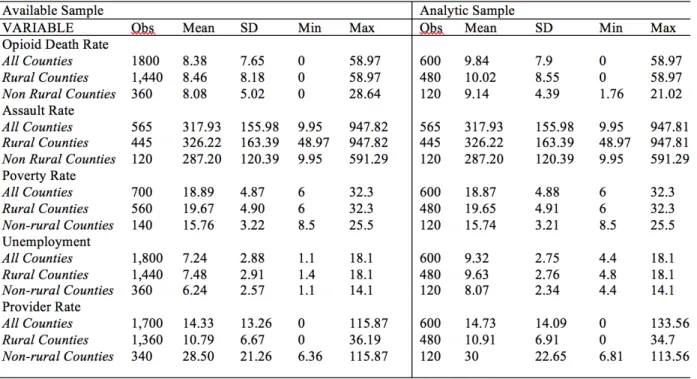
2010-2015. For key summary statistics about the available sample when comparing rates of opioid
overdose death and assault against women, see Tables 2 and 3. For the Poisson analysis and the
linear regression analysis observing the co-occurrence of opioid death and assault against
women, the maximum total number of observations was 565, with 445 observations when
restricting the analysis to rural counties, and 120 observations for non-rural counties (see Tables
2 and 3).
NC DETECT
Counts of assault against women that present to emergency departments were obtained
from the North Carolina Disease Event Tracking and Epidemiological Collection Tool (NC
DETECT). Rates are defined as the number of incidences divided by the county population in a
given year (obtained from CDC WONDER) and scaled by 100,000.
A statewide mandate requires all civilian emergency departments in North Carolina to
the North Carolina Department of Health and Human Services (DHHS) as well as through
federal grants from the Centers for Disease Control and Prevention (CDC). Counts of opioid
overdose deaths are publicly available from DHHS.
Key Variables
Opioid Death: Opioid overdose death rates are used as a proxy for measuring opioid use. Emergency department data on opioid-related visits was gathered, but missing data and restricted
availability of years prevented these data from being utilized in this analysis. Opioid use is
underreported and difficult to measure (Puja et al., 2018, p. 500). The proxy measure of opioid
overdose death is also underreported (Ruhm, 2017).
Rates of opioid overdose death were collected by using the counts of unintentional opiate
poisoning deaths by county of NC residents from the years 1999-2016. An unintentional
poisoning is defined as occurring “when a person taking or giving too much of a substance did
not mean to cause harm” (CDC, 2015b). These deaths included unintentional deaths due to
opium, heroin, other opioids, methadone, or other synthetic opioids.
Rates were measured as the count of opioid overdose death divided by the population
and scaled by 100,000 by county and year.
Rates of opioid overdose death have increased dramatically across counties in North
Carolina over the past two decades. This trend is demonstrated in Figure 1, which includes
opioid overdose death rate averages for rural, non-rural, and the overall sample between the
years 1999 and 2016. As illustrated in Table 1, the mean opioid overdose death rate is slightly
higher in rural areas compared to non-rural counties. In addition, the maximum value is higher in
rural areas—58.97 per 100,000 compared to 28.65 per 100,000 in non-rural counties.
trend. From 1999 to 2016, I found that the percentage increase in opioid overdose deaths was
951.57% overall, 1174.25% for rural counties, and 517.02% for non-rural counties in North
Carolina.
Assault: According to the North Carolina Violent Injury Report, assault is defined as “a suspectedor confirmed injury or poisoning resulting from ‘an act of violence where physical
force (or poisoning) by one or more persons is used with the intent of causing harm, injury, or
death to another person’” (Harmon et al., 2017, p. 4). Only assaults against women were used in
this analysis.
Most cases of domestic violence are unreported (Gracia, 2004). I used assault against
women as a proxy for intimate partner violence. In doing so, I assume that this assault data
captures changes in violence against women and therefore estimates how opioids affect the
victimization of women in partnerships.
I obtained data of counts of assault against women from NC DETECT. I did not restrict
these counts to include assaults against women over the age of 18 because the literature suggests
many people start using opioids under the age of 18, disproportionately so in rural areas. I
wanted to capture the relationship between opioid overdose and violence for this younger
population. It should be noted that some of these counts may be instances of child abuse. To
create rates, I divided counts by the corresponding female population and scaled by 100,000. As
demonstrated by Figure 2, there has been an overall decline in the rates of assault against
women. The sharp decline in the year 2015 is due to low E-code reporting as a result of the
switch from ICD-9-CM to ICD-10-CM codes. The effect of this inconsistent reporting will be
discussed in Chapter 4.
higher standard deviation, as well as higher minimum and maximum values (See Table 1).
Other Variables
Population: To create rates consistent with the methods used in the Violent Injury Report, I used the CDC WONDER Bridged Population estimates for women. To create rates of
opioid overdose death, I used an overall population value not restricted to women.
Rural vs. Non-Rural Counties: This analysis uses the North Carolina Rural Center’s definition for rural, suburban, and urban areas to define counties as rural or non-rural. According
to the 2014 United States population estimates, there are 80 rural counties in North Carolina with
population densities of 250 people per square mile or less, making up 41 percent of the state
population. Suburban counties make up 14 of 100 counties in North Carolina, with population
densities between 250 and 750 people per square mile. These counties account for 25 percent of
the state population. Six counties with population densities between 750 and 1,933 people per
square mile make up the urban counties in North Carolina, accounting for 34 percent of the state
population. According to 2010 Census data, North Carolina has the second-largest rural
population in the nation. This analysis designated all counties as rural or non-rural. In North
Carolina, there were 80 rural counties and 20 non-rural counties.
Poverty: I controlled for poverty using a measure of poverty from the American Community Survey (ACS) by the U.S. Census Bureau. Specifically, I controlled for the
percentage of the county population whose income in the past 12 months is below the poverty
level. As illustrated in Figure 3, rates of poverty are higher in rural counties compared to
non-rural counties in North Carolina. According to this measure, the poverty rate is higher in non-rural
areas compared to non-rural areas (See Table 1).
queried the available data for physicians per 10,000 population. These data are derived from the
North Carolina Board of Medicine. The counts of physicians include those in practice in the state
as of October 31st of each year and do not include residents-in-training or federal employees.
The county estimates are based on primary practice location. Population data are from the North
Carolina Office of State Budget and Management based on US Census data (North Carolina
Health Professions Data System). There is a much lower ratio of physicians to population in rural
counties in North Carolina compared to non-rural counties (See Figure 4 and Table 1).
Unemployment: I queried the Local Area Unemployment Statistics (LAUS) program in the Bureau of Labor Statistics (BLS) for county-level unemployment rates for counties in North
Carolina. The BLS defines unemployed people as “all persons who had no employment during
the reference week, were available for work, except for temporary illness, and had made specific
efforts to find employment during the 4 week-period ending with the reference week. Persons
who were waiting to be recalled to a job from which they had been laid off need not have been
looking for work to be classified as unemployed.”
This unemployment rate was provided as the unemployed percent of the civilian labor
force—unemployed/civilian labor force times 100 (Bureau of Labor Statistics). Unemployment
in rural counties is higher compared to unemployment in non-rural counties in North Carolina
(See Figure 5 and Table 1.)
Empirical strategy
I estimated the co-occurrence of assault against women and opioid overdose death by
using two fixed effects models, which exploit within-county variation over time while
controlling for shocks that may have occurred across time.
been the same across North Carolina counties in the absence of differential changes in assaults
against women (Cunningham et al., 2017). Using a Poisson approach, I first estimate the
co-occurrence of opioid overdose death and assault on women corresponds to the following
equation:
𝑌!" =exp(𝛽!+𝛽!𝑜𝑝𝑖𝑜𝑖𝑑𝑑𝑒𝑎𝑡ℎ!"+𝛽!𝑝𝑟𝑜𝑣𝑟𝑎𝑡𝑒!"+𝛽!𝑝𝑜𝑣𝑟𝑎𝑡𝑒!"+𝛽!𝑢𝑛𝑒𝑚𝑝𝑙𝑟𝑎𝑡𝑒!"+𝜃!+𝜋!+ 𝜀!")
where Yct is the count of assault against women for county c in year t; 𝑜𝑝𝑖𝑜𝑖𝑑𝑑𝑒𝑎𝑡ℎctis the rate of
opioid overdose death for residents of county c in year t; provratectis the rate of physicians for
residents of county c in year t; povratect is the percentage of people below the poverty line in
county c in year t; unemplratectis the unemployment rate for county c in year t; ϴc are county
fixed effects, which control for unobserved county characteristics; πtare year fixed effects,
which control for time-varying factors affecting rates of assault in all North Carolina counties in
the same manner; and 𝜀 is the error term for county c in year t.
I interpret the results of the Poisson analysis by calculating the percentage change of the
counts of assault against women. I convert the natural log of the counts to percentage change by
calculating (exp(coefficient)-1)*100.
I use a linear regression with fixed effects as an alternative model with which to observe
this relationship. This linear regression model uses rates as the dependent variable while the
Poisson model uses counts. I divide the coefficients observed in the linear model by the average
assault rates then multiply by 100 to estimate a percentage change.
where Yct is the rate of assault against women for county c in year t; opioiddeathtctis the rate of
opioid overdose death for residents of county c in year t; provratectis the rate of physicians for
residents of county c in year t; povratect is the percentage of people below the poverty line in
county c in year t; unemplratectis the unemployment rate for county c in year t; ϴc are county
fixed effects; πtare year fixed effects; and 𝜀 is the error term for county c in year t. I use the
cluster command to delineate the counties as groups in the data. By using clusters in this way, I
account for repeated county observations over time. These similarities are accounted for in the
CHAPTER IV: RESULTS
This chapter examines the results of the Poisson and linear regression analysis of the
relationship between assault against women and opioid overdose death. The main findings of this
research are that the relationship between assault against women and opioid overdose death is
statistically significant and positive in non-rural counties and statistically significant and slightly
negative in rural counties.
Using county-level fixed effects, I examined within-county variation in the relationship
between assault against women and opioid overdose death. County fixed effects allow me to
measure county-specific unobservables that do not change over time, while year fixed effects
allow me to estimate common time shocks across the state as a whole. Limitations arise when
variables do not change much within counties or over time. By focusing on within county
variation, we shift our focus from how this relationship differs between counties, relying on
changes in counties over time.
Overall Results
I will now present estimates of the overall co-occurrence of opioid overdose death and
assault against women based on this research design. I begin in Column 5 of Table 2,with
estimates from the Poisson model, controlling for county fixed effects and year fixed effects as
well as for poverty, unemployment, and physician availability.
The analysis for all counties estimates a minimally positive relationship—for every
one-unit increase of opioid overdose death. This relationship is not statistically significant for the
overall analysis, with a p-value of 0.817. I utilized an alternative linear regression model, also
controlling for year and county fixed effects. The overall relationship was negative and not
The relationship between X and Y was only statistically significant when separated by
rural and non-rural counties, suggesting that counties face different circumstances depending on
their level of rurality.
Rural/Non-Rural Results
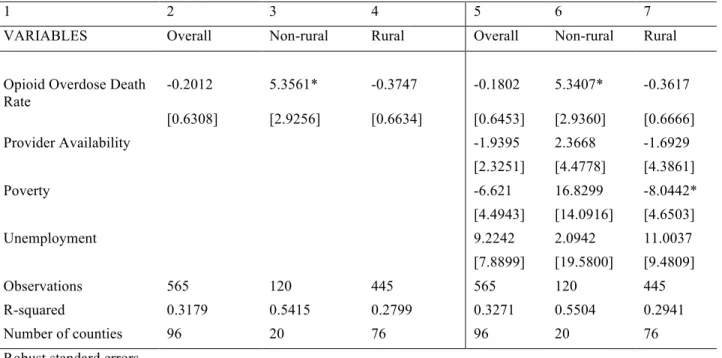
I performed separate analyses for rural and non-rural counties. In non-rural counties, the
relationship was positive and statistically significant for the Poisson analysis of counts of assault
against women. The positive coefficient suggests that for every one-unit increase of opioid
overdose death, there was a 0.0254 increase in the natural log of the count of assault against
women. This relationship was statistically significant below the level of 0.05, with a p-value of
0.017 (See Column 6 of Table 2). I calculated a percentage increase of 2.57 percent.
Using a linear regression, I observed that for every one-unit increase in the rate of opioid
overdose death per 100,000 people, there was a 5.34 unit increase in the rate of assault against
women. Dividing this coefficient by the mean assault rate, I calculated a 0.017 percentage
increase. I found the non-rural relationship to be statistically significant below the level of 0.1
(See Column 6 of Table 3).
In rural counties for the Poisson analysis, this relationship was negative with a coefficient
of -0.0062 when controlling for county-level fixed effects and year fixed effects. This coefficient
suggests that for every one-unit increase of opioid overdose death rate against women, there was
a 0.0062 decrease in the natural log of the count of assault against women. This value translates
to a -0.62 percentage decrease, with a p-value of 0.028. This relationship was statistically
significant, with a p-value below the level of 0.05 (See Column 7 of Table 2).Using a linear
model with fixed effects, the relationship in rural counties was also negative, with a coefficient
Controlling For Other Variables
Controlling for poverty, unemployment, and shortages of health providers had a minimal
effect on the relationship between assault against women and opioid overdose death.
When I controlled for these variables using the Poisson model, the overall relationship became
slightly more positive but remained statistically insignificant. There was little change in the
coefficients for the rural and non-rural analyses and no change in statistical significance was
observed (See Table 2).
In the regression model with fixed effects, controlling for provider availability, poverty,
and unemployment in the linear regression with fixed effects resulted in no change in the
statistical significance of relationship between violence against women and opioid use for
overall, rural, and non-rural analyses—overall and rural relationship remained insignificant, and
non-rural remained significant to the level of 0.1. In addition, there was little change in the
coefficients. Controlling for these factors made the coefficients slightly less negative for the
overall and rural analyses (See Table 3).
Poverty was statistically significant for the rural areas using the linear regression model.
The coefficient was -8.0442 and was significant below the level of 0.1. Poverty was not
significant for the Poisson model.
Limitations
In developing a proxy for violence against women, I chose to not restrict my analysis to
counts of assault against women above the age of 18. Opioid use disorders are increasingly
common among people below the age of 18. As such, this relationship is important to observe for
people below this age range. It should be noted that some of the counts of assault might be
violence.
There are fewer observations available for rural counties since there are only 20
non-rural counties compared to 80 non-rural counties in North Carolina.
Emergency departments use E-codes to designate emergency department visits as assault.
As demonstrated by Table 4, there are huge fluctuations in the percentage of emergency
department visits coded by counties using E-codes, which could create measurement error. The
counties that are highlighted in yellow in Table 4 have a mean E-code reporting rate less than 75
percent for the study period.
This issue is particularly dramatic for the counts of assault in the year 2015, due to a
switch from ICD-9-CM to ICD-10-CM—only nine months of data are reported. As can be seen
from Figure 2, there is a dramatic drop in the number of reported assaults in this year. Year fixed
effects control for some of this in 2015.
The statistical significance of the results of this analysis poses opportunities for thinking
about how relationships observed at smaller scales may be observed differently at the macro
level. In addition, this analysis suggests that opioid overdose death and assault against women
for the years 2010-2015 may not be effective proxies in examining this relationship.
Addressing Limitations
To account for gaps in my data, I reconsidered the models denoted by equations 1 and 2.
I first ran both the Poisson and linear models excluding the year 2015, in which only nine months
of data were reported. The results were qualitatively similar for the Poisson analysis. For the
linear analysis, the overall relationship between opioid death and assault against women became
p-value of 0.964. The coefficient in non-rural areas was 0.19 with a p-p-value of 0.93, and the
coefficient in rural areas was 0.11, with a p-value of 0.879.
Next, I excluded the 12 counties for which the mean rate of E-code reporting between
year X and year Y was less than 75%. The results were not qualitatively different for Poisson
analysis. For the linear regression, I observed slight changes in the coefficients—the overall
relationship remained negative but insignificant, with a coefficient of -0.33 and a p-value of
0.602. In non-rural areas, the coefficient was 2.99 with a p-value of 0.237. In rural counties, this
CHAPTER V: CONCLUSIONS Summary of Findings
The findings of this analysis are not consistent with my original hypothesis. Based off of
the literature on the correlation between substance use disorders and interpersonal violence, I
expected there to be a positive relationship between violence against women and opioid use in
rural areas. I hypothesized that this relationship would be less strong or nonexistent in non-rural
areas. To the contrary, I found a negative relationship between assault against women and opioid
overdose death in rural counties, and a positive relationship in non-rural counties in North
Carolina.
Multiple factors may explain this discrepancy between my findings and the literature—
this analysis used macro-level data as well as proxies for intimate partner violence and opioid
use. The measures I chose—opioid overdose death and assault against women between the years
of 2010 and 2015—may not be effective proxies for observing a co-occurrence of opioid use and
violence against women. Despite the fact that this relationship was not observed as expected
based off of the literature, this analysis may have policy implications and its limitations are
important to consider to inform future research. In this chapter, I will make conclusions based on
the results of this analysis and suggest next steps for further research and policies based off of
these findings.
Findings in rural areas
In rural counties in North Carolina, effectively no relationship was observed between
opioid use and violence against women using the linear regression model. Using the Poisson
analysis, this relationship was slightly negative (See Tables 2 and 3). Given the literature
interpersonal violence, this relationship should still be monitored closely in rural counties.
Multiple factors may explain why a positive relationship between intimate partner
violence and opioid use was not observed. Certain protective factors may exist in rural counties
that do not exist in urban counties. For example, interconnected kinship networks in rural parts
of North Carolina may prevent this relationship from occurring. In addition, higher levels of
stigma in rural areas about opioid use and intimate partner violence may prevent people from
reporting events of this nature to emergency departments.
It is also possible that lower levels of E-code reporting for both assaults against women
and opioid overdose death occurs in rural areas compared to non-rural counties in North
Carolina, thereby falsely suggesting a negative relationship. The impact of low levels of E-code
reporting will be discussed further in the limitations section.
Findings in non-rural areas
In non-rural counties in North Carolina, a positive relationship was observed between
violence against women and opioid use using the proxies of assault against women and opioid
overdose death. As explained by the literature, a positive relationship between violence and
substance use may be explained by the role that trauma and mental health play on women’s
likelihood to use substances and experience interpersonal violence. This leads to a harmful
cycle—these experiences, in turn, put women at a higher risk of experiencing psychological
trauma and thus more of these adverse experiences. Since opioid use and intimate partner
violence are more consistently reported in non-rural areas—of the 12 counties with below 75%
E-code reporting, all but two are designated rural—the relationship may be more robust in these
counties (See Table 4).
The fact that no relationship was found in controlling for poverty, unemployment, and
rates of providers suggests that the data may have been incomplete. This analysis used the
percentage of people below the poverty line, the percent unemployment, and the ratio of
physicians to the population as proxies for poverty, economic hardship, and lack of access to
healthcare that characterize rural areas. Proximity to physicians may too broad of a specification
to have a real impact on the association of violence and opioid use. Further specifying the type of
physician may have resulted in statistically significant findings. For example, the proximity to
physicians who are certified to provide medication-assisted treatment, or the proximity to
domestic violence shelters may be more closely linked to the relationship in question.
Limitations
Multiple biases may exist in the measurement of key variables. In particular,
underreporting of assaults and opioid overdose death must be considered. As previously
discussed, the low levels of E-code reporting as well as underreporting of opioid overdose death
and assault against women likely had a significant effect on my ability of measure the
relationship between intimate partner violence and opioid use. The 2015 switch from ICD-9-CM
to ICD-10-CM codes led to a decrease in the number of assaults that were coded in that year—
this year contains only nine months of data due to the switch in this coding system. While year
fixed effects aim to control for such shocks, this may have led to biased results. It is also
important to remember that many counties have contributed different levels of E-code reporting
over the course of this five-year period. As such, it is possible that apparent increases or
decreases in assaults may have been the result of changes in E-code reporting rather than a true
trend (See Table 4).
the more widespread availability of opioid death data. This limits the amount of within-county
variation that I am able to observe. By 2010, the opioid epidemic was already well underway.
My attempts to address these limitations through running the Poisson and linear models
excluding the year 2015 and counties with rates of e-code reporting less than 75% were not
fruitful for the Poisson analysis. For the linear regression analysis, I found that the coefficients
became positive when I excluded the year 2015, despite the fact that all statistical significance
was lost. When excluding counties with reporting levels below 75%, there were no changes in
the directionality of the relationships. However, the slight changes in the values of the
coefficients suggests that low levels of reporting may have an effect on the strength of the
relationship observed.
Future Research
Future research on the relationship between IPV and opioid use should focus on
developing effective proxies for estimating the key variables of interest. If relying on emergency
department data, more years of data should be gathered for opioid-related emergency department
visits and assaults against women. By extending this analysis to include assault data before the
year 2010—before the dramatic rise of opioid use in North Carolina—researchers will gain a
better understanding of this relationship over time.
In addition, data with higher percentages of E-code reporting would allow for more
confidence in this analysis. If possible, researchers should query the system to be able to
measure emergency department visits below the number ten. Currently, this data is not available
due to privacy concerns.
The fact that the relationship between these variables in the overall analysis was
significant results suggests that counties in North Carolina may face different circumstances
based on their rurality. Future research should take into account the possibility of sub state-level
differences and more data should be gathered about county-level statistics.
More analysis is needed at the macro level—there are different factors at play compared
to what the existing literature finds at the individual-level analysis. Given that policies are made
at a state level, in order to implement widespread policy changes aimed at combatting these
issues, research on the relationship between opioids and intimate partner violence is important.
In the process of collecting this data, county-level differences should be taken into account.
Future research may also include studying approaches to best train medical providers and
organizations aiming to combat intimate partner violence to help women who are experiencing
both intimate partner violence and opioid use disorders. Lastly, future research could explore
ways to encourage women to report interpersonal violence and assault.
Policy implications
This analysis found there to be a positive relationship between assault against women and
opioid overdose death in non-rural counties in North Carolina. If this relationship is accurate,
multiple policy changes are implicated.
The relationship between violence against women and opioid use has been shown by the
literature to be bi-directional. In other words, opioid use can put women at risk for experiencing
victimization; additionally, women who experience interpersonal violence are more likely to
experience substance use disorders including opioid use (Smith et al., 2012). As such, policy
interventions should address both sides of this relationship to improve the overall health and
safety of women in the context of the opioid epidemic.
non-rural counties where this may especially be the case. In addition, given the bi-directionality of
this relationship, services that aim to address opioid combat violence against women should be
aware that their clients or patients may be at a high risk for both. This co-occurrence may lead to
other issues that negatively impact their emotional health, leading to increased substance misuse
and victimization.
Given the high risks facing rural areas, this relationship should still be monitored in these
counties, despite the fact that no positive relationship was observed in this analysis.
Policy changes should reflect county-level circumstances. While state policies should aim
to increase the availability of funding for counties to combat the opioid epidemic, there should be
ample amount of room for the county-level officials to implement these policies as best fits their
community.
Most broadly, there should be an increase in funding to specifically address women’s
issues in the opioid epidemic. Policymakers should focus on increasing funding for domestic
violence shelters as well as treatment centers that focus on the unique needs of women with
opioid use disorders. Women are increasingly at risk for addiction and overdose and are less
likely to seek treatment. According to a survey by the National Survey on Drug Use and Health,
men were significantly more likely to utilize treatment compared to women (Back 2010). There
is a need for gender-specific treatment services (Greenfield et al., 2010). Funding for treatment
options for women could come in the form of state or federal grants to existing treatment centers
and health systems. Treatment centers for women should focus on encouraging more women to
receive care by having residential options for women with children while addressing the
psychological needs and trauma history that this population is likely to have.
to Medicaid and insurance reimbursement for medication-assisted treatment as well as holistic
pain management techniques.
Summary
Literature shows that intimate partner violence and opioid use disorders are linked, with
people living in rural areas particularly at risk for this relationship. Using proxies for violence
against women and opioid use derived from emergency department data, this study found a
potential link between these factors in non-rural counties but not in rural counties. This study
attempts to expand the research literature by examining this relationship at the macro level and to
REFERENCES
Ailes, E. C., Dawson, A. L., Lind, J. N., Gilboa, S. M., Frey, M. T., Broussard, C. S., & Honein,
M. A. (2015). Opioid prescription claims among women of reproductive age--United
States, 2008-2012. MMWR. Morbidity and mortality weekly report, 64(2), 37-41. Back, S. E., Lawson, K. M., Singleton, L. M., & Brady, K. T. (2011). Characteristics and
correlates of men and women with prescription opioid dependence. Addictive Behaviors,
36(8), 829-834.
Back, S. E., Payne, R. L., Simpson, A. N., & Brady, K. T. (2010). Gender and prescription
opioids: Findings from the National Survey on Drug Use and Health. Addictive behaviors, 35(11), 1001-1007.
Black, M. C., Basile, K. C., Breiding, M. J., Smith, S. G., Walters, M. L., Merrick, M. T., &
Stevens, M. R. (2011). The national intimate partner and sexual violence survey: 2010
summary report. Atlanta, GA: National Center for Injury Prevention and Control, Centers
for Disease Control and Prevention, 19, 39-40.
Bureau of Labor Statistics. 2018. Local Area Unemployment Statistics.
https://www.bls.gov/lau/laufaq.htm.
CDC. (2015a). Today’s Heroin Epidemic Infographics.
https://www.cdc.gov/vitalsigns/heroin/infographic.html.
CDC. (2015b). Poisoning.
https://www.cdc.gov/HomeandRecreationalSafety/Poisoning/index.html
CDC. (2017a). Drug Overdose Deaths in the United States Continue to Increase in 2015.
CDC. (2017b). Prescription Painkillers Overdoses: A Growing Epidemic, Especially Among
Women. https://www.cdc.gov/vitalsigns/prescriptionpainkilleroverdoses/index.html.
Cole, J., & Logan, T. K. (2010). Nonmedical use of sedative-hypnotics and opiates among rural
and urban women with protective orders. Journal of addictive diseases, 29(3), 395-409. Covington, S. S. (2008). Women and addiction: A trauma-informed approach. Journal of
psychoactive drugs, 40(sup5), 377-385.
Cunningham, S., Lindo, J. M., Myers, C., & Schlosser, A. (2017). How far is too far? New
evidence on abortion clinic closures, access, and abortions (No. w23366). National
Bureau of Economic Research.
Gracia, E. (2004). Unreported cases of domestic violence against women: towards an
epidemiology of social silence, tolerance, and inhibition.
Greenfield, S. F., Back, S. E., Lawson, K., & Brady, K. T. (2010). Substance abuse in women.
Psychiatric Clinics, 33(2), 339-355.
Harmon KJ, Waller AE, Harduar Morano L, Ising A. (2017). A Report on Violent Injuries Treated in Emergency Departments: 2012-2015. Chapel Hill: NC. Carolina Center for Health Informatics, Department of Emergency Medicine, University of North Carolina at
Chapel Hill. Available at: http://ncdetect.org/reports/.
Havens, J. R., Young, A. M., & Havens, C. E. (2011). Nonmedical prescription drug use in a
nationally representative sample of adolescents: Evidence of greater use among rural
adolescents. Archives of Pediatrics & Adolescent Medicine, 165(3), 250-255.
Hernandez-Avila, C. A., Rounsaville, B. J., & Kranzler, H. R. (2004). Opioid-, cannabis-and
alcohol-dependent women show more rapid progression to substance abuse treatment.
Keyes, K. M., Cerdá, M., Brady, J. E., Havens, J. R., & Galea, S. (2014). Understanding the
rural–urban differences in nonmedical prescription opioid use and abuse in the United
States. American journal of public health, 104(2), e52-e59.
Lenardson, M. H. S., Jennifer, D., Gale, M. S., John, A., & Ziller PhD, E. (2016). Rural opioid
abuse: Prevalence and user characteristics.
Mack KA, Jones CM, Ballesteros MF. Illicit Drug Use, Illicit Drug Use Disorders, and Drug
Overdose Deaths in Metropolitan and Nonmetropolitan Areas — United States. MMWR
Surveill Summ 2017;66(No. SS-19):1–12.
DOI: http://dx.doi.org/10.15585/mmwr.ss6619a1.
McHugh, R. K., DeVito, E. E., Dodd, D., Carroll, K. M., Potter, J. S., Greenfield, S. F., ... &
Weiss, R. D. (2013). Gender differences in a clinical trial for prescription opioid
dependence. Journal of substance abuse treatment, 45(1), 38-43.
Najavits, L. M., Weiss, R. D., & Shaw, S. R. (1997). The link between substance abuse and
posttraumatic stress disorder in women. The American journal on addictions, 6(4), 273-283.
National Institute on Drug Abuse. (2017, April 6). Substance Use in Women. Retrieved from
https://www.drugabuse.gov/publications/drugfacts/substance-use-in-women on 2018,
January 21.
NIDA. (2016). Substance Use in Women. Retrieved from
https://www.drugabuse.gov/publications/research-reports/substance-use-in-women on
North Carolina Department of Health and Human Services (NC DHHS). (2017). Opioid-Related Overdoses.
https://files.nc.gov/ncdhhs/Opioid_Overdose_Factsheet_FINAL_06_27_17.pdf.
North Carolina Health Professions Data System, Program on Health Workforce Research and
Policy, Cecil G. Sheps Center for Health Services Research, University of North Carolina
at Chapel Hill. Created February 25, 2018 at https://nchealthworkforce.sirs.unc.edu/.
Office on Women’s Health . 2017. Final Report: Opioid Use, Misuse, and Overdose in Women. https://www.womenshealth.gov/files/documents/final-report-opioid-508.pdf.
Paulozzi, L. J., Mack, K. A., & Hockenberry, J. M. (2014). Variation among states in prescribing
of opioid pain relievers and benzodiazepines—United States, 2012. Journal of safety research, 51, 125-129.
Prescription Drug Abuse Advisory Committee (PDAAC). (2017). North Carolina Opioid Action Plan (2017-2021).
https://files.nc.gov/ncdhhs/Opioid%20Plan%20Fact%20Sheet_FINAL_6_27_17B.pdf.
Rudd, R. A. (2016). Increases in drug and opioid-involved overdose deaths—United States,
2010–2015. MMWR. Morbidity and mortality weekly report, 65.
Santana, M. C., Raj, A., Decker, M. R., La Marche, A., & Silverman, J. G. (2006). Masculine
gender roles associated with increased sexual risk and intimate partner violence
perpetration among young adult men. Journal of urban health, 83(4), 575-585.
Smith, P. H., Homish, G. G., Leonard, K. E., & Cornelius, J. R. (2012). Intimate partner violence
and specific substance use disorders: Findings from the National Epidemiologic Survey on
APPENDIX Figure 1. Opioid Overdose Death Rates, 1999-2016
Figure 3. Poverty rates
Table 1. Summary Statistics
1. Analytic sample includes years 2010-2015.
2. Opioid death rate: overall sample includes years 1999 to 2016; Source: The Injury and Epidemiology Surveillance Unit of the North Carolina Department of Health and Human Services (DHHS); Definition: Any mention (cod1-cod21) of T40.0 (opium), T40.1 (Heroin), T40.2 (Other Opioids), T40.3 (Methadone) and/or T40.4 (Other synthetic opioid) and unintentional intent (X40-X44).
3. Assault Rate: overall sample includes years 2010-2015; Source: NC DETECT; Definition: Any mention of cutting/piercing, drowning/submersion, falling, fire/burn, firearm, motor vehicle traffic, poisoning, struck by, suffocation, as well as other classifications for women of all ages.
4. Poverty Rate: overall sample includes years 2010-2015; source: American Community Survey (ACS) by the U.S. Census Bureau; Definition: percentage of the county population whose income in the past 12 months is below the poverty level.
5. Unemployment: overall sample includes years 1999-2016; Source: the Local Area Unemployment Statistics (LAUS) program in the Bureau of Labor Statistics (BLS). See definition on page 18.
6. Provider Rate: overall sample includes years 2000-2016; Source: Physician data are derived from the North Carolina Board of Medicine. County estimates are based on primary practice location. Population census data and estimates are downloaded from the North Carolina Office of State Budget and Management via NC LINC and are based on US Census data.
Source: North Carolina Health Professions Data System, Program on Health Workforce Research and Policy, Cecil G. Sheps Center for Health Services Research, University of North Carolina at Chapel Hill. Created March 28, 2018 at https://nchealthworkforce.sirs.unc.edu/.
Table 2. Poisson analysis: Assault against women and opioid overdose deaths rate
1 2 3 4 5 6 7
VARIABLES Overall Non-rural Rural Overall Non-rural Rural
Opioid Overdose Death Rate
0.0003 0.0241** -0.0061* 0.0007 0.0254** -0.0062**
[0.0033] [0.0106] [0.0031] [0.0032] [0.0107] [0.0028]
Provider Availability -0.0126 -0.0149 -0.0076
[0.0153] [0.0261] [0.0155]
Poverty -0.0061 0.0507 -0.0239
[0.0198] [0.0426] [0.0190]
Unemployment -0.013 -0.0177 0.0084
-0.0126 -0.0149 -0.0076
Observations 564 120 444 564 120 444
Number of counties 95 20 75 95 20 75
Table 3. Linear regression analysis: Assault against women and opioid overdose deaths rate
1 2 3 4 5 6 7
VARIABLES Overall Non-rural Rural Overall Non-rural Rural
Opioid Overdose Death Rate
-0.2012 5.3561* -0.3747 -0.1802 5.3407* -0.3617
[0.6308] [2.9256] [0.6634] [0.6453] [2.9360] [0.6666]
Provider Availability -1.9395 2.3668 -1.6929
[2.3251] [4.4778] [4.3861]
Poverty -6.621 16.8299 -8.0442*
[4.4943] [14.0916] [4.6503]
Unemployment 9.2242 2.0942 11.0037
[7.8899] [19.5800] [9.4809]
Observations 565 120 445 565 120 445
R-squared 0.3179 0.5415 0.2799 0.3271 0.5504 0.2941
Number of counties 96 20 76 96 20 76
Robust standard errors in brackets
*** p<0.01, ** p<0.05, * p<0.10
Table 4. Percentage E-code Reporting by County by Year
County 2010 2011 2012 2013 2014 2015
Rutherford 0.958455178 0.979421751 0.969003338 0.942567191 0.93370039 0.662342982 Sampson 0.92503518 0.936268975 0.8619491 0.885092801 0.848312611 0.663618044 Scotland 0.924829157 0.950200244 0.944178901 0.943181818 0.958242495 0.88609215 Stanly 0.186346641 0.191802291 0.248253493 0.874373616 0.982533316 0.743151227 Stokes 0.972493345 0.95732671 0.903950793 0.837995538 0.859306982 0.784987565 Surry 0.951340206 0.952270327 0.937146585 0.900944457 0.897421832 0.81061337 Swain 0.952929875 0.949878345 0.934547031 0.957702582 0.958655157 0.929262394 Transylvania 0.975119377 0.964373464 0.962830593 0.924895158 0.83436853 0.848113208 Tyrrell 0.947521866 0.949554896 0.957104558 0.923076923 0.914675768 0.964980545 Union 0.952749695 0.949084034 0.941276931 0.655441679 0.944901105 0.244252405 Vance 0.924483307 0.928228747 0.930495464 0.906067678 0.892648416 0.776798524 Wake 0.779342534 0.638695861 0.89889383 0.913570877 0.827463345 0.364102014 Warren 0.899548533 0.911285062 0.910490857 0.913693346 0.886635465 0.759570181 Washington 0.926153846 0.937030075 0.97649919 0.932741117 0.866151866 0.785123967 Watauga 0.950081566 0.97621313 0.981399748 0.972184987 0.970174263 0.903293919 Wayne 0.969943273 0.953325468 0.981809103 0.978620983 0.969499855 0.810386699 Wilkes 0.221948691 0.288659794 0.147058824 0.160495716 0.143190095 0.218830018 Wilson 0.946456693 0.947178376 0.955015286 0.950151712 0.925909689 0.903021978 Yadkin 0.943990665 0.953162393 0.898909091 0.775135586 0.775030902 0.673005811 Yancey 0.885993485 0.88030303 0.867362146 0.822368421 0.843181818 0.792372881 Total 0.880110383 0.865876623 0.884524365 0.810461238 0.84699858 0.654304412
Counties with <75% reporting of E-codes for the study period are marked in yellow.