Advanced Practice Pharmacists: cost of medications prescribed by ClinicaL Pharmacist
PractitionErs compared to Primary Care Providers in North Carolina (APPLE-‐NC)
By
Adam Bernstein
PharmD Candidate, Class of 2016
Honors Thesis
UNC Eshelman School of Pharmacy
University of North Carolina at Chapel Hill
February 11, 2016
Approved:
Timothy J. Ives, Pharm.D., M.P.H.
Thesis Advisor
Abstract
Introduction: There is a need to discover new methods of cost-‐effective care as the healthcare system transitions to a model emphasizing quality outcomes. Medication prices continue to rise and must be considered when evaluating the cost of new approaches to treatment. Increased utilization of advanced practice pharmacists represents one solution to appropriate medication use in chronic disease state management. However, the effect on the cost of prescribed pharmacotherapy is unknown.
Objective: To determine the cost of medications prescribed to patients receiving care from both Clinical Pharmacist Practitioners (CPPs) and Primary Care Providers (PCP: physician, family nurse practitioner, and physician assistant) compared to those just receiving care from PCPs.
Methods: This was a retrospective matched cohort analysis. Each cohort was matched by gender, age, and disease states of interest. There were 130 patients total, 65 in each cohort, seen at the University of North Carolina outpatient clinics between November 2008 and November 2011. The primary endpoint was average medication cost per day per patient determined by the average wholesale price (AWP) of prescribed
medications. The secondary endpoint was average number of therapy changes per year per patient.
Results: There was no statistical difference in the average medication cost per day per patient in the CPP cohort versus PCP cohort ($38.52 vs. $38.23, respectively; p = 0.97). Patients managed by CPPs experienced a higher average number of therapy changes per year compared to patients only managed by PCPs
(21.1 vs. 15.5, respectively; p = 0.032).
Conclusions: CPPs utilized within the healthcare team did not result in an increased medication cost despite being correlated with more therapy changes.
Introduction
The introduction of the Affordable Care Act (ACA) in 2010 catalyzed a reform within healthcare. Once founded on fee for service, healthcare is progressing to a model that incentivizes efficient and high-‐quality care. Hospitals not meeting performance standards, such as target readmission rates, will be subject to financial penalties with respect to Medicare reimbursements.1 Similarly, incentives were created to reduce hospital-‐acquired conditions and those within the lowest quartile can also lose 1% of Medicare
reimbursements.1 Changes to the medical landscape, such as Accountable Care Organizations (ACO), bundled payments for care improvement, and the patient centered medical home are a few strategies already utilized to increase coordination of care, achieve these standards, and reduce spending.1,2
Despite these efforts, total spending on healthcare continues to rise. In 2013, healthcare costs were $2.9 trillion with retail prescription drugs contributing $271.1 billion nationally.3 Medication spending increased by 12.6% in 2014, and the Centers for Medicare and Medicaid Services (CMS) expect a growth of 6.3% annually from 2015-‐2024 partly due to the increase in newly insured patients under the ACA.3,4 Pharmacists are medication experts and expanding their clinical services can reduce overall healthcare spending. The Asheville Project found consultations with community-‐based pharmacists reduced the average amount paid per patient year from the insurer’s perspective for both cardiovascular and diabetes related medical costs. 5,6 However, medication expenditures increased in both studies by as much as 290%.
Collaborative drug therapy management (CDTM), defined as a collaborative practice agreement between a physician and pharmacist that allows pharmacists to initiate, monitor, and adjust drug regimens, is permitted to varying degrees in 48 states.7 However, four states, which include California, Montana, New Mexico, and North Carolina, enable expanded scopes of practice and prescribing authority.8,9 North Carolina passed the Clinical Pharmacist Practitioner Act on July 1, 2000 enabling pharmacists meeting specific post-‐ graduate training to provide drug therapy management under a protocol of a supervising physician.10,11 Drug therapy management includes initiating or modifying drug therapies, which may include controlled
Methods
Design and participants
This was a 36-‐month retrospective matched cohort study. The study population consisted of every Medicare beneficiary seen by a PCP or CPP at the University of North Carolina at Chapel Hill Healthcare System (UNC) for chronic disease management. The outpatient clinics included: Internal Medicine, Endocrine, Family Medicine, Outpatient Oncology, Solid Organ Transplant, Geriatrics, and Anesthesia Spine Center. The North Carolina Translational and Clinical Sciences Institute collected claims data on every patient seen by either a CPP as a referral from the patient’s PCP or managed by a PCP alone at the clinics. All eligible patients were separated into either a CPP or PCP cohort and matched by age, gender, and ICD-‐9 codes for chronic disease states of interest using SAS software, version 9.2 (SAS Institute, Inc., Cary, NC (2008)) and randomly selected for inclusion using Microsoft Excel®.
Inclusion and Exclusion Criteria
Medicare patients were included if they were seen between 11/01/08 through 11/01/11. All patients required an ICD-‐9 code for one of the following chronic disease states of interest: hypertension, type 2 diabetes mellitus, or peripheral neuropathy. These disease states were selected because of their prevalence and associated complexity of pharmacotherapy management. Patients in the CPP cohort were included in the analysis if they had at least two CPP visits in addition to two PCP visits during the study period. This
requirement was to demonstrate continuity of care between the CPP and PCP. Patients in the PCP cohort were included if they were seen at least twice by a PCP during the study period and were not managed by a CPP. Dual eligible Medicare and Medicaid patients were excluded.
Outcomes
The primary endpoint was the difference in average medication cost per day per patient. The secondary endpoint was average number of therapy changes per year per patient defined as a dose increase or decrease, or drug initiation or discontinuation.
Medication History
Medications were tracked using WebCIS, an electronic medical record (EMR) utilized by UNC during the study period. Only prescription medications were included in the cost analysis. Herbal supplements, vitamins, minerals, and medications only available over-‐the-‐counter were excluded. These products were not always initiated by the practitioner and therefore were not accurately recorded in the EMR.
Cost and Therapy Change Calculation
All medications were priced according to the 2009 AWP listed within the 2010 edition of Redbook.12 The manufacturer with the lowest AWP was used for each medication, excluding repackagers, to maintain consistency. All medications were assumed to be generic unless only brand was available during 2009. Boxed medications, such as topical preparations and inhalers, as well as oral medications prescribed, “as needed” (PRN) were priced as a one-‐month supply unless the prescription directions recorded in the EMR indicated exact quantities. If oral PRN medications did not indicate quantities, they were excluded from pricing and were only evaluated for therapy changes.
Medication cost was calculated by multiplying the number of drug units used during the treatment duration by the AWP. Drug unit was defined as a tablet, milliliter of solution, or box of medication (e.g., inhaler, topical). Treatment duration was defined as time from first to last recorded medical visit. Adherence was assumed to be 100% to maintain consistency between cohorts. Total cost was divided by the number of days seen by a provider to generate cost per day. Total therapy changes was divided by the number of days and multiplied by 365 to standardize by year. Standardizing cost and therapy changes by time allows for direct comparison of patients managed for different durations at UNC.
Statistical analysis
Assuming a medium Cohen’s effect size of 0.5 standard deviations, a sample size of 130 subjects was needed to achieve an 80% power using a two-‐tailed t-‐test and alpha of 0.05. Total cost and therapy changes were analyzed using two-‐tailed matched pairs t-‐tests.
Results
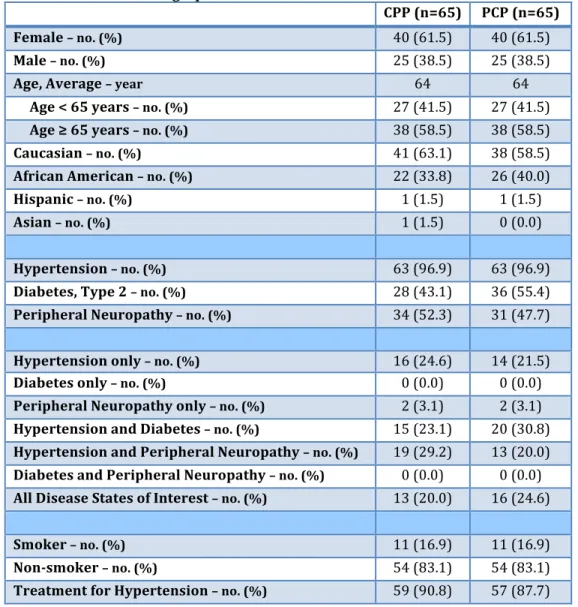
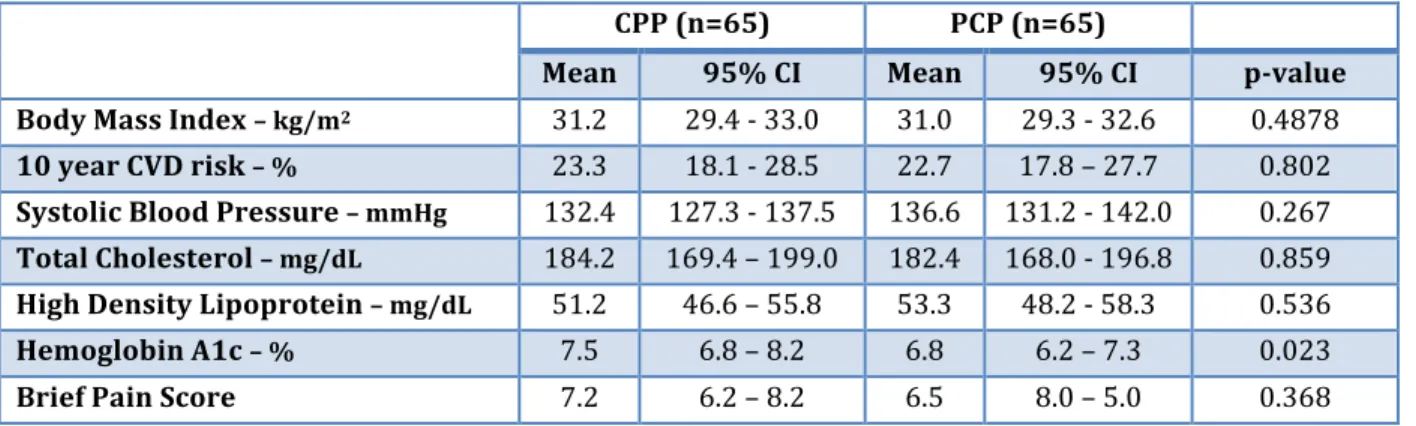
Baseline demographics are listed in Table 1. The average age was 64 years and 61.5% of all patients were female. Baseline clinical variables are shown in Table 2. Mean HbA1c was significantly higher in the CPP cohort compared to the PCP cohort (7.5 vs. 6.8, respectively; p = 0.023).
Table 1. Baseline demographics.
CPP (n=65) PCP (n=65)
Female – no. (%) 40 (61.5) 40 (61.5)
Male – no. (%) 25 (38.5) 25 (38.5)
Age, Average – year 64 64
Age < 65 years – no. (%) 27 (41.5) 27 (41.5)
Age ≥ 65 years – no. (%) 38 (58.5) 38 (58.5)
Caucasian – no. (%) 41 (63.1) 38 (58.5)
African American – no. (%) 22 (33.8) 26 (40.0)
Hispanic – no. (%) 1 (1.5) 1 (1.5)
Asian – no. (%) 1 (1.5) 0 (0.0)
Hypertension – no. (%) 63 (96.9) 63 (96.9)
Diabetes, Type 2 – no. (%) 28 (43.1) 36 (55.4)
Peripheral Neuropathy – no. (%) 34 (52.3) 31 (47.7)
Hypertension only – no. (%) 16 (24.6) 14 (21.5)
Diabetes only – no. (%) 0 (0.0) 0 (0.0)
Peripheral Neuropathy only – no. (%) 2 (3.1) 2 (3.1)
Hypertension and Diabetes – no. (%) 15 (23.1) 20 (30.8)
Hypertension and Peripheral Neuropathy – no. (%) 19 (29.2) 13 (20.0)
Diabetes and Peripheral Neuropathy – no. (%) 0 (0.0) 0 (0.0)
All Disease States of Interest – no. (%) 13 (20.0) 16 (24.6)
Smoker – no. (%) 11 (16.9) 11 (16.9)
Non-‐smoker – no. (%) 54 (83.1) 54 (83.1)
Treatment for Hypertension – no. (%) 59 (90.8) 57 (87.7)
Table 2. Baseline clinical variables.
CPP (n=65) PCP (n=65)
Mean 95% CI Mean 95% CI p-‐value
Body Mass Index – kg/m2 31.2 29.4 -‐ 33.0 31.0 29.3 -‐ 32.6 0.4878
10 year CVD risk – % 23.3 18.1 -‐ 28.5 22.7 17.8 – 27.7 0.802
Systolic Blood Pressure – mmHg 132.4 127.3 -‐ 137.5 136.6 131.2 -‐ 142.0 0.267
Total Cholesterol – mg/dL 184.2 169.4 – 199.0 182.4 168.0 -‐ 196.8 0.859
High Density Lipoprotein – mg/dL 51.2 46.6 – 55.8 53.3 48.2 -‐ 58.3 0.536
Hemoglobin A1c – % 7.5 6.8 – 8.2 6.8 6.2 – 7.3 0.023
Brief Pain Score 7.2 6.2 – 8.2 6.5 8.0 – 5.0 0.368
There was no statistical difference in the primary endpoint of average medication cost per day per patient. The medications prescribed to the CPP cohort cost on average $38.52 per day per patient and $38.23 per day per patient in the PCP cohort (mean difference $0.29; p = 0.97) (Table 3). Patients in the CPP cohort required more average therapy changes per year than patients in the PCP cohort (21.1 vs. 15.1, respectively; p=0.032).
Table 3: Average difference in medication cost per day and therapy changes per year.
CPP PCP Mean Difference P-‐Value
Medication Cost, Average – $/day $38.52 $38.23 $0.29 0.97
Therapy Changes, Average – changes/year 21.1 15.5 5.6 0.032
Discussion
Medication cost is an important factor when assessing overall healthcare efficiency. The medication arm of the APPLE-‐NC study provided an estimate of the total cost of medications prescribed to Medicare patients managed only by PCPs compared to those also managed by CPPs. A matched cohort design was utilized to reduce variability in disease state complexity while still enabling enough eligible patients for inclusion in the analysis. Age, gender, and three disease states of interest were identified for this purpose. Hypertension and type 2 diabetes mellitus were selected because of their known prevalence within the UNC outpatient clinics and ease of monitoring disease state management. In addition to total cost of care, the overall APPLE-‐NC study analyzed efficacy of treatment. Hypertension and diabetes mellitus have target clinical biomarkers (blood pressure and glycosylated hemoglobin, respectively) recommended by national guidelines that allowed for objective comparison between cohorts. Peripheral neuropathy is a subjective measure and therefor not as easily comparable, however, it was selected because of its complexity in pharmacotherapy management and presumed interrelatedness with diabetes mellitus at UNC clinics. After randomization, it was discovered that some patients had disease states of interest that were not linked with the appropriate ICD-‐9 codes. For example, some patients carrying only the ICD-‐9 code for hypertension also had diabetes. Therefore, cohorts were accurately matched on gender and age only. The accurate diagnoses per the EMR are reflected in table 2.
Data collected in this study were included in the overall APPLE-‐NC study, which found patients managed by PCPs in conjunction with CPPs were as likely to reach their disease state goals as patients only managed by PCPs. Additionally, there was no difference in medical charges, defined as the cost of inpatient admissions, emergency department visits, and outpatient visits identified using Medicare claims data.15
Limitations
There are limitations that should be considered when assessing the impact of the medication arm of the APPLE-‐NC study. It has a very small sample size of 130 patients. However, many more patients qualified for inclusion and could be utilized for subsequent research. Although the cohorts were correctly matched by age and gender, there were inconsistencies with the claims data and diagnoses recorded in the EMR. This may partially be due to a limited search method for disease states. Another limitation is the use of AWP for medication prices. Pharmacies and healthcare systems may obtain medications at prices lower than AWP, depending on contractual agreements, and the true cost would be more accurately reflected in Medicare claims data. AWP was also limited to one year. However, this was done to reduce the effect of AWP variability that may not accurately correlate with medication price fluctuations. Additionally, the data set only captured medical visits within the UNC Healthcare system. Medications prescribed at visits to outside hospitals, such as an urgent care facility, would not be included in the total costs. As previously stated, there is an outpatient anticoagulation clinic that CPPs participate in, which could confound the results of total therapy changes. As a retrospective study, there are limitations to extracting information from the EMR. There may be differences in documentation styles between CPPs and PCPs affecting the quality of data utilized to generate medication histories.
Implications
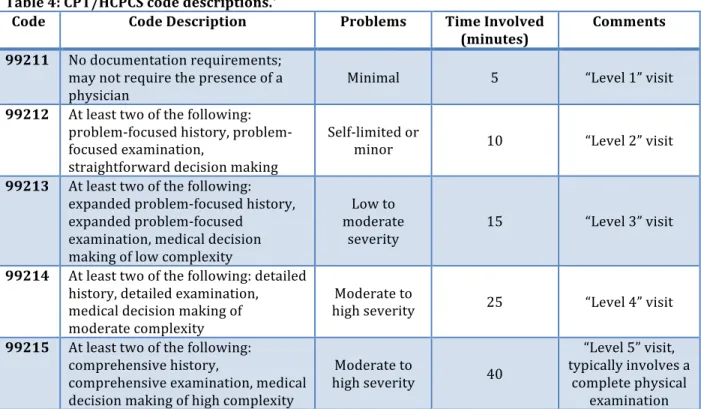
Although CPPs appear to contribute expertise without increasing overall medication spending, there are barriers to implementing similar models ubiquitously. Pharmacists working collaboratively with physicians are not reimbursed directly for their services, and must use an “incident to” billing method.16 CPT codes range from 99211 to 99215, often referred to as levels 1-‐5, with increasing complexity and fees respectively. Many CPPs are required to bill as a Level 1 visit, which is described as requiring five minutes typically to manage minimal problems without the need of a physician (Table 4).17 Scott et al. found CPPs billed on average $51,322 during 1,658 patient encounters per year from 2007-‐2011 in anticoagulation and pharmacotherapy clinics at the Mountain Area Health Education Center Family Health Center. 16 They estimated these charges would increase to an average of $110,854 per year and $164,565 per year if CPPs could bill at levels 3 and 4, respectively. Lack of provider status and ability to bill for services align with the perceived barriers of CPPs. It was the most common challenge to clinical practice noted by 55.2% of active and inactive CPPs responding to a survey conducted in 2011.18 Currently, there is legislation within congress, H.R. 592 and S. 314, that amends title XVIII of the Social Security Act. If passed, pharmacists will receive “80 percent of the lesser of the actual charge or 85 percent of the fee schedule amount provided under section 1848 if such services had been furnished by a physician.”19 Increasing the compensation to match the services pharmacists are already providing will magnify their ability to deliver cost-‐efficient healthcare.
Conclusion
This study demonstrated that the involvement of advanced practice pharmacists in chronic disease state management did not result in a difference in total medication costs despite an increased number of therapy changes. The overall APPLE-‐NC trial can serve as the foundation for other health systems to evaluate the care delivered by pharmacists on a larger scale and advocate for their recognition as providers.
Table 4: CPT/HCPCS code descriptions.*
Code Code Description Problems Time Involved
(minutes)
Comments
99211 No documentation requirements; may not require the presence of a physician
Minimal 5 “Level 1” visit
99212 At least two of the following: problem-‐focused history, problem-‐ focused examination,
straightforward decision making
Self-‐limited or
minor 10 “Level 2” visit
99213 At least two of the following: expanded problem-‐focused history, expanded problem-‐focused
examination, medical decision making of low complexity
Low to moderate
severity 15 “Level 3” visit
99214 At least two of the following: detailed history, detailed examination, medical decision making of moderate complexity
Moderate to
high severity 25 “Level 4” visit
99215 At least two of the following: comprehensive history,
comprehensive examination, medical decision making of high complexity
Moderate to
high severity 40
“Level 5” visit, typically involves a
complete physical examination
*Adapted from references 16 and 17.
Acknowledgement
Statistics were guided and confirmed by the Chris Wiesen, PhD of The Howard W. Odum Institute for Research in Social Science, University of North Carolina at Chapel Hill.
Grant
The project described was supported by the National Center for Advancing Translational Sciences (NCATS), National Institutes of Health, through Grant Award Number UL1TR001111. The content is solely the responsibility of the authors and does not necessarily represent the official views of the NIH.
References:
1. Blumenthal D, Abrams M, and Nuzum R. The Affordable Care Act at 5 Years. The New England Journal of Medicine. 2015;372:2451-‐8.
2. Pines JM, Keyes V, Hasselt, MV, McCall N. Emergency Department and Inpatient hospital Use by Medicare Beneficiaries in Patient-‐Centered Medical Homes. Annals of Emergency Medicine. 2015;65(6):652-‐60.
3. National Health Expenditures 2013 Highlights. Baltimore: Centers for Medicare and Medicaid Services, 2014 https://www.cms.gov/Research-‐Statistics-‐Data-‐and-‐Systems/Statistics-‐Trends-‐and-‐ Reports/NationalHealthExpendData/Downloads/highlights.pdf (Accessed July 15, 2015).
4. National Health Expenditure Projections 2014-‐2024. Baltimore: Centers for Medicare and Medicaid Services, 2014. https://www.cms.gov/Research-‐Statistics-‐Data-‐and-‐Systems/Statistics-‐Trends-‐and-‐ Reports/NationalHealthExpendData/Downloads/proj2014.pdf (Accessed January 28, 2016). 5. Bunting BA, Smith BH, Sutherland SE. The Asheville Project: Clinical and economic outcomes of a
community-‐based long-‐term medication therapy management program for hypertension and dyslipidemia. Journal of the American Pharmacists Association. 2008;48:23-‐31.
6. Cranor CW, Bunting BA, Christensen DB. The Asheville Project: Long-‐Term Clinical and Economic Outcomes of a Community Pharmacy Diabetes Care Program. Journal of the American Pharmacists Association. 2003;43:173-‐84.
7. McBane SE, Dopp AL, Abe A, et al. Collaborative Drug Therapy Management and Comprehensive Medication Management-‐ 2015. Pharmacotherapy. 2015;35(4):e39-‐e50.
8. Murawski M, Villa KR, Dole EJ, et al. Advanced-‐practice pharmacists: practice characteristics and reimbursement of pharmacists certified for collaborative clinical practice in New Mexico and North Carolina. American Journal of Health System Pharmacists. 2011;68(24):2341-‐50.
9. California Senate Committee on Business, Professions, and Economic Development, Pharmacy Practice: Hearing on S.B. 493, April 22, 2013, http://www.leginfo.ca.gov/pub/13-‐
14/bill/sen/sb_0451-‐0500/sb_493_cfa_20130418_144405_sen_comm.html (accessed July 15, 2015) 10. North Carolina Board of Pharmacy. Clinical Pharmacist Practitioners. Available at:
http://www.ncbop.org/pharmacists_cpp.htm. (Accessed July 15, 2015).
11. Clinical Pharmacist Practitioner Application for Approval Form Instructions. North Carolina Board of Pharmacy and North Carolina Medical Board.
http://www.ncbop.org/Forms%20and%20Applications%20-‐%20Pharmacists/CPPapplication.pdf (Accessed July 15, 2015).
12. PDR. RED BOOK: Pharmacy’s Fundamental Reference 2010 Edition. 114th edition. Montvale, NJ. Thomson PDR; 2010.
13. Rothman R, Malone R, Bryant B, et al. Pharmacist-‐Led, Primary Care-‐Based Disease Management Improves Hemoglobin A1C in High-‐Risk Patients with Diabetes. American Journal of Medical Quality. 2003;18(2):51-‐8.
14. Michalets E, Creger J, Shillinglaw WR. Outcomes of expanded use of clinical pharmacist practitioners in addition to team-‐based care in a community health system intensive care unit. American Journal of Health-‐System Pharmacists. 2015;72:47-‐53.
15. Kislan M, Bernstein A, Fearrington LR, Ives TJ. Advanced Practice Pharmacists: clinical efficacy and cost of Clinical Pharmacist Practitioners in the management of ambulatory Medicare patients in North Carolina (APPLE-‐NC) – Manuscript in Preparation
16. Scott MA, Hitch WJ, Wilson CG, et al. Billing for pharmacists’ cognitive services in physicians’ offices: Multiple methods of reimbursement. Journal of the American Pharmacists Association. 2012;52:175-‐ 80.
17. Centers for Medicare and Medicaid Services. CPT/HCPCS Codes included in Range 99211-‐99215. http://www.cms.gov/medicare-‐coverage-‐database/staticpages/cpt-‐hcpcs-‐code-‐
range.aspx?DocType=LCD&DocID=32007&Group=1&RangeStart=99211&RangeEnd=99215 (Accessed July 17, 2015).
18. Hale JC, Murawski MM, Ives TJ. Perceived successes and challenges of clinical pharmacist
practitioners in North Carolina. Journal of the American Pharmacists Association. 2013;53(6):640-‐3. 19. Pharmacy and Medically Underserved Areas Enhancement Act.