#
ABSTRACT
ANDREW J. LAWLER. A Survey and Assessment of Drought Contingency Plans in the
Southeastern United States. (Under the direction of DAVID H. MOREAU)
Water utilities in the southeastern United States were surveyed to identify those utilities that were affected by the drought of 1986 to such an extent that their normal operations were modified and to identify utilities that have drought
contingency plans. Case studies of four of these utilities were
performed to examine the criteria local governments use for
invoking demand and supply management techniques during droughts. Literature was reviewed to determine the available criteria and techniques used in drought management. Several utilities had to modify normal operations without the aid of drought contingency
plans. Utilities often use generic ordinances with little or no technical bases to implement demand and supply management
techniques. Criteria used for decision making include:
ti
TABLE OF CONTENTS
Page
List of Tables... v
List of Figures... vi
I. Introdution ... 1
II. Literature Review ... 6
III. Results of Drought Survey ... 20
IV. Case Studies ... 49
V. Conclusions and Recommendations ... 87
References ... 93 Appendix ... Al
ACKNOWLEDGEMENTS
I would like to thank Dr. David H. Moreau for the
opportunity to work on this project and his guidance in
preparation of this report. I am also grateful to Dr. Donald T.
Lauria and Dr. Richard N. Andrews for their positive criticism
and support during the preparation of this report.
I especially appreciate the help I received in putting together this report from the staff at the Water Resources Research Institute including Eva Tew, Linda Lambert, Frances Yeargan, Daphne Phillips, and Mary Warner Sprinkle.
I also appreciate the moral support I received from Laura
Myers, Jim Garber, Dan Elliott, Kathy Dolce, my family and all my
friends in Chapel Hill.
This investigation was conducted as part of a research
program supported by The Water Resources Research Institute of the University of North Carolina and by the United States
Geological Survey, Grant No. 14-08-0001-G1487.
LIST OF TABLES
Table No. Page
2.1 Risk Levels for Water Use Restrictions 8 2.2 Risk Levels for Given Action Levels 9
3.1 Results of Drought Survey (No. of 22 Afirmative Responses)
3.2 Results of Drought Survey (% of Total) 22
3.3 Results of Drought Survey (% of State) 23
3.4 Results of Drought Survey 23
(Policy Assistance)
3.5 Source of Water Supply 32
4.1 Yield From Lake Michie 60 4.2 Predicted Percent Reduction in Demand 61
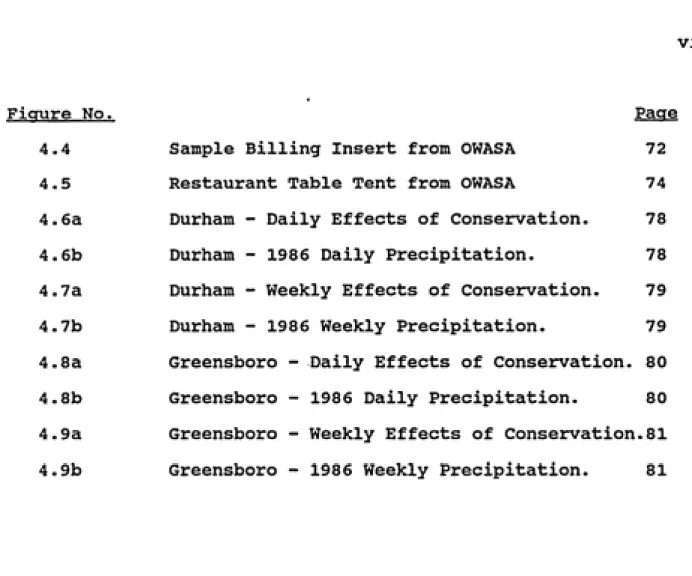
VI
LIST OF FIGURES
Figure No. Page 1.1 Drought Severity in the United States 3
as of August 2,1986.
1.2 Drought Severity Index by Division 3
as of August 2,1986.
2.1 General Structure of Operating 9 Policy by Moreau.
3.1 Streamflows in the Southeast : 21
January - July 1986.
3.2 Water Use Reductions in 1986 24 3.3 Invoked Policy in 1986 25 3.4 Regional Agreements to Supply Water 26 3.5 Drought Ordinances in 1986 27 3.6 Technical Reports for Drought Policy 28 3.7 Cities in North Carolina That 42
Implemented Conservation in 1986.
3.8 Drought Management Areas in South 44
Carolina.
4.1 Target Reserves for Conservation 54 Program in Greensboro.
Vll
INTRODUCTION
Water supply planners have always attempted to supply people
with a pure, reliable source of water. However, "the day of
uncjuestioning construction of maitanoth dams, reservoirs and other
water reclamation projects is over "(An Age of Economics...,1986).
With the problem of droughts, increased demand and contaminated
supplies, the question of will we have enough water for tomorrow
is continually asked. Water utility managers must now manage
their systems as well as possible to prevent severe social,
economic and environmental impacts from occurring due to these
problems.
Drought has been defined in many ways, all of which are
correct to an extent. The impact of drought on municipal water
supply and the criteria used to manage these systems under
drought conditions are the subjects of this paper and lead to
the definition of effective drought proposed by Warwick (1975):
"Effective drought is the shortage of water, due to
meteorological and hydraulic deviations from the
climatological norm, which results in an otherwise
unscheduled modification of water-supply management
practices to compensate for the shortage."
This definition is chosen because individual municipalities that
face the same meteorological drought conditions as other
municipalities often are affected differently due to previous
planning. Therefore municipalities are considered in a drought
if the conditions result in some form of unscheduled motification
2 The drought of 1986 in the southeastern United States was probably the worst in at least 111 years according to the National Weather Service (Aug. 5, 1986). As shown in Figures 1.1 and 1.2 much of the Southeast was in an extreme drought situation as of August 2, 1986 based on the Palmer Drought Severity Index (DSI). Water problems in the South have traditionally involved flooding
rather than drought. However, rapidly increasing populations
coupled with droughts have pushed many water systems beyond their designed capacities. The problem in the South, according to
Greene (1987) in his article questioning whether the crippling drought of 1986 was preventable, is that the South has
traditionally been resistant to water management policies that restrict the usage of water in any way.
The drought of 1986 caught several utilities quite unprepared. The objectives of this paper are to attempt to
determine the extent to which water utilities in the Southeast
were affected by the drought and the extent to which they were prepared to manage demands and supplies during the drought; and to determine the criteria and techniques that utilities use for invoking demand and supply management techniques during droughts. This was done through the use of (1) a literature review; (2) a survey on the impact of the 1986 drought in the southeastern United States, and; (3) case studies of four utilities and their
responses to the drought of 1986.
The first section reviews the literature related to drought management. It includes the criteria used for operating a water supply under drought conditions and risk management techniques
ͣ
used by utilities, and optimization techniques for reservoir operating policies.
The second section shows the results of a survey on the impact of the drought of 1986 in nine southeastern states. The questionnaire was sent to 573 water utilities that serve large to very large systems (>10,000 population). In the United States
systems of this size represent only 4.7% of all water systems yet
they serve over 78% of the population (Grigg, 1986). Also over
80% of U. S. residents live in cities and towns with populations over 10,000 (Grigg, 1986). The survey, therefore, represents a large portion of the population that was impacted by the drought of 1986. The survey included questions on the following:
implementation of conservation; regional water agreements to buy and sell water; operating policies or ordinances; technical basis for these policies; and supply and demand. The objectives of the survey were to identify those utilities that were affected by the drought of 1986 to such an extent that their normal operations were modified; and to identify utilities that had drought
contingency plans in place.
The final section contains case studies of four utilities in
the northern piedmont of North Carolina. These include the City of Durham; Orange Water and Sewer Authority (OWASA); the City of Greensboro; and the City of High Point. These utilities were chosen because of their large size (>50000 population), close proximity, and the various states of their supplies and system users (i.e. residential, university, industry,
The objectives of this part of the study were to determine
the state of their preparedness to handle droughts, the status of
intergovernmental agreements, their decision making criteria, the
characteristics of their information systems, their capacity to
predict the consequences of their decisions, opportunities for
regional cooperation, and their actual performance in 1986. The
results of these cases are presented and conclusions and suggestions are given.
Much of the literature reviewed in this report refers to risk
and risk levels. Risk is a general term used term that is defined
here as the possibility or chance of some shortfall or undesirable
event. The problem is that the magnitude of these shotfalls is
often unclear. A risk level is the level of probabilty at which
one will meet or fail to meet a desired outcome.
Water demand as used here is the reqirement of water in both
quantity and time of need for the purpose of public water supply.
Conservation is any beneficial reduction in water use and is
separate from supply augmentation. These terms often are used
differently by different authors.
Conclusions from the literature, survey and case studies are
given regarding drought management policies, criteria and options
available to water managers. Recommendations for future research
in the field of drought management are made which shou-ld be
LITERATURE REVIEW
The literature related to the criteria used for decision
making under drought conditions is limited. The literature on
techniques for deriving policies is quite large but is limited
in the area of drought management and single purpose water
supplies. Both criteria for drought management and techniques
for deriving policies are reviewed herein.
Criteria for Drought Management Decisions
Drought policy is often left solely to local utilities,
rather than state or federal governments. Wilhite (1986) did a
comparative analysis of drought policies in the US and Australia;
he stated that the US has reacted to drought by crisis management rather than risk management. Current policy in the US does not encourage the adoption of efficient management practicies to ensure against abnormal risk. Risk management should be a
consideration in developing a drought policy at a national level.
Most optimization models are based on minimizing economic
losses subject to some constraints, however, it seems utilities operate to reduce risk of some undesirable event from occurring. Some optimization models have included risk including those by
Simonovic and Marino (1981) and Askew (1974a) as well as others.
Recently several utilities have adopted drought management policies that take into account the risk of not meeting a given
demand, calling for conservation, running out of water or some
other undesirable effect of a water shortage. The City of
A set of risk tables are developed for each month of the year based on the previous month's streamflow and the current water level. Streamflow is used to predict inflow in future months, while water level represents current storage. The tables give the probability of not sustaining a given demand throughout the remainder of the drawdown-refill cycle (April-March). The
benefits of these tables are that they are designed for ease-of-use by the utility director. The utility can choose a risk level
it is willing to face and then decide if they need to impose water use restrictions or supplement supply, in order to reduce their risk of not sustaining current demand. The problem with this approach is that the magnitude of economic and social impacts of not meeting a given yield is not considered.
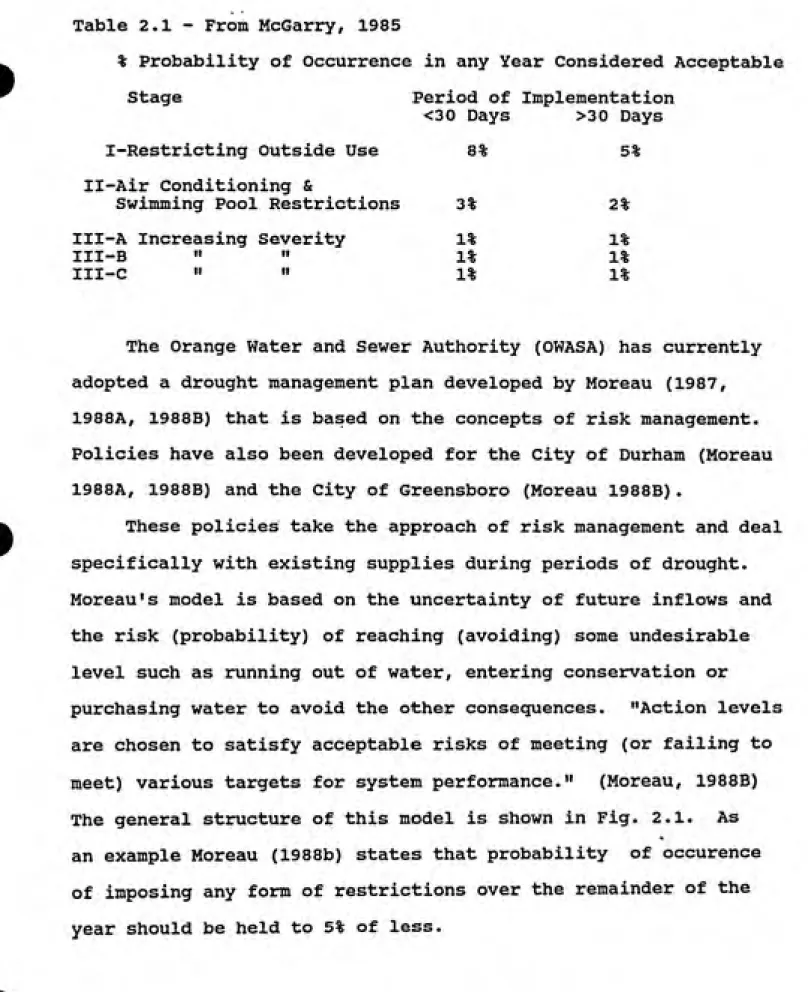
The Washington Metropolitan Area, consisting of over 3 million people, is served by three main water supply agencies. After 20 years, a successful regional water supply plan was developed including a drought contingency plan (McGarry, 1985). A drought management plan with three stages was developed. Table 2.1 shows the percent probability they feel acceptable for
implementing water use restictions of a given duration. For example, 8 years out of 100 they feel it is acceptable to
implement restrictions on outdoor water use for a period of less than 30 days. By choosing these risk levels required storage was reduced by one third for the year 2000. "Political officials are the ones who must defend the chosen risk and take the heat if the public does not like these restrictions when they are imposed"
8
Table 2.1 - From McGarry, 1985
% Probability of Occurrence in any Year Considered Acceptable
Stage Period of Implementation
<30 Days >30 Days
I-Restricting Outside Use 8% 5%
II-Air Conditioning &
Swimming Pool Restrictions 3% 2% III-A Increasing Severity 1% 1%
III-B " " 1% 1%
III-C UN 1% 1%
The Orange Water and Sewer Authority (OWASA) has currently
adopted a drought management plan developed by Moreau (1987,
1988A, 1988B) that is based on the concepts of risk management.
Policies have also been developed for the City of Durham (Moreau
1988A, 1988B) and the City of Greensboro (Moreau 1988B).
These policies take the approach of risk management and deal
specifically with existing supplies during periods of drought.
Moreau's model is based on the uncertainty of future inflows and
the risk (probability) of reaching (avoiding) some undesirable
level such as running out of water, entering conservation or
purchasing water to avoid the other consequences. "Action levels
are chosen to satisfy acceptable risks of meeting (or failing to
meet) various targets for system performance." (Moreau, 1988B)
The general structure of this model is shown in Fig. 2.1. As
an example Moreau (1988b) states that probability of occurence
of imposing any form of restrictions over the remainder of the
Table 2.2 Criteria
Drawdown of active storage to empty
over remainder of drawdown-refill cycle Imposing mandatory conservation for
more than four weeks
Imposing any form of conservation
over the remainder of the year
Probabilitv of Occurrence
.01 or less 05 or less
.05 or less
Full ^
>
SL
i. o
ͣ
I-)
00
Empty
Operate Under Action #0
Operate Under Action #1
Operate Under Action #2
Operate Under Action #M
Time of Year
Figure 3.1-General Structure of Operating Policy
10
One drawback of Moreau's model is that it does not
explicitly consider the economic consequences of decisions. The
judgement about what consumers are willing to pay to avoid the
consequences of a drought at a given risk is left to public
officials.
Positive aspects of this model are that it was developed in
consultation with utility directors. It was developed for
ease-of-use by utility directors and allows some freedom in choosing
desirable levels of risk. Decisions about management of supply
and demand can be made early in the drawdown-refill cycle rather
than waiting until a point where decisions are made too late.
OWASA is presently using this model and has requested to purchase
water as early as July 6, 1988 (Lucas, 1988). This represents a
change from past years when OWASA did not request purchases until
after they implemented conservation measures.
Prior to using Moreau's model, OWASA had a drought
management plan developed by Blum (1977). Blum (1977) selected
lake levels for the months July through December at which
different levels of conservation, purchasing or rationing should
be entered. These levels were based on historical records of what
University Lake levels would have been at 1977 unrestricted
demand. He does not mention if these levels were based on any
specific probability of not meeting demand or running the
reservoir empty over the remainder of the drawdown-refill cycle.
Blum also recommended that water not be purchased until stage 4
(stringent mandatory restrictions) was entered. This is turning
11
drought without the social, economic and political impacts of mandatory conservation.
Several utilities in South Carolina and elsewhere use the Palmer Drought Severity Index (DSI) as a basis for decision making during droughts. The DSI as explained by Denny and Heddinghaus (1987) is an index of meteorological drought and
indicates prolonged abnormal conditions affecting water-sensitive economics. The DSI is a useful index in determining the
availability of supplies, reservoir levels, range conditions, amount of stock water and potential intensity of forest fires. It is useful in determining drought conditions on a regional basis but does not apply specifically to an individual water supply and their demand for water.
Several standard texts in the field of water resources
engineering and planning were reviewed, but few provided any guidance in the area of drought management. Those that provided no guidance include Ameen (1964), Linsley and Franzini (1972), Clark, Viessman and Hammer (1977), and Mather (1984).
One of the few standard references that provides any
guidance as to when conservation should be initiated is found in Fair, Geyer and Okun (1971, p.78). They argue that conservation
must be initiated "...well in advance of anticipated exhaustion
of the supply." Furthermore, they state that the decision to
invoke conservation should be based on the frequency with which
conservation will occur and the storage level at which it will be implemented. They suggest that in practice that level is between
12
that requires a 25% reserve for a drought that occurs once in
2 0 years.
Viessman and Wetty (1985) speak of the reliability of a
water supply. They argue that the risk of not meeting a given
demand should be low for municipal and industrial suppliers and
higher when water is used for irrigation. While they mention
operating rules for reservoirs they do not give any specific
criteria for operating the supply during a drought.
Techni(iues For Deriving Operating Policies
A substantial review of approximately 200 papers and reports
on reseirvoir management and operations models was published by
Yeh in 1985. Yeh notes that there have been many successful
applications of optimization techniques in reservoir studies,
mainly for planning purposes. Presently, however, there is still
a gap between theory and application when it comes to real time
reservoir operation. An important conclusion that he comes to is
that many water utility directors are reluctant to use
optimization models for the daily operation of their water
system. Yeh gives three possible reasons for this. The first is
that few system operators are involved with the development of
the model. This causes them to be uncomfortable with its use and
with the decisions the model suggests. A second reason is that
many of the models are based on overly simplified reservoir
systems, yet they are not designed for ease of use by water
managers. A final reason is that many times we run into
13
The methods reviewed by Yeh are optimization and performance
criteria based simulation. Several of these models and others
are mentioned in this report.
Much of the literature considers multipurpose, multiple reservoir systems rather than systems used primarily for public water supply. This paper is concerned with operations of public
water supply systems during droughts.
Optimization
Linear Programming Models
Most linear programming models are concerned with minimizing economic losses or maximizing benefits subject to some
constraint, by choosing some decision variables such as target
releases and storage values.
Dorfman (1962) first demonstrated the use of linear
programming on 3 over-simplified applications. Although these could not be used in real-time operation, they serve as a useful starting point for more elaborate analysis.
Meier and Beighter (1967) introduced an optimization technique for branched multistage systems and they indicate
dynamic programming has a place in the practical optimization of entire river basin developments. Their model is limited though
because it does not consider temporal allocations over seasons. Roefs and Bodin (1970) suggested decomposing parallel .subsystems over time. The authors were unable to complete an implicit
14
The models reviewed to this point are deterministic in
nature. Deterministic procedures may not consider- uncertainties
of some parameters, and may not lead to optimal or even
satisfactory results. The following models are stochastic in
nature.
Loucks and Falkson (1970) reviewed 3 stochastic techniques:
LP, DP, and policy iteration. The LP techniques included
first-order Markov chains. The three were compared using a simplified
numerical example. Houck and Cohen (1978) assumed a lag-one
Markov process for streamflow description. The approximate
solution to a nonlinear program is found by solving two linear
programs sequentially. System-wide performance levels are
measured and the operation of each reservoir is coordinated with
all other reservoirs.
Chance-constrained LP is one that reflects the probability
conditions on constraints. Revelle, Joeres and Kirby (1969) made
the first application of chance-constrained LP to reservoir
system optimization. Revelle, et al. (1969) proposed the first
linear decision rule (LDR) for his reservoir design and operation
policy. It reads: Rt ~ '^t-l ~ *^t
where Rj. = release during time period t
S^_j^ = storage at end of time period t-1
b^ = decision parameter to be determined.
Revelle et al. (1969) formulated problems in both the
deterministic and stochastic environment. Advantages include the
linear decision rule is simple to apply in practice and
15
not burdensome. Another advantage is that it showed optimal
reservoir capacity is a function of operating policy. The most
important advantage of Revelle's model is that risk is explicit.
The designer or operator specifies the level of certainty
involved.
Revelle and Kirby (1970) improved their original model to
include evaporation losses. They also included several reservoir
performance measures as objective functions including expected
and reliable values of storages and releases, deviations from
targets, and reliabilities of achieving stated goals.
Gustman and Revelle (1973) studied the effects of the length
of decision period using the LDR. The results showed increased
capacity for when decision periods were increased.
Revelle and Gundelach (1975) applied a new LDR to
incorporate the stochastic nature of inflows. A problem was
solved using both the new LDR and the original LDR. The new LDR
showed a 16.3% increase in reservoir capacity, but decreased
variance of average release by 23%. Which method should be used
would depend on a benefit-cost analysis of the two alternatives.
Gundelach and Revelle (1975) derived an algorithm to determine
the capacity and decision constants for any reservoir operated by
use of th LDR. A major advantage is that the algorithm may be
easily implemented without use of a computer.
Takeuchi and Moreau (1974) used LP with stochastic DP. The
objective function of this model consists of two parts: immediate
economic losses within the month and the expected present value
16
reservoirs. The latter function is estimated by imbedding the
linear programming problem in a stochastic DP problem. An
approximate solution was obtained to give an efficient operating
policy. However, it cannot be stated that this is a truly
optimal solution.
Houck and Datta (1981) compared multiple LDR, conditioned
upon streamflows in other seasons, to the original single LDR
model (Revelle et al. 1969). The multiple model returned
smaller reservoir capacities than the single LDR model. When
operating rules of the two models were tested by simulation of
actual reservoir operation, the multiple LDR model was shown to
be superior.
Randall, Houck and Wright (1986), used a linear programming
model to simulate operation of the Indianapolis water system
during periods of drought. Four objectives were considered.
They include: maximize net revenue, maximize reliability,
maximize storage at the end of the optimization horizon, and
maximize streamflow. These, however, are conflicting objectives.
Simulation of real time operation showed several drawbacks in
this model. The operating horizon of the real-time model is
shorter than the actual dought. Reliability could not be
optimized when the entire drought was simulated and therfore was
included as restraint. Randall et al. notes: "one of the
difficulties with real-time simulation is that lack of foresight
into the distant future allows the storage to be drawn down to a
very low level." They also state that "meaningful trade-off
17 changes in operating policies are necessary as a result of lack
of foresight.
; Labadie, Bode and Pineda (1986) used a network optimization model for the Fort Collins, CO, water supply. They claim the
model to be useful for long-range water supply development
planning; multiseason water management and drought contingency; within season operations; and future extension to daily real-time use. The model contains drawbacks; e.g. it does not account for uncertainty of future flows. It also shorts demands with a lower priority as shortages occur rather than incorporate demand
management techniques, such as conservation, or supply augmentation techniques such as purchasing if available.
Simonovic and Marino (1981) used risk-loss functions
associated with flood risk and drought risk in their reliability programming approach. They were able to relate reliability levels and losses caused by excess or too little storage at any given
time. ,.'-ͣ>.:-ͣͣͣ ..!ͣ
-Strycharczyk and Stedinger (1987) evaluated "Reliability Programming" (RP) models that used chance-constrained LP but did not use LDR's. They showed several drawbacks to this approach. "The reliabilities of minimum and maximum storage targets do not relate to the frequency with which minimum and maximum release bounds (causing 'droughts' and 'floods') would be violated. When these models were compared with Revelle et al. LDR and the simple standard operating procedure, the RP models constraint led to an overestimation of reservoir capacity by up to an order of
18
Dynamic Programming (DP) Models
Dynamic Programming (DP) and its variations are used to
optimize a multistage decision process. Several authors have
taken this approach to reservoir management.
Many stochastic DP models have been developed to derive
optimum operating policies that maximize the expected net dollar
benefits for a water resource system. Askew (1974a) developed a
procedure using DP and simulation to derive optimal operating
policies that maximize net economic benefits, yet do not violate
constraints on the probability of system failure. If a system
were to fail, it is penalized thus inducing changes in the
previous optimal policy derived. Askew (1974b) develops a
chance-constrained DP that takes the noneconomic aversion to
failure into account. The importance of this model is that it
takes into effect the sociopolitical implications that may far
outweight losses in economic benefits.
Opricovic and Djordevic (1976) used DP to optimize operation
of a multi-objective reservoir with direct and indirect users. A
three-level algorithm was developed as follows: first level,
optimize water distribution among time inteirvals; second level,
allocate water to direct users; third level, allocate water to
indirect users (from direct users. DP is used at all levels to
determine probabilities of optimal storage level during each
month in the long term.
Yeh and Becker (1982) used a modified linear programming and
dynamic programming algorithm for optimization of a multipurpose,
19 practical for real-time use and could be beneficial for use during periods of high streamflow or drought.
Karanouz and Mock (1987) compared a deterministic model
(DPR) consisting of three components: a dynamic program, a
regression analysis and a simulation; and a stochastic DP (SDP)
using a discrete lag-one Markov process. They found the SDP model performed better for small reservoirs (capacity - 20% of
mean annual flow). The DPR model performed better in all cases when capacity exceeded 50% of mean annual flow.
Yeh (1985) found that nonlinear programming (NLP) models
work but are limited by rate of convergence and computer
requirements. Presently, NLP is limited by dimensionality
problems which could be solved in the future by better computers.
Simulation models have been found effective and useful in
studying operation of water resource systems (Yeh, 1985). These models are able to incorporate experience of engineers, operators
or planners and can therefore be very useful to a utility manager
in seeing the results of his decisions before they actually
occur.
A large number of optimization models exist, however, very few of these are useful for single purpose water supplies. No guidance is given on acceptable risk levels from empirical
RESULTS OF DROUGHT SURVEY
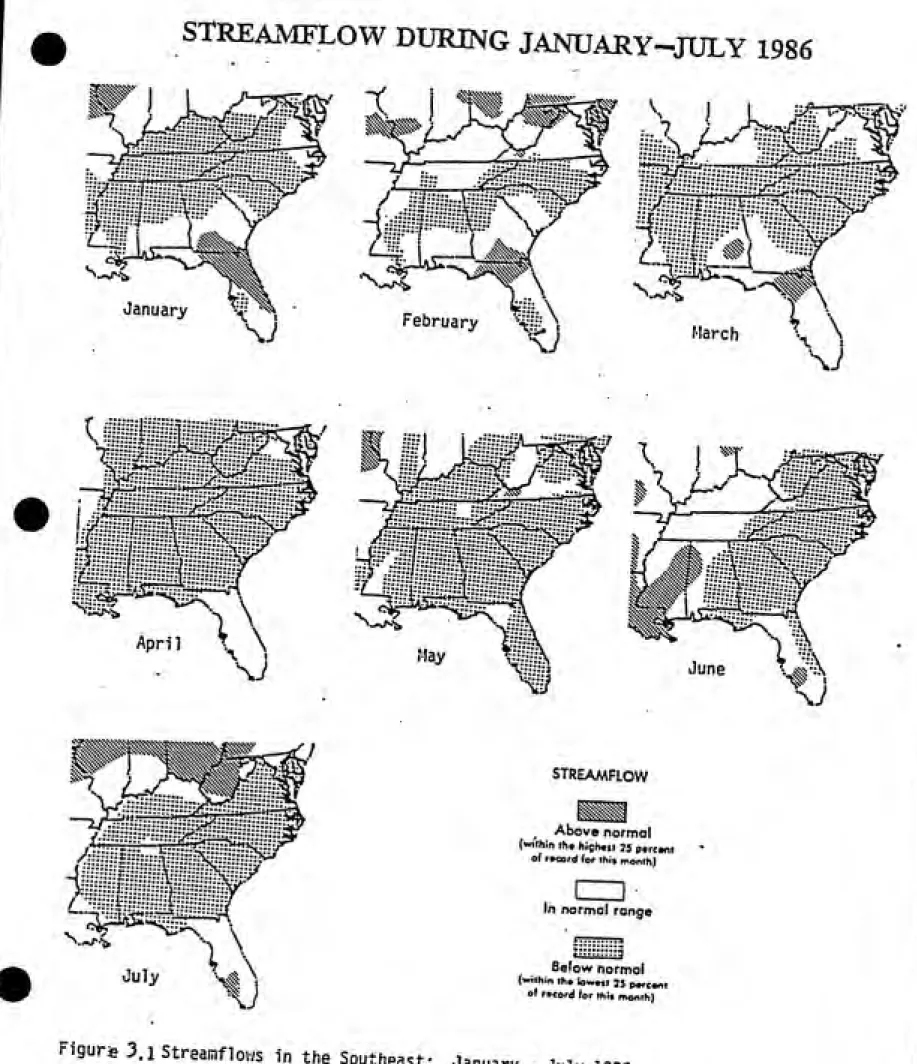
Extensive portions of the southeastern United States
experienced severe drought conditions throughout the first 10
months of 1986. Lack of precipitation caused stream flows in
this region to fall well below normal as shown in Figures 3.1a-g.
The coastal states of Virginia, North Carolina, South Carolina,
and Georgia were especially hard hit by the drought.
Although that drought had effects on a broad range of
activities, the focus of this study is limited to public water
supplies. To determine its impact on supplies and how local
utilities managed the drought, a survey was sent to 573
utilities throughout the states of Alabama, Florida, Georgia,
Kentucky, Mississippi, North Carolina, South Carolina, Tennessee,
and Virginia that serve 10,000 or more people. A total of 422
utilities responded to the survey for a 74% response rate. The
questionnaire is shown in Appendix A.l; responses are tabulated in tabl
3.1-3.4 and shown graphically in Figures 3.2-3.6.
The objective of the first round of the survey was to
identify which utilities were affected by the drought of 1986 and
what was their general state of preparedness. A more detailed
survey will follow on those utilities that had drought management
plans. The second survey will be based partially on the case
studies of the following chapter.
Results were cross tabulated to see how different systems
were affected. Systems were divided into those whose source
is either groundwater or surface water. Results were also
STREAMFLOW DURING JANUARY-JULY 1986
^^
^:?^f:::::
lif!!li'
s
.-J'J^
January
^^
February
^jii|%^
ͣ
'^'^''
N.aJ>.'^
March
^\
\
•-••:::s:r-j-j<g],"^-"--iiiiii'ii. J^ Apr
£V
M
' ••••••3irt" ^••ii*'*v*""»»i**^^^*«
f-^fli§|Pi^
STREAMFLOW Above normal (within th* highest 25 pcrcant
oJ r»cord for this month)
LIJ-In normal range
Below normal
(within th. tew„t 35 p.re«,t of r>cerd for thit month)
Figure 3.1 Streamflows in the Southeast: January - July 1956
•
s-3 a.
«^
u. _ O IJ
^^
uj ͣ-•
s a a. ol i-o n a.jx. 1-a> cc ni xo ri
cu o11
>a. c
> <=ͣ
5^
01
i- ^ -^
(5C3
ͣ
O S.CO —. mo-O -t-" —'
ro 0103
a. ͣ-<
>,g -0*S»ooCM—.O-tiT^f-OOO •B,;5 c; >« in s: ͣ s s OJ GZ 3 -3 o ni =»a: ͣ
a Ol e: OJ "7o
ͣ 4^ 3 Ifl -i-> 0) S-3-S-3 mni oe3E cc .-s ͣ *»
-i-> _j _J <r >-en cj tj 2: <i o
tn I <3: u. cS i<; a: z (751—=> t—
ft .•1 .s - u> OJ cc er o-Q. fry
ou a u ca en
Oj
o ns
o-ͣ
-•T3 C
at *» cm -c mo 2"='-S^ c ͣ a S.00 cK'S'"' ͣ
s
b'-11) S 00
Ti c
ͣ
^ 0)
tnoi 01
s-cc^
U1 c: -k> u m—4 ͣ o s_ 5S 5^ ͣ
a 0) e
OJ UI 5
in •*»
OJ ^ u
S.o'.a
Ol n) Oi QC3CC n) ino—•oo«*r-."«--oo-c !>5--oi?5irtrM(N4i?5rNit tauTinisisi—iCMisitaoo •--"C-j'«*-'»<s»c^intsiis<Qo
«*- r-si f~- CN tsi —• &- r-j ͣ« —"
t»ir5"*>a<»c-4"at5a--in
—•o-ir5o-«»'r~.^o—ͣtoco
_ _ CMS"^'^«»"««"0O aa-<j-0"«-®to-or>~.ooM
h3 —I CN ri ® CN
-0^r0O-43^*OC3^*-<-^.r-^ r-~irii—orMc-r-csi-O"*-r-7ci3ro-H<s»hoK)inc^ R r---tsicr-«c»-scMoo^-r-.r>4 •^-in-ocMta**-—<cn>«tni • ͣͣ*ͣͣͣͣͣͣ ͣ s><a-ir]is>tS)'>-«'-^tS)<S)>3-roo*r~-—iis>«»-«*-fo»-' ft hO—'CM
>- -*-»
ijjLn 1/1
Sx3 (E era _-ain c
ͨ
— tti 5
3: •" o-o ci_ia:
S in
5 ai oj
>co c/j—< I—fc>.*. ^s° UJ — 10
I
U1 »—" 31 n t-cc u -** L. s..r- Q.ri 1
.c ai 1 e Qc s.
ni 0
M--0 -0
a>JX) i
a. i_i or n u > c: ni "=> ni CO mu -0
.^
a mo- 1
r- c--0c —• 0 1 1 OJ 1 1 .!-» u ^ 1
x: mcr- 1 aic o-ac: ^ "^ -0 "O no ͣ
—• 0U1> 1
•4-»
enͣT) 1
3t HI in
h
-1=-t^
umVm^
-» c "--i^
i
Hi ni &. oc in >^o 1 Pi *-u n) T3 e. -1^ mUl x: 01 cc>sC 1
0 TJ •M-§ u a a> ^ir j -a
01 fflg in -*-' 1
1^ U 1
m Oj I
IT 3CC 1 Qt ** m 4.J> LO cr-'-^hOin^or^'Sainr^oo
i>JK5r^i>4i>j«a--^ioio^»->*• c-4 (a f ^ "S> -o <s> ^
hOtM —t
ͣ
a-coKii:
-«iSBir3in«aina3-o^cg
CM-o^CNi-—«rorNi ͣ—»'*ͣ PS
o-CM'«»T--iSooo-r-r^t-l
Q—1 t-o r M « PS -^ rs r--. in
—«inoo-j3"»inr~t-7inoo
IS*—«inco~or~-i^—<t-o—I
—'—•-dDDt^Jinoin"*"*-I— incr--'-<^r^cocDr^r>i
— >* o^ 00 h^ <a "s r-4 —I in <*
—"Sic^in-oisiajtsi-oiS) r-bor>ir»-CMinrM«i-erirN(
irih0'-<a5inr«t--^,acvjr~^
i~o<»"^^ to in tsi CM (-1
^-•O-l-^lO'-OO^I— c^^—co in~o—'COinc>qg~oin<aB ss com t-ce ^-_ S2 CD O CJ z C3 — to dS LUU-CCCD
-J —i<r>-COLjtjzlO: o
Of in CO oei— CQ—l can-=i2 ͨ -to nj to
lnc^•o^o^•ͣ>t-.^OK5^--ͣ-o
csiin--«o<^-<c"^csirM«d-•^^^O-'O'^CN'^'O'^"*'
'*inO«fO<»-t^r-Mf-^'«i-f^4 04 r~*
<t-UTO*-«'C>-s0t^--0"'^^
~-tC-i in
I K) rs r~J o i"'Mn to ͣ« m o 2;—•in"*—^ c-4—*—ͣ'-• o^ 00
,—4 O
rO
WATER USE REDUCTIONS IN 1986
RECXJESTS BT X OF STATE TOTAL
8
1
o
'A^
'A^
m
&^
\7V\ REQ. RED
____ STATEIV^ VDLREDFigure 3.^
INVOKED POLICY IN '86
100
i
ILo
m
z^a
EZl Invoto
STATE
rsT^ Vol Cons Figure 3.3
REGIONAL AGREEMENTS TO SUPPLY WATER
100
DURMG DROUGHT CONDmONS
B
K
^si
EZI Agrtwiant
m
Bought fZ^ Sold
00 en
in IxJ
o
Q on o
X
o
o
Q
8
T"
s
T" s
K\\\\\^
^
xxxxxxv
^
E
^
bi
t^^X^^
1
i:^^^^^
m-^^
E5
i::^^x^^^
^
kXXXXXXXXX
^
T---1---1---1---r
fj:^^
R
$»
^
S g
§
c
8 8 9 8 8 5°
>-o
—1
o
a.
o
ID o
Q
o
UJ 01
5^^^^^^^
K^^^^<C«-l^^^v^v^v
\////////
^^^(^
K^^^v'CCCC
<
o UJ
8
"T s
T" s
$
-5
-a
. o
E
S
8
S 6_
i^^^^
L\V\'^'«
-$
k^^VWvV
55^^$5^5^^^
EZZ-c!
LVWVVWVVVWCCC
^^
sg
S S 9 8 S 5
29
overall Response
The drought of 1986 had varying effects on communities depending on how well prepared each was to face a drought. A total of 40% of those responding asked customers for some sort of conservation. Voluntary conservation measures were put into
effect by 37% of the utilities while only 14% implemented mandatory conservation.
One of the problems faced by a large number of utilities was
that they had no ordinance or other written policy for operating
their water supply under drought conditions. Only 39% had any ordinance for drought management policies in 1986. If a
utility's supply will not always be greater than demand, an
operating policy would be beneficial. A total of 78 utilities or 18% have developed a policy since 1986. This includes utilities that had a policy in 1986 but felt the need to update or develop a new policy to more efficiently operate their system. Only 18% had a technical report to support the basis for such a policy. This is an extremely low number because it shows that there are little if any technical criteria for operating a water system. Upon speaking with several utility directors that claim to have a technical report, it appears that the main criteria used for
decision making are judgment and experience of the water managers.
In South Carolina, the main criterian used for following their
ordinances is the Palmer Index.
One reason that conservation had to be implemented in
several cases is due to the lack of additional sources of water
that may be obtained during times of emergency. Obtaining water
30
through conservation while avoiding excessive drawdowns on local
supplies. One-third of utilities surveyed were party to an
agreement with another utilitiy to provide a supplementary supply
of water during drought conditions. Of these, 26% (36 of 141) or
9% of the total purchased water under that agreement in 1986. A
total of 20% sold water under this agreement in 1986. This
difference can be explained by the possibility of these utilities
selling to utilities serving under 10,000 people and utilities
purchasing from more than one source. ,&: :r
The drought of 1986 may have spurred utilities into
increasing supply rapidly. If a system is designed to meet
demand for 20 years into the future, then it is expected that about
5% of utilities will increase size of supply each year. However,
32% of those surveyed increased the size of their supply since
1986. Of those that entered some form of consevation, 48% have
increased supply since 1986. Of those with intergovernmental
agreements, 37% have increased supply and 50% of those who
purchased water under that agreement have increased supply.
The utilities that have an operating policy received
assistance in preparing it from several sources. Approximately
84% of utilities took part in some form in the preparation of
their policy or ordinance. Policies were developed with
help from neighboring utilities in 30% of the cases. Of those
utilities that developed a policy since 1986, 42% got help from
neighboring utilities. Consultants accounted for 25% of all
policies developed. The reason this number may not be larger is
31
Only 2% of utilities used a university-based technical assistance
program to aid in developing a policy. Moreau (1988b) has
currently developed working models for Greensboro, Durham, and
OWASA. OWASA has currently adapted Moreau's model but still does not follow it verbatim.
A state government technical assistance program was used by
33% of utilities with an operating policy or ordinance. This
number varied largely by state. South Carolina gave the largest
percentage of assistance to its utilities. This is due to the
"Drought Response Act" passed by the South Carolina General
Assembly in 1985. "This act required public entities that supply
water to develop and implement local drought response ordinances
and plans for water conservation programs and alternative water
sources. The Drought Response Act also established six regional
Drought Response Committees to represent the interests of local
governments, agriculture, industry, and domestic water users in
each particular region of the state known as Drought Management
Areas." (Charleston Comm. of Public Works, 1987). Florida has
developed water management districts to manage water supplies in
different areas of the state. These districts developed general
drought operating policies. The Georgia Department of Natural
Resources Environmental Protection Division required all systems
to develop and implement a water conservation plan. (City of
Griffin, 1984) .
Assistance from leagues of municipalities occurred in only
6% of the cases. An increase in this number could allow new
32 Other sources accounted for about 10% of assistance
programs. These sources could be anything depending on how the
person who responded interpreted the other six choices.
Source of Water Supply
Water is supplied to people by two main sources. These are
groundwater and surface water. Surface water includes
withdrawals directly from streams, rivers, and natural lakes and from reservoirs from impoundments on rivers.
Utilities were divided into those who supply surface
waters, those who supply groundwater and those who purchase from another utility. Some utilities use two or all three of these
sources.
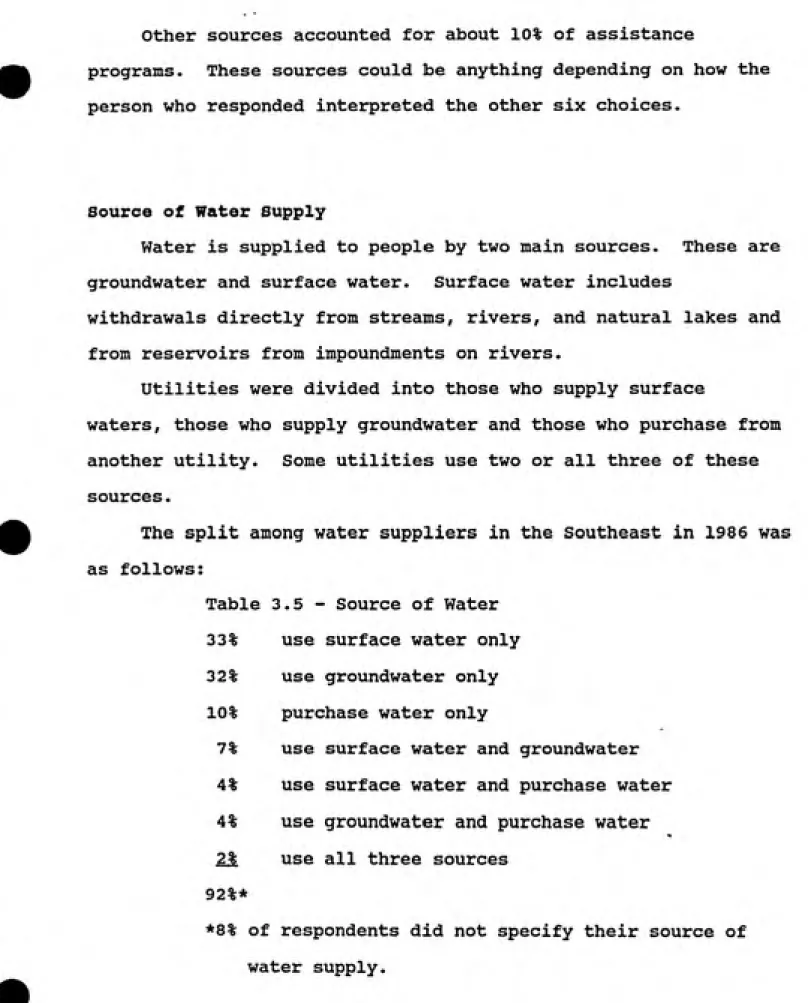
The split among water suppliers in the Southeast in 1986 was
as follows:
Table 3.5 - Source of Water
33% use surface water only 32% use groundwater only 10% purchase water only
7% use surface water and groundwater 4% use surface water and purchase water 4% use groundwater and purchase water 2% use all three sources
92%*
33
Of those utilities that only used surface water in 1986,
only 12% had the ability to purchase water during an emergency.
Of those surface water supplies who also purchased waters, 35% did so due to emergency conditions.
Utilities whose main supply was groundwater had the
opportunity to purchase in 20% of the cases. Of those who use
groundwater and also purchased in 1986, only 21% (6 in 28) did
so due to emergency conditions.
A total of 84 utilities (20%) purchased water in 1986; 17%
purchased water throughout the year; while 2% purchased
seasonally as needed. In 1986, only 3% of utilities purchased
water due to emergencxy conditions. However, 15% did have the
ability to purchase during emergency conditions. A promising
result of the drought was that only 19% (12 of 64) of those who
had the ability to purchase during an emergency had to purchase
in 1986 (note: an emergency can consist of shortage due to a
number of reasons including drought, pump failure, plant failure,
distribution system breakage, etc.).
An interesting result is that groundwater and surface water
suppliers seemed to be equally prepared and affected by the
drought. 43% of groundwater suppliers asked for some form of
conservation, while 40% of surface water systems entered
conservation. Mandatory conservation measures were implemented
by 14% of groundwater suppliers and 16% of surface water suppliers.
Intergovernmental agreements to provide supplementary
supplies of water during drought conditions involved 37% of
34
surface water and groundwater suppliers bought water under this
agreement in 10% of the cases. Surface water systems tended to
sell more often; 29% sold water in 1986 compared to 16% of
groundwater systems.
Both groundwater and surface water suppliers seemed equally
unprepared to operate water supplies during droughts as only 44%
and 40% respectively had any kind of formal operating policy or
ordinances. Only 17% of groundwater and 20% of surface water
suppliers had a report to describe the technical basis for their
policy.
Since the drought of 1986 was spread over a wide region, we
would expect varying effects on the different states. This also
depended on how prepared each state was to face a drought. Some
states had already implemented general statewide operating plans
and policies, or at least water conservation programs. The
results were cross tabulated for each state to see the impact the
drought had on individual states and how prepared each was to
face it.
Alabama
Alabama has 57 utilities that serve over 10,000 people. A
total of 42 utilities responded to the survey. Of these
approximately 36% are surface water supplies, 29% are
ground-water suppliers, 12% use both surface and groundground-water and 17%
purchase their entire supply. Some surface and groundwater
suppliers also purchase water. Only one utility claimed to buy
35
Only 21% of all Alabama utilities had a drought operating
policy or ordinance in 1986. Since 1986, 14% have adopted a
policy. Only 2 ( 5%) utilities had any technical basis for this
policy.
Because of the drought,, several utilities were forced to
make decisions without following any formal policy. Conservation
measures were taken by 36% of utilities but only 13% of these (2
in 15) did so under an ordinance that was invoked in 1986. Only
13% (2 in 15) of those who entered conservation implemented
mandatory conservation.
Thirty-eight percent of all utilities had agreements to
provide a supplementary supply of water during drought
conditions. Of these, 44% had to implement conservation measures
any way. Thirty-one percent bought water under this agreement.
Of those who purchased, 80% (4 of 5) also entered conservation.
The impact of the drought also caused many utilities to
realize the need to increase the size of their supplies to meet
increased demand during all conditions. Almost 38% of utilities
increased the capacity of their water supply since 1986. Of
those who entered conservation, 47% (7 in 15) increased their
supply capacity.
Florida
Florida consists of 149 water utilities who serve 10,000 or
more people. Of these, 97 or 65% responded to the survey. In the past several years, Florida has established 5 regional water
management districts to set up guidelines for utilities in
36
by their respective water management districts as to severity of
drought conditions. Utilities also rely on water management
districts for legal clout for restrictions on water use.
Florida is mainly served by groundwater supplies. Only 8%
of utilities rely solely on surface water and a total of 13% use
surface water to some extent. Only 5% of the systems purchase
their entire supply of water.
A 1982 "Survey of Water Conservation Programs in the Fifty
States" (Blackwelder & Carlson, 1982) showed Flordia falling
behind other states in several areas of water conservation
including drought contingency planning. However, at the time
Florida introduced a new water management policy which emphasized
nonstructural approaches. This was considered the most
innovative policy at this time. Presently it seems that Florida
is one of the most prepared states throughout the Southeast to
face drought situations.
Several utilities in southern Florida felt no effects of the
1986 drought. They did, however, feel a severe drought in 1985.
The drought of 1985 exceeded an estimated frequency of once every
100 years.
Compared to the Southeast as a whole, Florida was generally
better prepared to operate their systems under drought
conditions. Nearly 61% of all Florida utilities had a written
policy or ordinance to operate their sytems under drought
conditions in 1986 compared to the Southeast as a whole in which
37
describes the technical basis for decision making. Again, we see
that actual decisions are often made by judgment and experience.
Obviously, many areas of Florida were severely affected by
the drought, resulting in 46% entering conservation of some type.
Voluntary conservation was implemented by 43% of utilities and
mandatory conservation was entered by 19% of all utilities.
Three percent of utilities skipped voluntary and went straight to
mandatory. Of those utilities who asked for voluntary
conservation measures, 71% had ordinances and 84% of those who
implemented mandatory measures, had an ordinance.
Regionalized water supplies does not seem to be a prevalent
method of supplementing ones water supply during drought periods
in Florida. While 37% of utilities said they had an agreement to
provide a supplemental water source during droughts, only 5%
bought water and 7% sold water under this agreement in 1986. Also several utilities claimed they could buy water during emergencies such as system breakdown, but they said they could not purchase during droughts. Only 1 in 5 utilities who
purchased did not enter any form of conservation. Purchasing
water should be the first alternative to conservation if at all
possible.
Parts of Florida have faced dry years throughout the 1980's.
Water management districts are constantly looking into ways to
increase or reduce demand. Water reuse has gained particular
attention in areas such as St. Petersburg. Even with plans to
implement long-term conservation techniques, supply augmentation
is still prevalent here. Since 1986, 46% of all utilities have
38
64% have increased supply. The problem here is that population
is growing while supply is dwindling. Long-term conservation
techniques and water reuse must seriously be considered to reduce
Florida's growing demand.
While Florida has had and continues to develop intensive
water operating policies, they must consider the effectiveness of
what they have. Several utilities base their decision making on
their water management districts (WMD). They do not have a
clear, set criteria for making their own decisions. Presently,
it appears that those utilities with a written operating policy
for drought conditions are in much better shape when it comes to
making it through a drought unscathed.
Georgia
Georgia consists of 62 water utilities serving 10,000 or
more people. Supplies are split fairly equally between ground
water suppliers and surface water suppliers. In 1981, the
Georgia Department of Natural Resources published the Georgia
Water Conservtion Guidebook. The Georgia EPD (Environmental
Protection Department) set guidelines to use as a technical
basis for drought management policies. This has spurred water
utilities to prepare special operating policies during drought
conditions.
In 1986, 65% (32/49) of all utilities had operating policies
or ordinances. Sixty-three percent (20/32) of these utilities
implemented their ordinance in 1986 due to the drought. Since
39
The drought was so severe that 71% of all utilities adapted
water use restrictions. Voluntary restrictions were asked for by
61% of the communities and mandatory measures were implemented in
49% of Georgia utilities. Of those utilities with a policy, 67%
asked for voluntary measures and 62.5% resorted to mandatory
water restraints.
Intergovernmental agreements were about the same as those
for the entire Southeast with 33% of utilities having some form
of agreement. Under this agreement, 18% of all utilities
purchased water while 22% sold. This is a case where some
utilities both bought and sold water. Sixty-seven percent of
those who purchased also entered conservation and 82% of those who sold entered conservation. It is quite interesting that
utilities would continue to sell water even when they must
conserve themselves.
A high number (50%) of Georgia utilities have also increased
the capacity of their supply since 1986. More than half of those
who entered consevation have increased supply. Surface water
supplies were more affected by the drought with over 90% calling
for conservation while 48% of groundwater suppliers called for
reductions in water use. Sixty-two percent of surface water
suppliers implemented an ordinance while only 24% of groundwater
40
Kentucky
Kentucky has only 44 systems that serve 10,000 or more
people. Of these at least 67% are surface water supplies.
Rather than drawing water from impoundments, many municipalities
draw directly from free flowing rivers such as the Ohio River.
The state has developed a general water conservation plan to be
used during droughts. However, local utilities have been slow to
adapt this.
Overall only 25% of utilities had any formal operating
policy in 1986. Since then an additional 6% have adapted
policies. Local municipalities did not seem to be adversely
affected by the drought. Large river flows were able to pull
many utilities through the dry weather without any problems.
Blackwelder and Carlson found "nothing outstanding with the
state's water conservation program," This seems to still be the
case, however utilities are slowly moving toward adapting drought
management policies. Mississippi
Mississsippi has only 31 utilities serving 10,000 or more
people. The state is generally serviced by ground water except
for 2 utilities who have surface water supplies. The state is
generally blessed with an abundance of water and felt little if
any effects of the 1986 drought.
The two cities with surface water supplies were the only
ones to have an ordinance. Only 1 of these had a technical basis
for its policy. If a major drought were to hit Mississippi for
an extended period, it might not be prepared make quick decisions
41
North Carolina
North Carolina has 60 utilities that serve over 10,000
people. Surface water is the dominant source here serving about
75% of communities. Two communities also purchase from surface
water impoundments. About 20% of utilities use ground water.
Parts of North Carolina were severely impacted by the
drought. Only 36% of utilities had a written policy and only 13%
had a technical basis for this policy. Even with a policy, many
cities were unable to determine the possible outcome of making
certain decisions regarding interbasin transfers and the
imposition of various conservation measures. Many utilities
relied on past experience; yet, they did not realize the severity
of the situation. City managers seemed not to have set criteria
to base their decisions on.
The drought resulted in some form of water use restrictions
being imposed by 39% of North Carolina cities. Only 11%
eventually implemented mandatory measures, but this could be due
in part because some utilities did not have the power to
implement mandatory restrictions.
Intergovernmental agreements for water exchange during
droughts were somewhat prevalent in certain regions of North
Carolina. A total of 29% of utilities had agreements to provide
a supplementary supply of water under drought conditions.
Nineteen percent purchased under this agreement, while 63% sold
water in 1986.
Since 1986, 18% of all utilities have increased supply.
However, of those who implemented conservation, 36% have
MAP A
.MPLEMENTED VOLUN^TARV CONSERVATION,.,;^
Figure 3.7 Source: Shea (1988)
43
Interestingly while almost half of those utilities who used
conservation in 1986 had an ordinance already, an additional
one-third have adopted an ordinance since then.
South Carolina
South Carolina serves 49 communities of 10,000 or more
people. The South Carolina Drought Response Act of 1985
established 6 Drought Management Areas (DMA) shown in figure
3.4). The act also requires utilities to develop and implement
local drought response ordinances and plans which identify
alternate water sources and a water reduction program. South
Carolina consists mainly of surface water supplies, but some
large supplies are from groundwater. It also has a groundwater
management program to limit withdrawals to under 100,000 gpd.
Even though the state had passed the Drought Response Act in
1985, only 28% of utilities had an ordinance or plan during the
1986 drought. Since 1986 however, more than 64% of citities have
developed an ordinance. Also 28% of utilities in SC have a
technical basis to support their plan.
South Carolina definitely felt an impact due to the drought,
with 59% of municipalities calling for various conservation
measures. Voluntary conservation was asked for by 51% of
utilities and mandatory conservation was implemented in 13% of
the cases. Of those utilities who already had an ordinance in
1986, 55% used voluntary conservation and 27% imposed mandatory
DROUGHT MANAGEMENT AREAS
.N
n
+ 1.0
+0.5 -0.5 -1.5 -3.0 -4.0
NORTHWEST
NORTH CENTRAL
NORTHEAST
WEST
CENTRAL
CENTRAL
0^
SOUTHERN
o c
x
m
00
INDEX EXPLANATION
or
lo
.to
lo
lo. or
above 0.9
-1.49 -2.99 -3.99 above
Molsl spell ,
Incipient moist spell
Incipient drought
Moderate drought Severe drought
Extreme drought Produced by SCYrRCCarlographic Lab
45
Intergovernmental agreements for water exchange during
droughts involved 41% of all utilities. This is somewhat higher than the rest of the Southeast and may be due to the DMA's.
However, only 8% of utilities purchased water under this
agreement in 1986 but none of those who purchased had to enter mandatory conservation. However, 19% of those who had agreements used mandatory instead of purchasing to help get through the
drought.
The impact of the drought was also shown in that 36% of municipalities have increased capacity of their supply since
1986. Also, more than half of those who used some form of
conservation have increased supply.
Tennessee
Tennessee consists of 65 utilities serving 10,000 or more people. Tennessee consists of about 46% surface water suppliers, about 28% ground water, 18% whose source is both surface and ground water and 7% who purchase their entire supply.
Blackwelder and Carlson (1982) showed no outstanding
features of the state's water conservation program. This trend seems to have continued with limited drought contingency plans throughout the state's utilities. Only 17% of utilities had a plan in 1986. While Tennessee was moderately impacted by the drought, only one utility implemented its ordinance. Less than 8% of utilities have developed a policy since 1986. A
46
The drought was moderate with 26% (14/53) of utilities
calling for voluntary conservation but only one utility imposing mandatory conservation.
One significant factor in Tennessee was that 42% of the cities had agreements for the emergency sale and/or purchase of water; 13% did purchase water under this agreement in 1986. More
significantly 20 of 22 sold water in 1986.
Capacity of water supply was increased by 21% of utilities. Only 6% of all utilities entered conservation and then increased supply since 1986.
Virginia
Virginia has 56 utilities that serve at least 10,000 people. Several of these serve large populations of 50,000 or more.
Only 63% of Virginia utilities responded to the survey, thus limiting the accuracy of these results. The main source of supply in Virginia is surface waters serving about 70% of the cities. Groundwater accounts for 10% of supplies and 20% of utilities purchase their entire supply.
Virginia is active in the water conservation area and in drought contingency planning (Blackwelder and Carlson,1982). They are also involved in regionalizing supplies where possible.
Although the state as a whole is involved in drought management, only 40% of cities had a written policy. An
additional 9% have added a policy since 1986. Of those with a policy 36% invoked it in 1986.
Overall 26% of utilities entered some form of conservation
47
Fourteen percent of all utilities called for consrevation
measures under an ordinance.
In Virginia, 40% of all utilities purchase at least part of their water throughout the year. Agreements for water exchange during droughts involve 31% of utilities. Although interbasin
transfers are prevalent here, only 6% of utilities claimed to have purchased water under emergency conditions in 1986.
Since 1986, 9% of utilities have increased size of supply. This is expected for a 2-year period.
Virginia seems to have been moderately affected by the drought. Only 11% of utilities were prepared with ordinances that have a technical basis. Many utilities may have acted without knowledge of the risk they faced.
Conclusions
Extensive areas of the Southeast were affected by the drought of 1986. The states of North Carolina, South Carolina and Georgia faced the most severe conditions.
South Carolina has significantly improved their drought
management policies over the past few years. While a good number of utilities presently have drought management policies, too few have any technical basis for this. Those who do have a technical basis often use criteria such as the Palmer Drought Serveity
Index. While this is a good indication of drought severity, it tells little about the implications to individual water supplies.
Criteria used should be representative of the specific system using it. Water managers need sufficient information on the risk
48
The extent to which utilities were affected varied with how
prepared they were to manage their systems under these
conditions. Few utilities had prepared plans to help in decision making. A lack of inter-local agreements and a minimum of
technical criteria to guide in decision making may have led to
dangerously low drawdowns on water supplies.
Without the backing of an ordinance in many cases, it may have been impossible to implement mandatory restrictions that
could have further reduced demand.
If another drought continued through 1988, Georgia, Florida, and South Carolina would be the best prepared states to face it.
It is not difficult to determine that there is a water
CASE STUDIES
The drought of 1986 had varying effects on different water
supplies throughout the Southeast. The variation in effects was
not just regional, but varied from city to city depending on the
state of their water supplies and their operating policies.
Four utilities in the piedmont of North Carolina, separated by
only 60 miles, are examined to determine how they managed their
systems during 1986 and how well those systems performed.
The four utilities studied in this part of the survey were
the City of Durham, Orange Water and Sewer Authority (OWASA), the
City of Greensboro, and the CitY of High Point. Personal
interviews were conducted with the water utility managers to
determine the state of their operating policies during the
drought of 1986. The utility directors also expressed personal
opinion in answering questions.
The following questions were put to the utility directors:
1. What is the status of your intergovernmental agreements?
Do you have any written or unwritten agreements to
provide or obtain a supplementary source of water during
drought conditions and with whom?
2. What are the criteria used (if any) for decision making
during droughts? How do you decide to enter different
levels of conservation?
3. What methods were used to help in decision making (such
as simulation models or risk tables)?
4. What are the contents of your ordinance for operating
50
5. What techniques were used to inform the public about
the situation and the content of your ordinance?
- When and how were the public informed?
- Do you have an ongoing public education program?
(such as)
- Workshops
- Demonstrations
- Bill inserts
6. What was the performance of implementing different
levels of conservation?
A. Compare with and without conservation
B. When were different stages of conservation taken?
C. What were the demand levels for each period?
D. When did storage bottom out?
E. What would reservoir levels have been with no policy?
7. What are your methods for obtaining data on your system?
A. Reservoir levels - who reads, how often, and how are
data transmitted?
B. Streamflows - gage, who reads, who interprets
stage-discharge curves, how transmitted? C. How do you estimate evaporation?
D. How do you estimate demand with and without
51
High Point
The City of High Point, NC, serves a population of 70,000
people with 17,500 residential connections and a total of 25,000
connections including commercial and industrial accounts. Usage
is split approximately 50% residential and 50% commercial. The
city is served by two reservoirs. They are Oak Hollow Lake with a
capacity of 3.2 billion gallons and High Point City Lake with a
capacity of 1.2 BG for a total system capacity of 4.4 BG. The
safe yield of this system is 25 MGD. The average daily demand in
1986 was 11.5 MGD. High Point is curerntly served by two water
filtration plants.
High Point may serve as an extreme case due to the excess
capacity of their system. High Point does not currently, nor did
it have any intergovernmental agreements in 1986 to buy or sell
water during drought or emergency conditions. This is partially
due to the capacity of the reservoirs being able to supply the
system at the current rate of demand for more than a year (383
days) before running out of water. High Point is also
appropriately named because it is located at a point of high
elevation relative to the surrounding area. This makes it nearly
impossible to be supplied by surrounding communities because none
are of sufficient pressure to reach High Point•s system.
High Point did not have a problem meeting demand ^in 1986 and