A MATHEMATICAL MODEL FOR PREDICTING MAXIMAL HEART RATE, MAXIMAL OXYGEN UPTAKE, AND OXYGEN UPTAKE KINETICS DURING WALKING AND
RUNNING AT VARIED INTENSITIES
Andrew Maurice Borror
A thesis submitted to the faculty of the University of North Carolina at Chapel Hill in partial fulfillment of the requirement for the degree of Master of Arts in the Department of Exercise and
Sport Science (Exercise Physiology).
Chapel Hill 2018
Approved by:
Claudio L. Battaglini Edgar Shields
2018
ABSTRACT
Andrew Maurice Borror: A mathematical model for predicting maximum heart rate, maximal oxygen uptake, and oxygen uptake kinetics during treadmill walking and running at varied
intensities
(Under the direction of Claudio L. Battaglini)
Maximal oxygen uptake (VO2 max) is difficult to measure and most predictions are
inaccurate due to a variety of assumptions. The purpose of this study was to validate a dynamical system model (DSM) for predicting HR max and VO2 max during walking and running. A
secondary purpose was to predict VO2 responses using a neural network. Twenty-six healthy
males completed a maximal cardiopulmonary exercise test (CPET) and a submaximal protocol. The models were applied to the submaximal data to estimate the participants’ HR/VO2 responses
and predict their HR max and VO2 max. The model accurately tracked HR and VO2 responses
(R2 = -.85-0.99). However, it did not accurately estimate max (R2 < 0). Further refinement of the
ACKNOWLEDGEMENTS
I would like to thank my advisor, Dr. Claudio Battaglini for his mentorship and encouragement. He has provided guidance, helped me relax, and reminded me why I love
TABLE OF CONTENTS
LIST OF TABLES ...VII LIST OF FIGURES...VIII LIST OF ABBREVIATIONS ...IX Chapter
I. INTRODUCTION ...1
Statement of purpose...3
Research questions ...4
Hypotheses ...4
Operational Definitions ...5
Delimitations ...6
Assumptions ...7
Limitations ...7
Significance of study...7
II. REVIEW OF LITERATURE ...9
Cardiorespiratory fitness and the oxygen cascade ...9
Maximal oxygen uptake ...10
Submaximal prediction tests ...10
Non-exercise equations ...14
Dynamical system modeling ...15
III. METHODOLOGY ...18
Subjects ...18
Study Design ...19
Instrumentation ...20
Procedures ...21
Data Analysis ...22
Statistical Analysis ...26
IV. RESULTS ...28
Subjects ...28
Dynamical System Model & Genetic Algorithm...29
Heart Rate & Oxygen Uptake Kinetics ...29
Maximum Heart Rate Estimates ...31
VO2 Max Estimates...33
Artificial Neural Network ...34
Time Series Predictions ...35
VO2 Max Predictions ...36
V. DISCUSSION ...38
VO2 Max ...38
Time Series Predictions ...39
Heart Rate Max Estimates ...43
VO2 Max Estimates...43
Potential Issues...44
Limitations ...47
Future Research ...48
Conclusions ...49
APPENDIX A: PRE-ASSESSMENT GUIDELINES ...51
APPENDIX B: PHYSICAL ACTIVITY READINESS QUESTIONNAIRE ...52
APPENDIX C: MEDICAL HISTORY QUESTIONNAIRE ...53
APPENDIX D: PHYSICAL ACTIVITY RATING QUESTIONNAIRE ...54
APPENDIX E: PERCEIVED FUNCTIONAL ABILITY QUATIONNAIRE ...59
APPENDIX F: BRUCE TREADMILL TEST PROTOCOL ...60
APPENDIX G: DATA COLLECTION SHEET ...62
APPENDIX H: SINGLE-STAGE TREADMILL TEST ...65
APPENDIX I: NON-EXERCISE EQUATIONS ...66
LIST OF TABLES
Table 1. Subject Characteristics ...37
Table 2. HR and VO2 time series prediction accuracy for walking and running ...38
Table 3. Comparison of HR max estimations ...40
LIST OF FIGURES
Figure 1. Artificial Neural Network Diagram...26 Figure 2. Study Timeline ...28 Figure 3. Example time series plot of the model’s predictions for (a) walking
HR, (b) walking VO2, (c) running HR, (d) running VO2 ...39
Figure 4. HR max predictions from the (a) walking model (b) running model,
(c) 220 – Age equation, and (d) 208 – .7*age equation ...41 Figure 5. Line of identity plots comparing the VO2 max predictions to the
experimental values for the (a) DSM-GA: Walk, (b) DSM-GA: Run (c) Ebbeling single-stage test, (d) Jackson equation, (e) George equation,
and (f) Bruce equation ...43 Figure 6. Line of identity plot comparing the ANN VO2 prediction to the
experimental values for (a) walking and (b) running...44 Figure 7. Example time series plot of the ANN’s VO2 prediction for
(a) walking and (b) running ...45 Figure 8. Line of identity plots comparing the VO2 max predictions using data
LIST OF ABBREVIATIONS
BP Blood Pressure
CPET Cardiopulmonary Exercise Test CRF Cardiorespiratory Fitness
DSM Dynamical System Model ECG Electrocardiogram
GA Genetic Algorithm
GXT Graded Exercise Test
HR Heart Rate
HR max Maximum Heart Rate
kg Kilogram
ANN Neural Network
PFA Perceived Functional Ability PA-R Physical Activity Rating
PAR-Q Physical Activity Readiness Questionnaire R Coefficient of Correlation
RPE Rate of Preceived Exertion SD Standard Deviation
SEE Standard Error of the Estimate VT Ventilatory Threshold
VO2 max Maximal Oxygen Uptake
CHAPTER 1
INTRODUCTION
Cardiorespiratory fitness (CRF) is considered the single best measurement of fitness and overall health in people. Low CRF has been associated with the development of chronic
conditions as well as all cause mortality1–6. In clinical populations and sedentary individuals, low CRF is associated with lower levels of functionality and overall quality of life1,3–6. In athletes, CRF is the best predictor of performance in endurance events. Knowing an individual’s CRF makes it possible to accurately prescribe exercise and to evaluate how CRF changes over time, whether due to exercise training, ageing, or disease.
CRF is typically expressed as maximal oxygen uptake (VO2 max), or the highest volume
of oxygen an individual can consume during exercise7. A maximal cardiopulmonary exercise test (CPET) with indirect calorimetry is considered the gold standard procedure for the assessment of VO2 max. Unfortunately, this is an elaborate procedure that requires expensive equipment,
trained technicians, an all-out effort from individuals. In clinical populations, supervision from a physician during the test is recommended, adding another level of complexity.
Due to these limitations, submaximal exercise tests that do not require an all-out effort are popular for estimating VO2 max. These tests are used instead of maximal tests when
tests may be more appropriate than maximal tests depending on the population, setting, and desired applicability of the results.
While useful at times, current submaximal exercise tests have some disadvantages. These tests have a large degree of uncertainty and error due to many assumptions incorporated in linear mathematical models that are used to predict VO2 max8,9. One major assumption is that heart rate
(HR) and oxygen uptake (VO2) have a linear relationship with exercise intensity, which is known
not to be true10. Another source of error is the ubiquitous “220-age” equation used to estimate an individual’s maximum heart rate (HR max). Although the “220-age” equation is a rough estimate that broadly fits a large population, it may not be accurate for a specific individual as it can produce errors of estimation larger than 12 bpm8,11,12. Errors like this can become magnified
when incorporated into a mathematical model and extrapolated out to predict VO2 max.
Submaximal exercise tests also make the assumption that biomechanical efficiency is the same from person to person and that steady state is reached during each stage (Mazzoleni 17). In general, current submaximal estimations fail to take into account the person-specific nature of physiology and the non-linearity of HR and VO2 responses.
Recently, studies have provided promising evidence of mathematical models that may be able to address these issues8,13. Mazzoleni et al. (2016) developed a mathematical model that is able to account for the inter-individual differences along the non-linearity of HR and VO2
responses during cycling8. Using a dynamical system model (DSM) and genetic algorithm (GA), it is able to accurately predict HR max, VO2 max, and VO2 kinetics using power and cadence as
indicators of exercise intensity8. This model offers more accuracy in predicting HR max and VO2
training zones, a practice that is common in the general public. The prediction of VO2 max has
applications for both athletes and clinicians, including accurate exercise prescription, the evaluation of training progression, and the measurement of CRF as it changes over time. Validating Mazzoleni et al.’s model for walking and running would be useful as these are common modalities people are comfortable with. Treadmill tests also tend to produce higher VO2 max values than cycling tests because running involves whole-body movement7,14. Since
this model allows real-time predictions, VO2 can be estimated without the need for a specific
protocol or achievement of steady-state exercise15. This would be particularly useful for runners,
as real-time estimations of VO2 during exercise could be used during their training.
One limitation of this model is that it still requires the measurement of VO2 data to
predict VO2 max. Once the model is validated, it could potentially be simplified if VO2
measurement was no longer necessary. Beltrame et al. (2016) recently utilized an artificial neural network (ANN) technique to estimate VO2 during exercise using only HR and other
easy-to-obtain inputs13. Applying an ANN to the model used by Mazzoleni could allow VO2 max to be
accurately predicted without the need to measure VO2 data13,15. This is exciting because it would
make real-time VO2 estimations and the accurate assessment of VO2 max possible in a variety of
settings such as a hospitals, clinics, or athletic facilities using only a heart rate monitor and a measure of exercise intensity (e.g. treadmill or running watch).
Purpose Statement
secondary purpose of this study will be to predict VO2 kinetics and VO2 max using HR and
exercise intensity data by incorporating an ANN into the model.
Research Questions
RQ1. Can a DSM and GA accurately predict HR max by measuring HR data and exercise
intensity during a submaximal treadmill walking test?
RQ2. Can a DSM and GA accurately predict HR max by measuring HR data and exercise
intensity during a submaximal treadmill running test?
RQ3. Can a DSM and GA accurately predict VO2 max by measuring VO2 data and exercise
intensity during a submaximal treadmill walking test?
RQ4. Can a DSM and GA accurately predict VO2 max by measuring VO2 data and exercise
intensity during a submaximal treadmill running test?
RQ5. Can a DSM, ANN, and GA accurately predict VO2 max by measuring HR data and
exercise intensity during a submaximal treadmill walking test?
RQ6. Can a DSM, ANN, and GA accurately predict VO2 max by measuring HR data and
exercise intensity during a submaximal treadmill running test?
Hypotheses
H1. A DSM and GA can accurately predict HR max by measuring HR data and exercise intensity
during a submaximal treadmill walking test.
H2. A DSM and GA can accurately predict HR max by measuring HR data and exercise intensity
H3. A DSM and GA can accurately predict VO2 max by measuring VO2 data and exercise
intensity during a submaximal treadmill walking test.
H4. A DSM and GA can accurately predict VO2 max by measuring VO2 data and exercise
intensity during a submaximal treadmill running test.
H5. A DSM, ANN, and GA can accurately predict VO2 max by measuring HR data and exercise
intensity during a submaximal treadmill walking test.
H6. A DSM, ANN, and GA can accurately predict VO2 max by measuring HR data and exercise
intensity during a submaximal treadmill running test.
Operational Definitions
• Regularly Active: Classified as participating in regular physical activity at least 3 days per week for 30 minutes.
• Familiarization: Session that occurs two days prior to the testing session in order to familiarize the subjects with protocols being implemented and equipment being used. • Learning Effect: Phenomenon that occurs after the initial testing session; i.e., subjects know
what to expect the second time and greater changes are observed.
• Submaximal: Describes an exercise intensity where VO2 remains below VO2 max.
• VO2: Volume of oxygen consumed.
• VO2 max: Maximal volume of oxygen consumed.
• VO2 max determination criteria: A subject’s maximum rate of oxygen uptake during a
graded exercise test that meets 3 of the 5 following criteria: (1) plateau of ≤ 0.15 L⋅min-1; (2)
• VO2 peak: A subject’s highest volume of oxygen consumption attained during a graded
CPET.
• Dynamical System Model: A mathematical model used to predict physical occurrences that change over time. For current applications, the dynamical system is predictive, meaning it can predict future observations by examining past and present states of the system.
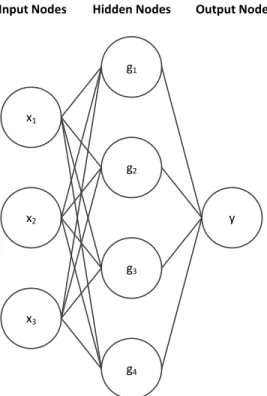
• Artificial Neural Network: A computational model designed to mimic neurons in the human brain, where inputs interact with one another along with hidden neurons to provide outputs. ANNs need to be trained using inputs with known outputs to establish connections that allow future outputs to be generated from inputs alone.
• Genetic Algorithm: A mathematical procedure designed to explore a search space and find near-optimal solutions using natural selection-inspired operations such as mutation,
crossover, and selection.
Delimitations
• All subjects were regularly-active males between 18-35 years of age who exercise for at least 30 minutes, 3 days per week.
• All subjects were familiarized with facilities, exercises, and testing protocols being used prior to taking baseline measurements in order to reduce the learning effect.
• All subjects were recruited from the central North Carolina area via email and face to face contact.
• All subjects followed appropriate pre-testing guidelines prior to each testing session (see appendix A).
Assumptions
• All subjects strictly followed the pre-assessment guidelines prior to testing sessions. • All subjects gave their maximal effort during VO2 max testing sessions.
• All subjects avoided intentional alterations in breathing during VO2 measurements.
• All subjects honestly reported medical history, activity levels, RPE, and any discomfort that occurs throughout the study.
Limitations
• The results of this study may only apply to healthy subjects with a normal heart rate response during exercise.
• The generalizability of this study may only apply to healthy, regularly active males between the ages of 18-35.
• It is possible that subjects did not adhere to pre-assessment guidelines entirely as researchers were not with them during the hours prior to testing.
• Subjectivity to the smoothing coefficients, parameter estimation bounds, initial guesses, mutation coefficients, and convergence criteria.
Significance of the Study
This study was designed to validate a novel method for predicting HR max and VO2 max
specific nature of physiological responses during exercise testing for the prediction of HR max and VO2 max. The model used in this study accounted for these factors and was also based on
time series rather than steady-state measurements. This allows real-time estimates of VO2
without requiring steady state exercise or a specific protocol. As long as the inputs include exercise intensity and heart rate, VO2 can be predicted during any arbitrary protocol of varied
exercise intensities. Potentially, accurate predictions of VO2 max can also be made using data
from a submaximal exercise effort.
The ability to accurately predict HR max and VO2 max without directly measuring VO2
data has numerous implications for both athletes and clinical populations. Accurately assessing an individual’s CRF may be possible without the equipment, expense, and effort of a traditional CPET. This would allow more frequent evaluations of an athlete’s physical fitness to see how their body is adapting over time due to exercise training. Real-time VO2 predictions could be
incorporated into fitness watches, improving exercise prescription and providing feedback during training. This model would also be helpful for clinicians to see how their patients are progressing due to pathologies or exercise interventions without a maximal CPET. VO2 max is a critical
measurement that has been given a lot of attention in the field of exercise physiology. An accurate method of estimating VO2 max without measuring VO2 data would make it highly
CHAPTER II
REVIEW OF LITERATURE
For organizational purposes, Chapter II was divided into the following sections:
SECTION I. Cardiorespiratory fitness and the oxygen cascade. SECTION II. Maximal oxygen uptake. SECTION III. Submaximal prediction tests. SECTION IV. Non-exercise equations. SECTION V. Dynamical system modeling.
Cardiorespiratory fitness and the oxygen cascade
Cardiorespiratory fitness (CRF) is the single greatest predictor of all-cause mortality and the development of chronic diseases1–6. Specifically, CRF refers to the ability of the
cardiovascular and respiratory systems to supply oxygen to the skeletal muscles during exercise16. Another term used to describe this pathway is the oxygen cascade.
Oxygen Cascade
measuring the amount of oxygen utilized during a maximal CPET. This measure of CRF is commonly called maximal oxygen uptake (VO2 max).
Maximal Oxygen Uptake
VO2 max is defined as the volume of oxygen consumed during maximal exercise7. An
individual’s VO2 max is determined by the functional capacity of the oxygen cascade to utilize
oxygen and remove metabolic waste. It has become the standard measure of CRF and the functional limit of an individual’s aerobic capacity17. VO
2 max was originally conceptualized by
Hill et al. and Herbst et al. in the 1920’s, who observed that there was a limit to the body’s ability to consume oxygen7. Today, this is widely accepted and VO
2 max is commonly reported
as a physiological characteristic like height, weight, or age17.
Measurement of VO2 max
The gold standard measurement of VO2 max is done via indirectly calorimetry by
measuring gas exchange with a metabolic cart during a maximal graded exercise test (GXT)18–20.
One of the most widely used protocols for measuring VO2 max is the Bruce treadmill protocol,
which takes subjects through increasingly difficult stages until volitional exertion. Although VO2
max is a critical marker of functional ability and cardiovascular health, it is rarely assessed in the general public. VO2 max assessment requires expensive equipment, trained technicians, and an
all-out effort from participants.
Since it is an indirect measurement, there is inherent error in the assessment of VO2 max.
The six variables directly measured are minute ventilation, O2 faction, CO2 fraction, barometric
repeated measurements on a subject exercising at a steady state7,17,21. Additionally, there is controversy surrounding the criteria for determining an individual’s true VO2 max value.
Criteria for Determining VO2 max
Originally, a plateau in VO2 was the criteria for determining whether or not an individual
reached VO2 max. Although a plateau in VO2 is a good indicator, this plateau is not seen in all
individuals7,17. Therefore, secondary criteria have been considered to determine whether or not max is reached. Typically, determination of whether an individual reached VO2 max requires 3
of the 5 following criteria: (1) plateau of ≤ 0.15 L⋅min-1; (2) respiratory exchange ratio (RER) >
1.15 (3) blood lactate concentration ≥ 8 mmol⋅L-1; (4) RPE > 18; (5) HR within 10bpm of
predicted HR max. Significant debate over all of these criteria exists14,17. An RER > 1.15 and blood lactate concentration ≥ 8 mmol⋅L-1 both indicate than a subject is relying heavily on
anaerobic metabolism and may have reached VO2 max. However, these criteria are not
universally met, even in individuals who reach a plateau in VO217. Reaching HR max may be a
good indicator of a maximal test, but the “220-Age” equation is known to have an error of up to 12 bpm11,11,12. Finally, RPE is a highly subjective measure and it is important to note participant motivation can have a large impact on the VO2 max value derived from a GXT17,18.
Limiting Factors of VO2 max
Since the oxygen cascade is a multi-step pathway, VO2 max can be limited by whichever
step is the rate-limiting factor. In healthy individuals exercising at sea level, pulmonary function does not appear to be the limiting factor for VO2 max, as arterial O2 saturation in the blood
delivery or oxygen extraction in the skeletal muscle7. Oxygen delivery includes cardiac output (HR x stroke volume) and oxygen carrying capacity and oxygen extraction is explained by arterial-venous oxygen difference (a-vO2 difference)7. According to Basset and Howley, almost
all of the oxygen in the blood extracted during maximal exercise, so it is unlikely that a-vO2
difference the limiting factor in healthy individuals7. Thus, it is probable that an increase in
blood flow (or oxygen delivery) is the limiting factor in healthy individuals7. It is known that stroke volume increases with training and that blood doping, a practice that increases the oxygen carrying capacity of the blood, both increase VO2 max7. Therefore, it is likely that an increase in
oxygen delivery is the main limiting factor of VO2 max in healthy individuals7,22. It is important
to mention brain regulation of motor unit recruitment may also play a role in maximal exercise capacity14. However, more research is needed in this area.
Submaximal Prediction Tests
As previously stated, the measurement of VO2 max is expensive and impractical. There
are field tests to estimate VO2 max, but they still make numerous assumptions and require the
participant to give an all-out effort19. Due to its relevance, a great deal of effort has been put into finding ways to accurately estimate VO2 max without performing a maximal CPET. Generally,
submaximal CPETs require participants to be at steady state during a certain stage9. Based on
their heart rate at that level, predictions are made as to what that person’s VO2 would be at their
HR max. The current submaximal methods of estimating VO2 max can be broken up into three
Submaximal Cycling and Step Tests
Submaximal cycling and step tests are frequently used to estimate an individual’s CRF level. For reference, Akalan at al. (2008) created a summary table of submaximal exercise tests9.
Unfortunately, most of the predictions in the literature do not present cross-validation results and several have poor correlation coefficients (R) or high values of the standard error of the estimate (SEE)23. Additionally, many of them were developed using age/sex specific populations. A few of the most commonly used and widely validated include the YMCA bike test and the Astrand bike test. Commonly used step tests include the YCMA step test and the Queens College Step test.
Submaximal Treadmill Tests
It is known that cycle ergometers and treadmills produce different VO2 max values, with
treadmills producing higher values due to greater motor unit recruitment24. Therefore,
submaximal treadmill tests have been created as an attempt to more accurately predict VO2 max.
For reference, Akalan at al. (2008) created a summary table of submaximal treadmill tests9.
Unfortunately, few treadmill protocols have been widely validated9. One of the most accepted walking protocols is the single-stage treadmill test25. It has been validated for males and females from 20-59 years of age (R = 0.86, SEE = 5.0)9. While the correlation is strong, the SEE is rather
high, likely due to assumptions used in the estimation equation.
Assumptions of Submaximal Exercise Tests
Submaximal exercise tests make a variety of assumptions to predict VO2 max. One key
factors like biomechanical efficiency, genetics, and training effects9,21. Submaximal tests typically assume that steady state HR is reached at each workload. Another assumption is that HR and VO2 are linear, which is known not to be true26. It is true that HR and VO2 are
intrinsically related. However, tests that use only heart rate in their prediction model tend to underestimate VO2 max due to the asymptotic rather than linear relationship between HR and
VO226.
Perhaps the most crucial assumption and source of error is the ubiquitous “220-age” equation for HR max. It is true that HR declines with age11. However, age-based regression
equations like “220-age” typically have an SEE exceeding 10 bpm. While this equation
represents a general trend for an entire population, it has poor accuracy for determining the HR max of an individual. HR is influenced by a variety of factors including genetics, and the response to given exercise intensities vary from person to person26. Additionally, these tests assume that there is a linear rise in VO2 with an increase in workload, which is not to be untrue,
especially above lactate threshold27. As a whole, submaximal exercise tests fail to take into account the non-linear nature of VO2 dynamics and the inter-individual variation in physiology.
Non-exercise Equations
For practicality and ease of measurement, various groups have attempted to estimate VO2
max without an exercise bout. These equations are useful in certain situations because they provide a rough estimate of VO2 without any exercise bout. However, they do not provide
questionnaire to estimate VO2 max29. George et al. improved this model by adding a Perceived
Functional Ability (PFA) questionnaire28. While the non-exercise equation does surprisingly well for an entire population, its reliability for accurately predicting a specific individual’s VO2 max
is questionable.
Like the submaximal tests, regression equations make a lot of assumptions about the linearity of the relationships between VO2 max, heart rate, age, mass, etc. However, as
previously stated, these relationships are known to be non-linear10,30. Both non-exercise
equations and submaximal exercise tests fail to take into account the non-linearity of VO2, along with the person-specific nature of physiology. In an attempt to account for these factors, new attention has been given to DSMs for estimating VO2 max.
Dynamical System Modeling
Prior studies have used dynamical system mathematical models to predict HR and VO2
responses8,13,31,32. These models are able to capture the inter-individual differences in human physiology and account for with the non-linearity of HR and VO2 responses during exercise8.
Recently, Mazzoleni et al. developed a model that is able to accurately predict HR and VO2
responses during a submaximal bout of cycling using power and cadence as indicators of exercise intensity8. Mazzzoleni developed this model based on the previous work by Sitrling et
al8,31,32. Stirling et al.’s original model required steady state to predict the model parameters and did not include a term to account for the delay in HR and VO2 changes in response to the
utilizing the concepts of inheritance, selection, crossover, and mutation. Using a GA along with a DSM allows the estimation of HR max and VO2 max.
This new model, which combines a DSM and a GA, offers more accuracy in predicting VO2 max than current submaximal exercise tests that use linear mathematical models8.
Validating this model for treadmill walking and running would be useful as treadmill tests tend to produce higher VO2 max values than cycling tests7,14. Additionally, walking is a comfortable,
widely accessible form of exercise. This model would also allow VO2 to be estimated at any time
point, without the need for a specific protocol or achievement of steady-state exercise15. The
ability to have real-time estimations of VO2 during exercise and the ability to accurately predict
VO2 max based on a submaximal effort both have numerous applications for exercise
prescription and the evaluation of CRF. Accurate prediction of HR max would be useful for exercise prescription and HR training zones. One limitation of this model is that it still requires the measurement of VO2 data using a metabolic cart. However, this limitation can be addressed
with the application of an ANN.
Artificial Neural Networks
Figure 1. Artificial Neural Network Diagram
Recently, Beltrame et al. (2016), utilized an ANN technique to estimate VO2 during
treadmill exercise using HR and other easy-to-obtain inputs like speed, grade, and body mass13. Applying an ANN to the DSM used by Mazzoleni would allow VO2 max to be accurately
predicted without the need to measure VO2 data13,15. This model would make real-time VO2
estimations and the assessment of VO2 max possible in a variety of settings such as a hospitals,
clinics, or athletic facilities using only a heart rate monitor and measure of exercise intensity (eg. Running watch or treadmill).
x1
x2
x3
g2
g3
g4
g1
CHAPTER III
METHODOLOGY Subjects
Twenty subjects were recruited to participate in this study. Recruitment for the study was completely voluntary; subjects were made aware of the project via flyers, emails, phone calls, and face-to-face interaction with research team members. Recruitment sites included areas that fall within that of central North Carolina. Approval from the Institutional Review Boards in Exercise and Sport Science and School of Medicine (Biomedical) at UNC-Chapel Hill was obtained before commencing with the recruitment of subjects.
All subjects participating in the study were regularly active males between the ages of 18 and 35. The regularly active nature of the subjects was determined by participation in exercise for at least 30 minutes 3 days per week. Subjects were considered healthy, classified as low-risk for maximal exercise testing based on guidelines set forth by the American College of Sports Medicine (ACSM)34, and not taking any medications that could alter their HR or VO2 responses.
Study Design
Below is a brief overview of each visit the subjects attended throughout the course of the study. Visit one included physical screening, medical history forms, and physical activity
questionnaires. Visit two included the full Bruce protocol for assessment of VO2 max. The third and final visit took place within one week of the second visit, following at least 48 hours of rest. The third visit consisted of three separate submaximal treadmill exercise tests that lasted
approximately 10 minutes each. The first was the single-stage treadmill test developed by Ebbeling et al. (1991), the second was a submaximal walking protocol, and the third was a submaximal running protocol25. The second and third submaximal testing protocols consisted of stages varying intensities from 40- 85% of each subject’s measured VO2 max. Collectively, the
three submaximal testing protocols lasted approximately 28 minutes (including warm up and cool down time). There were 5 minutes of rest between each test. Figure 1 provides a visual timeline of the visits described above.
Figure 2. Study Timeline
Visit 1
•Informed Consent •Medical History •Physician Clearance •Questionnaires
Visit 2
•VO2 max Assessment
Visit 3
•Single-stage submaximal treadmill test
Instrumentation
Anthropometric / Screening
Height was measured to the nearest 0.1 cm via a Portable stadiometer (Perspective Enterprises, Portage, MI USA), and mass was measured to the nearest 0.1 kg via a mechanical scale (Detecto, Webb City, MO USA). A medical history questionnaire (Department of Exercise and Sports Science) was used to log the subjects’ medical history, age, race, and relative physical activity level within the past year. This was utilized in conjunction with the physical
examination, Physical Activity Readiness Questionnaire (PAR-Q), and resting ECG to determine the subject’s ability to participate in the study. The resting ECG was accomplished with a GE CASE Cardiosoft V. 6.6 ECG diagnostic system (General Electric, Palatine, IL USA). Blood pressure was measured manually by auscultation via a Diagnostix 700 aneroid
sphygmomanometer (American Diagnostics Corporation, Hauppauge, NY USA) and a Litmann stethoscope (3m, St. Paul, MN USA). Physical Activity Rating (PA-R) and Perceived Functional Ability (PFA) questionnaires were completed for use in the non-exercise equations to estimate VO2 max 28,29.
Cardiopulmonary
VO2 max and submaximal VO2 data were measured with a Parvo Medics TrueMax 2400
Metabolic System (Parvo Medics, Salt Lake City, UT USA) on a GE CASE T-2100 Treadmill Exercise Testing System (General Electric, Palatine, IL USA). Rate of perceived exertion (RPE) was assessed via a Borg 6-20 Rate of Perceived Exertion (RPE) scale35. Heart rate was
was assessed using a Lactate Plus handheld analyzer (Sports Resource Group, Hawthrone, NY USA).
Procedures
All subjects reported to the Exercise Oncology Research Laboratory (EORL) on a total of three separate occasions for screening and testing purposes. All subjects within the study were required to undergo a physical screening by a physician in accordance with a 12-lead ECG, medical history questionnaire, and PAR-Q form. Before reporting for testing sessions, subjects were required to follow a set of pre-assessment guidelines. Prior to testing, all subjects gave verbal confirmation that the pre-assessment guidelines were followed. These guidelines included maintaining a proper hydration status as assessed by an American Optical, Hand Held TS Meter (Keene, New Hampshire, USA) refractometer, being at least two hours fasted, refraining from caffeine consumption for at least eight hours prior, refraining from exercise for at least 24 hours prior to testing, and refraining from alcohol consumption for at least twenty-four hours prior to any testing (Appendix A).
Visit One: Physical Screening & Questionnaires
research team. Height and weight measurements were taken along with resting HR and blood pressure (BP).
Visit Two: Maximal CPET
Visit two consisted of a maximal CPET on the treadmill, following the procedures of the Bruce protocol (Appendix F). Each subject began by standing quietly on the treadmill for three minutes while the researchers collect resting metabolic and HR data. Once the test began, the subject walked/ran as the treadmill speed and incline increased every three minutes. HR and RPE (6-20) were continually monitored and recorded during the last 30 seconds of every stage
(Appendix G). Termination of the test was determined by the subjects’ reaching volitional exhaustion or a plateau or decrease in VO2 with an increase in exercise intensity. At the end of
the test, the subjects rested for 3 minutes; blood lactate was then analyzed. After the blood lactate collection, subject’s vital measurements (HR, BP) were checked. If heart rate had dropped below 100 bpm and blood pressures returned to baseline values, subjects were cleared to leave the laboratory. In between visits two and three, subjects were asked to refrain from strenuous exercise.
VO2 max was determined using the following criteria: (1) plateau of ≤ 0.15 L⋅min-1 with
increase of exercise intensity in the last stages of the test; (2) respiratory exchange ratio (RER) > 1.15 (3) blood lactate concentration ≥ 8 mmol⋅L-1; (4) RPE ≥ 18; (5) HR within 10 bpm of
predicted HR max34. If three of these five criteria were not met, the measurement was considered a VO2 peak and not a VO2 max. An expanded discussion of the criteria for determining VO2 max
averaging the three highest values obtained during the last minute of the test (after 8-breath average data smoothing).
Visit Three: Submaximal CPETs
After at least 48 hours of rest, but within one week of the maximal CPET, subjects returned to the EORL for submaximal testing. Each subject began by completing the 8-minute single-stage treadmill test, which consisted of a four-minute warmup and four-minutes at a 5% grade25 (Appendix I). At the end of the protocol, subjects rested for five minutes before
beginning the submaximal walking protocol. During this time, the VO2 metabolic cart was set up
to collect breath-by-breath measurements. Next, subjects completed the submaximal walking protocol (Appendix G), consisting of a one-minute warm up, three one-minute hard stages interspersed with two-minute easy stages, and a one-minute standing cooldown. Subjects then rested for three minutes before beginning the submaximal running protocol. The running protocol also consisted of a warm up, three difficult stages interspersed with easy stages, and a cool down (Appendix G). Subjects maintained a jog throughout the entire running protocol (ie. they will not be allowed to walk). HR, VO2, and exercise intensity (eg. speed, grade) data were
measured continuously throughout the test. RPE was recorded at the end of the hard stages.
Data Analysis
Data Processing
breath by breath intervals and then linearly interpolated at 1 Hz to match the HR, speed, and grade data. After interpolation, the VO2 data was smoothed using cubic smoothing splines to
allow the calculation of a numerical derivative. Optimal smoothing criteria were based on mutual information techniques37. The original VO2 data was also sampled using 8-breath averaging
technique for plotting purposes38.
Dynamical System Model
The following differential equation was used to model HR and VO2 responses:
where A, α, β, and λ are constants related to an individual’s physiology and fitness. Although the model form is the same, the corresponding parameter values differ depending on whether HR or VO2 is being analyzed. D refers to the demand for HR or VO2 as a function of time and exercise
intensity:
where B is a constant and is the exercise intensity function: . Without knowing anything about the exercise intensity function, it is possible to obtain an approximation using a second order Taylor series expansion,
where C0 – C5 are constants related to an individual’s physiology and fitness.
Mazzoleni et al. addressed this concern by adding a delay term and two state-equations that do not require the subject to be at steady state8.
Genetic Algorithm
A GA was used in conjunction with the DSM to estimate HR max and VO2 max, along
with all of the other model parameters (A, α, Co, etc.). During this process, time series
predictions for HR and VO2 were also produced. In other words, VO2 was estimated at every
given point in time based on the exercise intensity and person-specific parameters. The GA used a population size of 120 and generation limit of 1,000. It was run 20 times to reduce the risk of obtaining a false result. It also employed a tournament selection scheme, a BLX-α crossover scheme, and a Gaussian mutation scheme. The demand function was solved numerically and constraints were placed on the parameters to prevent solutions from becoming imaginary or physiologically invalid.
Neural Network
After initial data processing, an ANN was trained using five inputs (HR, the time
derivative of HR, speed, grade, and mass) and one target variable (VO2). Prior to initializing, the
Statistical Analysis
Collected data for this current study were analyzed with SPSS Statistics version 20.0 (SPSS Inc., Chicago, IL USA) and MATLAB version R2017b (MathWorks, Natick, MA USA).
The alpha level was set a priori for all statistical analyses at 0.05.
Descriptive Statistics
Descriptive statistics were calculated in order to exhibit the study population
characteristics (age, height, body mass, etc.). Descriptive statistics were also calculated for the
HR max and VO2 max estimations from the DSM, as well as for the VO2 max predictions from
the ANN, non-exercise equations (Appendix I), single-stage treadmill test, and Bruce protocol
estimation equation.
Line of Identity Analyses
The accuracy of model predictions was evaluated against the true values obtained from
the CPET by calculating the coefficient of determination (R2) and standard error of the estimate (SEE). All of the R2 and SEE values were calculated from line of identity analyses. This is
because the purpose at hand is prediction of physiological metrics. Rather than looking at the
relationship between two variables (standard linear regression), we want to see the predictive
power of the models. Therefore, it is possible for the R2 to be negative, indicating that a fixed
line at the mean of the data would be a better fit than the model being evaluated.
the time series predictions versus the experimental measurements were evaluated for each
participant by calculating the R2 value and SEE for: (1) the DSM-GA estimate of HR; (2) the DSM-GA estimate of VO2; and (3) the ANN prediction of VO2. The accuracy of the maximal
predictions versus the experimental measurements were evaluated for each participant by
calculating the R2 value and SEE for: (1) the DSM-GA estimate of HR max; (2) the DSM-GA
estimate of VO2 max; and (3) the ANN prediction of VO2 max. The accuracy of the trained ANN
was evaluated by calculating the R2 value and SEE. The accuracy of the single-stage treadmill test, Jackson non-exercise equation, George non-exercise equation, 220 – age equation, and 208
– (0.7 x age) were evaluated by calculating the R2 value and SEE. The DSM-GA estimates of HR max were compared to measured values of HR max using a dependent samples t-test. The DSM-GA estimates of VO2 max were compared to measured values of VO2 max using a
CHAPTER IV
RESULTS Subjects
Twenty-six subjects were recruited to participate in the study. Twenty-four of the subjects met the previously mentioned criteria for determination of VO2 max. One subject was
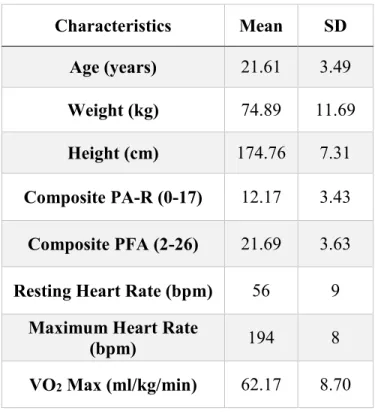
significantly less fit than the rest, making the running test nearly maximal and therefore, this subject was excluded and analyses were performed on the remaining 23 subjects. Subjects characteristics are depicted as means and standard deviations in Table 1.
Table 1. Subject Characteristics
Characteristics Mean SD
Age (years) 21.61 3.49
Weight (kg) 74.89 11.69 Height (cm) 174.76 7.31 Composite PA-R (0-17) 12.17 3.43 Composite PFA (2-26) 21.69 3.63 Resting Heart Rate (bpm) 56 9
Maximum Heart Rate
(bpm) 194 8
DYNAMICAL SYSTEM MODEL & GENETIC ALGORITHM
Heart Rate & Oxygen Uptake Kinetics
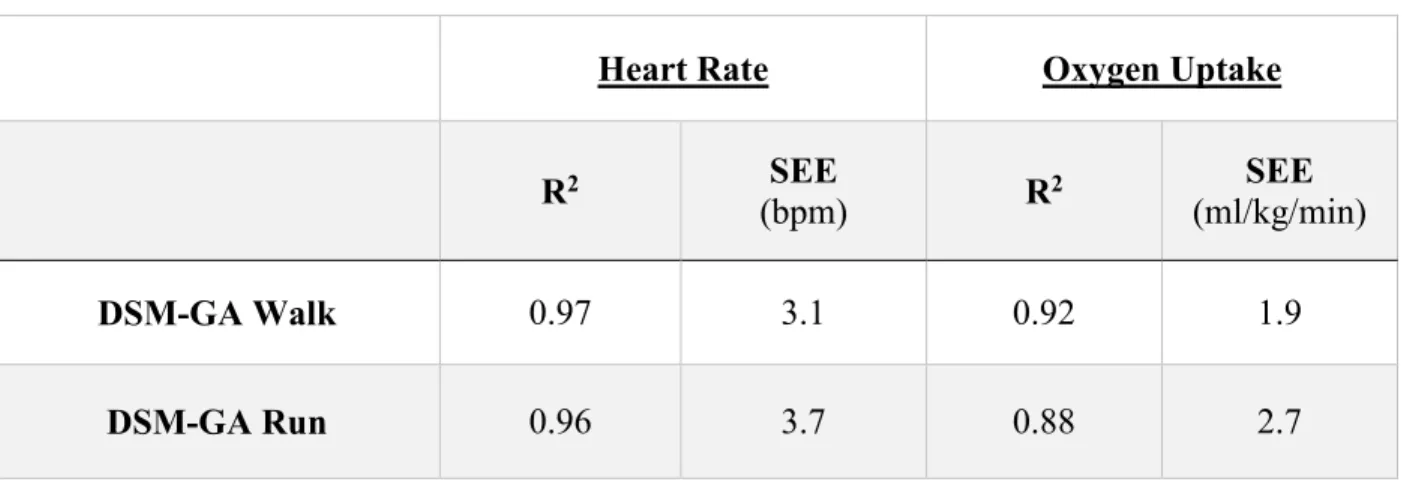
To assess the accuracy of the model for predicting HR and VO2 kinetics, R2 and SEE
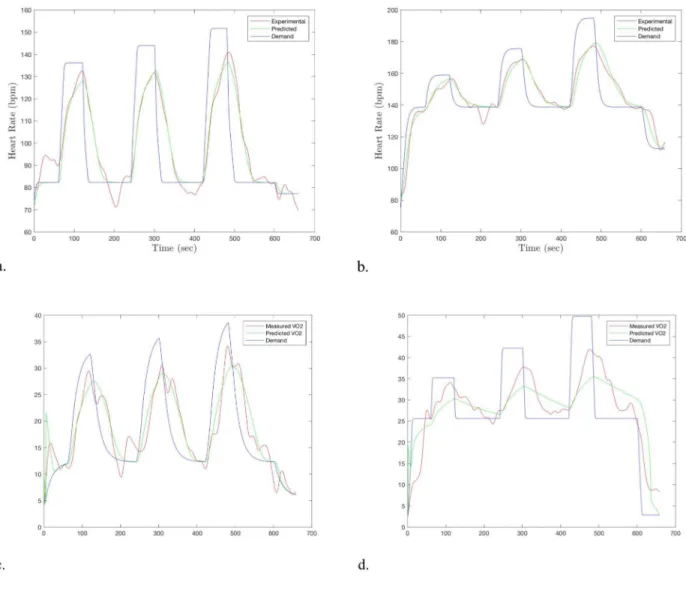
were calculated. The time series predictions were highly correlated with the experimental values for HR and VO2 for both walking (Table 2). Figure 3 provides an example time series plot of
the predictions for (a) walking HR (b) walking VO2, (c) running HR, and (d) running VO2.
Table 2. HR and VO2 time series prediction accuracy for walking and running
Heart Rate Oxygen Uptake
R2 SEE
(bpm) R
2 SEE
(ml/kg/min)
DSM-GA Walk 0.97 3.1 0.92 1.9
Figure 3. Example time series plot for (a) walking HR (b) running HR, (c) walking VO2, and (d)
Maximum Heart Rate Estimations
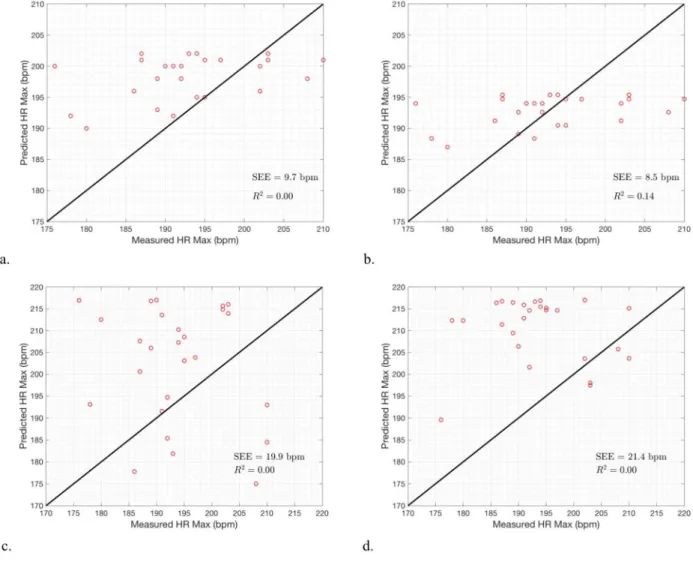
The model was used to estimate HR max from submaximal data for the walk test and run test separately. The accuracy of the model was compared to traditional equations used to
estimate HR max. The results can be seen in Table 3.
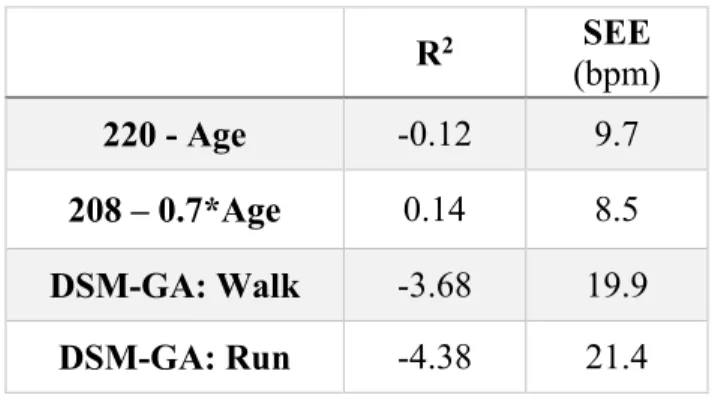
Table 3. Comparison of HR max estimations
R2 SEE
(bpm)
220 - Age -0.12 9.7
208 – 0.7*Age 0.14 8.5
DSM-GA: Walk -3.68 19.9
DSM-GA: Run -4.38 21.4
Dependent samples t-tests were used to determine if each HR max estimation significantly differed from the measured value. The mean from the model estimation was
VO2 Max Estimations
The model was used to estimate VO2 max from submaximal VO2 data for the walk test
and run test separately. The accuracy of the model was compared to the Ebbeling single-stage treadmill test, the Jackson and George non-exercise equations, and the maximal Bruce protocol equation. The results can be seen in Table 4.
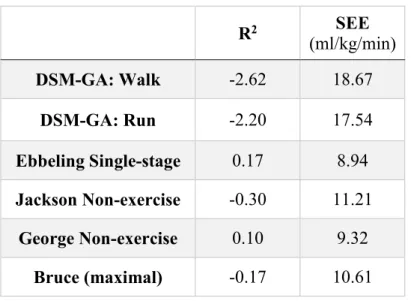
Table 4. Comparison of VO2 max estimations
R2 SEE
(ml/kg/min)
DSM-GA: Walk -2.62 18.67
DSM-GA: Run -2.20 17.54
Ebbeling Single-stage 0.17 8.94 Jackson Non-exercise -0.30 11.21
George Non-exercise 0.10 9.32
Bruce (maximal) -0.17 10.61
Dependent samples t-tests were used to determine if each VO2 max estimation
significantly differed from the measured value. The model estimates were significantly different from the experimental measures for both walking (p < 0.001) and running (p < 0.001). The VO2
max estimations were significantly different than the true VO2 max values for the Jackson (p <
0.001) and George (p < 0.001) equation. The Bruce equation was also significantly different than the measured value (p < 0.001). The Ebbeling single-stage treadmill test was not significantly different than the measured VO2 max mean (p = 0.41). Line of identity plots for each of the
Figure 5. Line of identity plots comparing the VO2 max predictions to the experimental values
ARTIFICIAL NEURAL NETWORK
The accuracy of an ANN is influenced by the number of hidden neurons. Increasing the number of hidden neurons improves the accuracy of the model, but can lead to overfitting the data, consequently reducing its generalizability. Previous studies by Mazzoleni et al. observed diminished returns in accuracy beyond 20 hidden neurons for HR/VO2 applications8,36.
Therefore, this was selected for the final ANN.
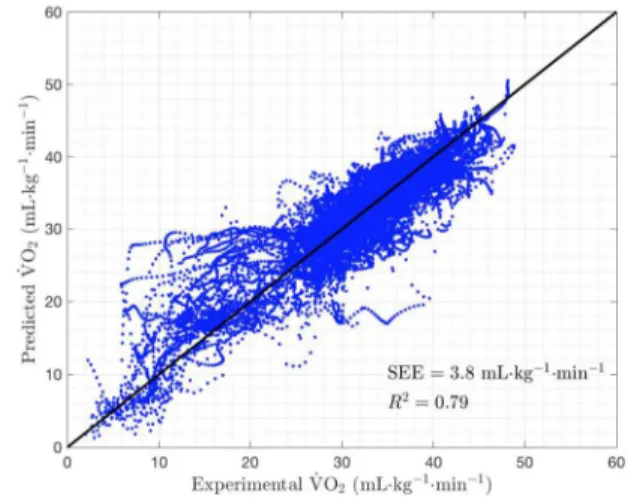
Time Series Predictions
The time series predictions from the ANN were highly correlated with the experimental VO2 for both walking (R2 = 0.79, SEE = 3.4 ml/kg/min) and running (R2 = 0.79, SEE = 3.8
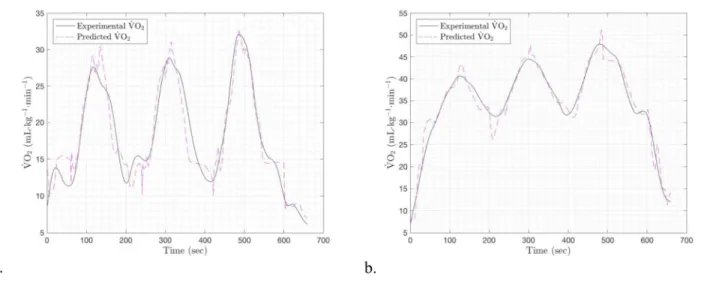
ml/kg/min). The line of identity plots for (a) walking and (b) running can be seen in Figure 6. Figure 7 provides an example time series plot for one subject’s VO2 prediction for (a) walking
Figure 6. Line of identity plot comparing the ANN VO2 prediction to the experimental values
for (a) walking and (b) running
Figure 7. Example time series plot of the ANN’s VO2 prediction for (a) walking and (b) running.
VO2 Max Predictions
The time series predictions from the ANN were used as VO2 inputs for the DSM-GA,
yielded estimations of VO2 max with only the measurement of HR data and exercise intensity. The
VO2 max estimates were poorly correlated with the experimental data from the CPET for both
walking (R2 = -4.31, SEE = 22.6 ml/kg/min) and running (R2 = 5.40, SEE = 24.8 ml/kg/min). Figure 8 depicts the line of identity analysis for the VO2 max estimations from the ANN used in
Figure 8. Line of identity plots comparing the VO2 max predictions using data from the ANN to
CHAPTER V
DISCUSSION
Traditional methods for VO2 max prediction based on submaximal exercise bouts were
dependent on linear systems and physiological assumptions9,11,21,26,27. Early studies by Akalan et
al. and Jamnick et al. began to address these issues by eliminating age-based equations or
assumptions of linearity9,40. Mazzoleni et al. continued this progression, developing a cycling
model to eliminate both of these assumptions8,36. By using a dynamical demand function, it had
the adaptability necessary for precise evaluation of cardiopulmonary function. This type of
model performs best when given a dynamic protocol involving both on and off oxygen kinetics
(ie. periods of increased workload and periods of decreased workload or rest). The present study
built upon the work of Mazzoleni et al., attempting to develop a model for treadmill walking and
running. The purpose of this study was to evaluate the accuracy of a DSM and GA for predicting HR max and VO2 max, as well as VO2 kinetics during walking and running at varied intensities.
The secondary purpose of this study was to predict VO2 kinetics and VO2 max using HR and
exercise intensity data by incorporating an ANN into the model.
VO2 Max
someone has reached their maximum, a plateau is not seen in all individuals7,17. Therefore, determination of whether an individual reached VO2 max requires 3 of the 5 following criteria:
(1) plateau of ≤ 0.15 L⋅min-1; (2) respiratory exchange ratio (RER) > 1.15 (3) blood lactate
concentration ≥ 8 mmol⋅L-1; (4) RPE > 18; (5) HR within 10bpm of predicted HR max.
Significant debate over all of these criteria exists14,17. In the present study, only seven of the 26 subjects exhibited an RER > 1.15. These seven subjects had low VO2 max values (M = 51.43,
SD = 6.91) compared to the overall subject pool (M = 61.32, SD = 9.61). This makes sense, as someone who is less aerobically trained and/or less fit would be forced to rely more heavily on anaerobic metabolism in order to meet the metabolic demand. Every subject had lactate
concentrations in excess of the criteria ( ≥ 8 mmol⋅L-1 [M = 13.79, SD = 2.35]). Twenty-two out
of 26 subjects came within 10 bpm of their predicted maximum heart rate, as determined by the “220-Age” equation. It is worth noting that 10 bpm is a rather arbitrary number, and points out the inaccuracy of such equations. Twenty-four out of the 26 subjects had an RPE of 18 or higher, while two had an RPE of 17 (M = 18.73, SD = 0.72). However, RPE is a highly subjective measure and it can be difficult to assess RPE right at the end of a maximal effort17,18.
The current study utilized the Bruce protocol because it is one of the most widely accepted treadmill protocols for VO2 max assessment and it is known to elicit increased muscle
Another issue related to the determination of VO2 max is the data averaging technique
utilized38,44. VO2 data has a lot of noise because it is an indirect measurement with great
variability from breath to breath. The goal of data averaging is to minimize noise and differentiate high VO2 values due to inherent variability from those due to physiological
increases in VO2. However, over-smoothing can lead to underestimation of VO2 responses and
VO2 max. Meyers et al. found that averages from single-breath to 60-second averaging can
impact VO2 measures by 20%45. Regardless of technique and rationale, exercise physiologists
need to begin stating their methodology to allow comparison. Based on prior evidence from Robergs et al. and Astorino et al., the following method was used in the present study for the determination of VO2 max. VO2 data was exported in the 8-breath average format from the
metabolic cart. VO2 max was calculated by taking the average of the three highest measures
obtained during the last minute of the test.
Time Series Predictions (HR & VO2 kinetics)
Dynamical System Model & Genetic Algorithm
In terms of fitting the data, the model tracked HR and VO2 responses quite well. As
anticipated, the predictions were more accurate for walking (HR: R2 = 0.97 ± 0.03, SEE = 3.1 ± 0.3 bpm; VO2: R2 = .92 ± 0.07, SEE = 1.9 ± 1.2 ml/kg/min) than for running (HR: R2 = 0.96 ±
0.03 , SEE = 3.7 ± 0.5 bpm ; VO2: R2 = .88 ± 0.10, SEE = 2.7 ± 1.8 ml/kg/min). One potential
providing the model with inputs across a wide range of intensities. On the contrary, running has a
narrow window. In order to maintain a run, the speed must be kept above ~4.5 mph. In order for
the test to be submaximal, the speed needs to be kept at a reasonably slow pace. This means the
intensity will not fluctuate as drastically, as the minimum energy cost for running is still
somewhat high. As evidenced by the time series plots in Figure 3, the walk test had nice
transient peaks and valleys, whereas the running data had more noise and less variation.
Overall, the model was not as accurate as the previously tested cycling model developed
by our team, which was based on power and cadence8,36. One potential reason for this is the
biomechanical differences from person to person21,36. Another hindrance for the model in the
present study is that there were instances in multiple subjects where HR and VO2 increased
without an increase in exercise intensity. One potential reason for this that may not be accounted
for in the model is the braking phenomenon on a treadmill that is decelerating. Going from the
higher to lower intensites during the protocol, the subjects were forced to expend energy in order
to slow down with the treadmill, potentially altering the physiological response during the
transition phase. Running on a treadmill is biomechanically different than running on the ground,
which could affect the applicability of the model46–48. Interestingly, in many of the data files, the
subjects’ HR increased around 200 seconds, which is one minute into the recovery stage.
Whether this is physiological or circumstantial is unclear. For instance, perhaps there is a
physiological overcompensation to the recovery workload due to an imbalance between venous
return and contractility. Or perhaps circumstances such as drying off with a towel or anticipating
the next stage had an impact on HR. This could be due to, among other things, psychological
differences in physiology and fitness without being given the information a priori. These
differences are captured in the model parameters, which are estimated with the GA. However,
perhaps the model at hand was not able to fully account for differences in biomechanics with the
given parameters and parameter bounds. There is subjectivity related to where the parameter
bounds are placed and the amount to which the GA is allowed to mutate.
It is crucial to mention that although the time series predictions are impressive, they may not represent real-world solutions. Currently, the genetic algorithm is not converging on proper values for resting HR/VO2 and HR/VO2 max, yet it is able to give alternative values for the other
parameters and still come up with a solution that has low residual error. This solution, though it has low error, represents an “artificial” solution that does not authentically depict physiological reality. Potential reasons for this will be discussed later.
Another weakness of using this method to predict VO2 responses is that it still requires
the measurement of VO2 data. This concern was addressed by the secondary purpose of this
study—to predict VO2 responses with HR and exercise intensity data using an ANN.
Artificial Neural Network
The ANN was able to accurately predict VO2 responses throughout both the walking (R2
= 0.79, SEE = 3.4 ml/kg/min) and running tests (R2 = 0.79, SEE = 3.8 ml/kg/min). The running
predictions were less accurate at lower intensities, where the model tended to overestimate VO2
concern for the ANN is that the current methods are overfitting the data. Additionally, the narrow demographics of the subject pool limit the generalizability of the results. Further analyses, testing, and validation are necessary to generalize these findings. However, these preliminary findings suggest that ANNs may be useful for estimation of VO2 using only heart
rate and exercise intensity as inputs.
HR Max Estimations
The typical equations for predicting HR max performed horrendously. As seen in Table
3, the ubiquitous “220 – age” equation would have been outperformed by a horizontal line at the
mean of the data. The “208 – .7*age” performed slightly better, explaining 14% of the variance
in HR max. Both of these equations had SEEs of ~9 bpm. Although non-exercise equations are
simple and work well for populations as a whole, they make assumptions based on age that
diminish their ability to accurately estimate a specific individual’s HR max. Non-linear
mathematical models can potentially provide greater accuracy by reducing these assumptions.
Unfortunately, the current model yielded inconsistent results for both walking (R2 =
-3.68, SEE = 19.9 bpm) and running (R2 = -4.38, SEE = 21.4 bpm) due to non-convergence. Rather than converging on an inaccurate result, it did not converge at all. Meaning, each time the
model is run, it gives a vastly different output for HR max. This major limitation will be
VO2 Max Estimations
VO2 max estimations from previously cited methods had a great degree of variability. As
seen in Table 4, even the best method, which involved an exercise bout, had a SEE of almost 9
ml/kg/min25. It is worth noting that these methods may have been particularly innacurate for the
subject pool in the present study most likely due to a narrow age range and exceptionally high
fitness. Regardless, the non-exercise equations, single-stage treadmill test, and Bruce equation
(an equation using data collected during the CPET) provided less than ideal estimates of VO2
max. Interestingly, the Bruce equation performed very poorly, despite the fact that it uses data
from a maximal bout.
Just as with HR, the current model gave inconsistent VO2 max predictions for both
walking and running.Although there is potential for a DSM to be used in conjunction with a
heuristic parameter estimation method to predict VO2 max, the current model has not been
optimized. When using predictions from the ANN, the accuracy decreased for walking and running which again, had poor results due to issues with the model. These issues will now be addressed. These predictinos were especially bad, as many of the predictions hit the upper bound
limit of 85 ml/kg/min (Figure 8).
Potential Issues
The current model is able to accurately predict HR/VO2 responses to varied exercise
intenisties, but not maximal values. Although it can fit the data quite well, it is doing so with
wrong for an individual, but the model can find alternative values for C0-C5 that allow the
prediction to fit the data rather well. Although this solution has low residual error, it does not
represent physiological reality since we know the HR values of the estimations are off.
One potential reason for this is that the model may still be missing a parameter. Perhaps
adding stride length, cadence, or acceleration to the model would improve its accuracy.
Biomechanical efficiency varies greatly from person to person, and the current model may be
unable to account for this. Another likely issue is overly-broad parameter bounds. Since the
parameters represent real-world values (eg. C1 is the degree to which the speed of the treadmill
alters the HR/VO2 response), it makes sense that each value should remain within certain limits.
Although the precise values will vary from person to person, there may be an optimal range that
would allow the model to converge more consistently. If the model is able to latch onto a “good”
(ie. low-error) solution based on physiological reality, it may be able to more consistently
converge on HR/VO2 max and avoid “good” (ie. low-error) solutions with unrealistic values
(based on physiology). Even if the time series data and overall error is slightly higher, this would
represent a “better” solution, since the goal is to model physiological responses rather than
simply find a mathematical solution that matches measured data. Currently, if the model is run
multiple times, it will yield different results for HR/VO2 max each time. Thus, the issue is not
that it is converging on the wrong result and has poor accuracy. Rather, it is not converging at
all, and is giving any HR/VO2 max value that, in combination with the other parameters, will
give a low-error solution. Although a solution may have low error, that does imply that it is a
good solution for the current application, since it represents an artificial solution. Further
refinement of the model and parameter bounds are needed in order to make this DSM-GA usable
Practical Applications
Dynamical System Model & Genetic Algorithm
This study elucidates the challenges to using a DSM-GA to capture the non-linear
dynamics of HR and VO2 responses during walking and running. However, if these challenges
can be overcome, a model of this type would be extremely useful for the prediction of
physiological functions. As stressed in the introduction, VO2 max is a critical metric for the
assessment of fitness in athletes and clinical populations alike. Accurately VO2 max estimates
without the need for a maximal exercise test would be invaluable, especially in clinical settings
where lack of time, money, and space are major obstacles. Once optimized for the treadmill, this
model could be adapted to other forms of exercise such as stair stepping or swimming. While a
properly converging DSM-GA may be a useful tool for the prediction of HR kinetics and HR
max, it is limited by the fact that is still requires VO2 measurement. This makes it useful in a
laboratory setting, but not in the real world. However, the ANN is able to address this issue,
arguably making it the more practical aspect of this study.
Artificial Neural Network
This machine learning approach to VO2 prediction has significant implications for
cumbersome equipment. Additionally, many high-level athletes try to train at or around their lactate threshold, which can be difficult without having access to real-time VO2 data.
For clinical populations, VO2 kinetics may be used to identify abnormalities in aerobic
responses and potential disease development49. VO2 is also important for the assessment of heart
failure disease severity and eligibility50. Accurate assessment of exercise intensity would
increase the efficacy and safety of exercise evaluations and training programs. In healthy individuals, real-time VO2 estimates may improve the accuracy of energy expenditure
estimations in wearable devices, which have had poor accuracy to date51. Other predictions can
be made from real-time VO2 estimates during exercise, including cardiac output and stroke
volume52. Accurate assessment of VO
2 max without the need to perform a maximal
cardiopulmonary exercise test would dramatically increase the accessibility of VO2 max, and
potentially allow it to become a vital sign53. The current study does not deal directly with these potential applications, but it is a preliminary study demonstrating the usefulness of such a tool for predicting VO2 responses.
Limitations
The primary limitation of this project is that the model is not yet converging properly. Although the R2 is very high, the output represents an artificial solution. Further refinement is
abilities would be needed to train an ANN that works for the population at large. Another limitation, discussed previously, is the Bruce treadmill protocol’s appropriateness for the subjects in this study.
The subjective nature of mathematical modeling also had an impact on the present study. For the GA to test parameters and begin converging on a solution, it must be given bounds and initial guesses. There is subjectivity to how wide/narrow to make these bounds and how large to make the mutation standard deviation/generation limit. Increasing the mutation standard
deviation and/or the generation limit allows the model to explore more potential solutions, which is helpful so that it does not get stuck at local maximums or minimums. However, it makes the model take longer to run, as initial guesses may be way off from the actual solution. It also increases the likelihood of latching on to an artificial solution that may have low error.
A major limitation to the GA is that it can only predict VO2 responses from VO2 data,
which is cumbersome to measure. This can potentially be addressed by the ANN (the secondary purpose of this current study), which allows the prediction of VO2 responses from measured HR
data. However, predicting VO2 max from estimated VO2 response introduces another level of
potential error. Finally, there is subjectivity in the ANN regarding how many hidden neurons to use and what percentage of the data to use for training, testing, and validation.
Future Research
explain more of the variance in oxygen uptake. If someone has an abnormal HR response,
oxygen saturation at the calf may be a meaningful was to see how much oxygen is actually being utilized during activity. Perhaps even the delay in oxygen delivery to the working muscle
(relative to the increase in intensity or HR) would provide meaningful information about how the cardiorespiratory system is functioning. Additionally, easy-to-obtain gait metrics should be added to the model to see if they can account for individual differences in biomechanical efficiency and help the model converge properly.
Future research should explore other methods of mathematical modeling and machine learning to predict physiological outcomes. Wearables are becoming increasingly popular and collecting substantial amounts of data51. Mathematical modeling and machine learning can be
used to decipher meaningful information amidst the noise. For instance, Apple Watches and FitBits have continuous access to HR and accelerometer data. These metrics can be used to estimate VO2 max without the need for a specific exercise protocol, but current methods have a
large degree of error. This could make VO2 max accessible to their health care providers with
virtually no added time or burden.
Conclusions
The purpose of this study was to predict HR max, VO2 max, and HR/VO2 kinetics during
walking and running at various intensities using a DSM and GA. HR/VO2 responses during
with using a model like this to predict HR and VO2 kinetics. A properly converging model would
have numerous applications, the most noteworthy of which would be the ability to predict HR max and VO2 max with greater accuracy than current methods which rely on a variety of
assumptions; VO2 max predictions are of particular interest. Although somewhat useful,
DSM-GA predictions of VO2 max still require the measurement of VO2 data, which is a serious
limitation outside of the laboratory. Therefore, a secondary purpose of this study was to utilize an ANN to predict VO2 (and subsequently, VO2 max) from HR data. ANNs were found to be a
useful and simple tool for predicting VO2 responses in healthy males with reasonable accuracy.
APPENDIX A: PRE-ASSESSMENT GUIDELINES UNIVERSITY OF NORTH CAROLINA AT CHAPEL HILL
Claudio Battaglini, Ph.D. FACSM. Department of Exercise and Sport Sciences
105 Fetzer Hall, CB # 8700
(919) 843-6045 / Email: [email protected]
Pre-Test Guidelines
1. Avoid eating 2 hours prior to testing. 2. Void completely before testing.
3. Maintain proper hydration prior to testing.
4. Please wear appropriate clothing/shoes for testing (running shorts/shirt/shoes) 5. No exercise 24 hours prior to testing.