High-sensitivity measurement of
3He -
4He isotopic ratios for ultracold neutron experiments
H. P. Mumm*and M. G. Huber
National Institute of Standards and Technology, 100 Bureau Drive, Stop 8461, Gaithersburg, Maryland 20899, USA
W. Bauder
The Pennsylvania State University, Applied Research Laboratory, State College, Pennsylvania 16804, USA
N. Abrams
Columbia University, 538 West 120th St., 704 Pupin Hall, MC 5255, New York, New York 10027, USA
C. M Deibel
Louisiana State University, 218-B Nicholson Hall, Tower Dr., Baton Rouge, Louisiana 70803, USA
C. R. Huffer, P. R. Huffman, and K. W. Schelhammer
North Carolina State University, 2401 Stinson Drive, Box 8202, Raleigh, North Carolina 27695, USA and Triangle Universities Nuclear Laboratory, 116 Science Drive, Box 90308, Durham, North Carolina 27708, USA
R. Janssens, C. L. Jiang, R. H. Scott, R. C. Pardo, K. E. Rehm, and R. Vondrasek
Argonne National Laboratory, Physics Division, Building 203, 9700 S. Cass Ave., Argonne, Illinois 60439, USA
C. M. Swank
California Institute of Technology, 1200 East California Boulevard, Pasadena, California 91125, USA
C. M. O’Shaughnessy
University of North Carolina at Chapel Hill, 120 E. Cameron Ave., CB #3255, Chapel Hill, North Carolina 27599, USA and Triangle Universities Nuclear Laboratory, 116 Science Drive, Box 90308, Durham, North Carolina 27708, USA
M. Paul
Hebrew University of Jerusalem, Racah Institute of Physics, Jerusalem 91904, Israel
L. Yang
University of Illinois at Urbana-Champaign, 1110 West Green Street, Urbana, Illinois 61801, USA (Received 10 February 2016; published 13 June 2016)
Research efforts ranging from studies of solid helium to searches for a neutron electric dipole moment require isotopically purified helium with a ratio of 3He to 4He at levels below that which can be measured using traditional mass spectroscopy techniques. We demonstrate an approach to such a measurement using accelerator mass spectroscopy, reaching the 10−14level of sensitivity, several orders of magnitude more sensitive than other techniques. Measurements of3He/4He in samples relevant to the measurement of the neutron lifetime indicate the need for substantial corrections. We also argue that there is a clear path forward to sensitivity increases of at least another order of magnitude.
DOI:10.1103/PhysRevC.93.065502
I. INTRODUCTION
Isotopically purified4He is central to the success of a variety of experiments including the ultracold neutron (UCN) lifetime measurement [1,2] at the National Institute of Standards and Technology (NIST), torsion oscillator experiments studying solid3He -4He mixtures [3,4], and the neutron Electric Dipole Moment (nEDM) experiment [5,6] at the Spallation Neutron Source (SNS) at Oak Ridge National Laboratory. The common feature of these experiments is that each requires accurate
measurements of the 3He -4He ratio (R34) at levels below
that which can be measured using standard mass spectrometry techniques (the typical abundance sensitivity of a commercial mass spectrometer is≈10−9).
In the neutron lifetime experiment, for example, it is essential to have significantly increased isotopic purity as the UCN loss rate due to the reaction 3He(n,p) is rloss=
nR34σthvth, where R34 is the isotopic ratio of the helium,
n=2.17×1022 cm−3 is the number density of helium
atoms at 300 mK, σth=5333 barns is the 3He thermal
neutron cross section, and vth=2200 m/s is the thermal
required to reduce the fractional systematic correction to the neutron lifetime due to3He absorption to less than 0.1 s, the ultimate goal of the experiment.
Second, there are puzzling observations in experiments de-signed to test the supersolid phenomenon in helium [8]. These observations are affected strongly by the solid 4He sample
quality which depends on growth condition, sample geometry, and, importantly, the 3He concentration. The surprisingly high sensitivity of the torsional oscillator (TO) frequency shifts to minute3He concentrations at parts-per-million level has helped to explain the role 3He plays in these systems. Certain behaviors of these systems have been correlated with extrapolated concentrations down toR34≈10−14[4].
Finally, in the case of the nEDM experiment, the neutron precession rate is measured for E and B fields parallel and antiparallel. Because there are not enough neutrons to measure the precession signal directly, a spin-dependent nuclear interaction with polarized3He is used. This polarized
3He (in a vessel of superfluid4He also containing the neutrons)
is eventually depolarized by interactions with the container walls and must be removed from the system.
In order to do this, the heat-flush technique is used. It utilizes the fact that3He atoms in He II form part of the normal fluid component. Thus in an apparatus that creates a thermal counterflow, that is, where normal fluid travels away from a heat source and superfluid simultaneously moves towards it, 3He atoms will tend to congregate at the cold end of the apparatus. There appears to be no intrinsic limit to the isotopic purity that can be obtained with this method [9–11]. To validate heat-flush transport performed at the SNS, measurements of test samples with concentrations ranging from about 10−8to
10−12 are required. The heat-flush technique is also used to
isotopically purify the samples discussed later in this paper. Earlier work verifying the heat-flush technique has gen-erally relied on methods of increasing the concentration of purified samples and then using traditional mass spectrom-eters. This can be done, for example, by running samples through a purifier in reverse. This approach has yielded indirect limits ofR34 <5×10⁻¹⁶ [11] using a one-shot purification
and R34 <5×10⁻¹³ for a continuous-flow apparatus [12]
similar to that used to purify the helium used in this work. There is no reason to expect that the purities obtained with the continuous-flow apparatus should be less, so it has been historically assumed that the purified helium used in the neutron lifetime experiment, which we will refer to as ultrapure, wasR34≈10−16; obviously a direct measurement
is desirable. Specialized commercial mass spectrometers can reach levels of sensitivity on the order of 1×10⁻¹². On the
other hand, accelerator mass spectroscopy (AMS) provides the only potential way to directly measureR34in isotopically
purified helium samples at the level of sensitivity required for the neutron lifetime experiment and should be expected to reach an ultimate sensitivity at the 10−15 level. A program
to reach these levels of sensitivity was started in 2000. Since then, significant progress has been made in developing the technique for AMS measurement of trace3He impurities, and several purified samples of experimental significance have been successfully measured. In this article we report the results of this effort.
II. EXPERIMENT
AMS (see [13] for a review) is a technique typically dedicated to the measurement of radionuclides of extremely low abundance, either of natural (cosmogenic or radiogenic nuclides) or artificial origin (produced via nuclear reactions). The principle of the technique is based on the acceleration of ions of the specific nuclide at an energy sufficient for separation or discrimination from abundant isotopic and isobaric species and from stable molecular interferences of close-by mass. The high ion energy, compared to that used in standard mass spectrometric methods, provides unambiguous identification through a combination of magnetic and electrostatic analysis and nuclear detection methods (e.g., specific energy loss, ion range in matter, time of arrival). In our case this separation was accomplished using an Enge split-pole spectrograph (SPS) [14] as discussed below.
In the current project, the isotope to be detected is stable
3He whose isobar is radioactive3H (t
1/2=12.32 y), the only
otherA=3 bound nuclide. There is a historical tie here, as
3He was the first nuclide to be identified after acceleration
through a cyclotron by Alvarez and Cornog [15,16], predating by about four decades the development of AMS as a full-fledged technique. In our experiment, we take advantage of the fact that acceleration of3He to 3 MeV per nucleon allows us to dissociate and completely eliminate molecular species (such as H+3) likely to be present (the highest energy used in a run was 5 MeV per nucleon, but all data reported here used an energy of 3 MeV per nucleon). Although of different mass than
3He, this species could cause severe background in the case of
detection of ultralow3He abundances. As described later, the difficulty in this measurement is not in identifying or detecting
3He, but controlling the sources of atmospheric and laboratory
background of helium with much larger3He abundances than in the isotopically purified helium samples of interest.
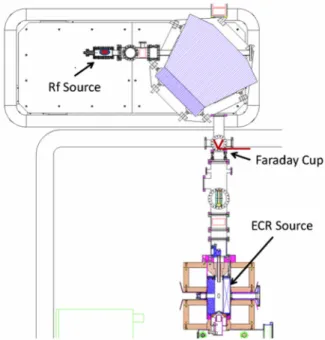
FIG. 1. Floor plan of the ATLAS Accelerator Facility. The ECR-1 ion source and an associated RF discharge source were used for3He AMS and the beam was accelerated to 8 MeV in the “PII” and “Booster” linac sections. The3He produced was detected, after transport, in the Enge split-pole spectrograph.
Configuring the linear accelerator and beam transport sys-tem for an AMS experiment requires establishing a hardware configuration that is set for an ion species with a specific mass to charge state (M/q≈3 for3He+) ratio and a specific initial velocity. Thus the linac is typically tuned using a guide beam—a stable ion species that has a similar M/q ratio. This tune is then scaled by a factor equal to the ratio of the exact value ofM/qfor the guide beam to that of the species of interest. Here 12C4+ was used for the initial accelerator
and beam transport system setup. The final beam energy used varied somewhat in successive experiments but was approximately 3 MeV per nucleon. That tune configuration was then scaled to the molecular species H13+as an additional check and to make the final tune to the beam cup located before the SPS (see Fig.2). The scale factor from12C4+ →H13+was 1.00783 and the final accelerator scaling from H13+→ 3He1+
was 0.99754. The retractable beam cup can be replaced by a Au foil which strips accelerated3He+ ions to3He2+ and
dissociates contaminant molecular ions (e.g., H3+, DH+)
A. Description of measurement sequence
The AMS 3He/4He ratio is obtained by comparing the rate of detection of3He2+ions in the spectrograph detector, corrected for detector efficiency and accelerator transmission, to the beam current of 4He out of the source. The source operation was monitored by measuring the 4He1+ current
at the ion source Faraday cup shown in Fig. 2. This was accomplished by changing the ion source extraction voltage from 30 to 22.5 kV (3/4 of 30 kV) to match the magnetic rigidity of the3He1+ions. Thus the source analyzing magnet
was not changed during this cyclic process. The beam is
accelerated through ATLAS, passes through the gold stripper foil in front of the SPS to remove unwanted molecules and to raise the 3He charge state to 2+, and then into the SPS. The accelerator transmission was monitored periodically by returning the ion source to a hydrogen plasma and measuring the transmission to a Faraday cup at the position of the stripper foil of the SPS with a H13+beam. Ions are detected in the SPS with an ionization chamber focal-plane detector that provides
information both in position and in the energy loss,dE/dX. This allows unique identification of3He signals.
B. Ion source development
For the ATLAS accelerator, the standard positive ion source is an electron cyclotron resonance (ECR) ion source [18]. These sources have large vacuum chambers that have a significant internal surface area on which gases can be adsorbed. For example, the ECR source first used in this work had a 30 cm long, 8 cm diameter cylinder chamber. In addition, such sources are often operated with helium as a support gas. The typical concentration of3He in atmospheric
4He of 1
.4×10−6[19] is to be compared to a sensitivity goal of one part3He in 1015 parts4He. This comparison provides a general perspective on controlling helium backgrounds. It is readily apparent that it is not possible to fully overcome helium outgassing from the cylinder walls (or possible atmospheric leaks) by simply operating the source at extremely high pressures and flow rates.
To address this problem, a mini-ECR ion source using the magnetic field and microwave power feeds of the existing source was developed. The plasma volume was defined by a borosilicate glass tube attached to a redesigned aluminum extraction electrode system. In principle this would separate the plasma from sources of natural helium background. The mini-ECR source designed for this experiment is shown in Fig.3.
While this source geometry did allow measurements down to the 10−13 ratio regime or better, it had a number of drawbacks:
(1) The geometry did not allow the production of12C4+.
Therefore one had to return to the normal ECR geom-etry for the guide beam and re-install the mini-ECR source after the linac was tuned. Any problems that raised a question concerning the linac tune required removing this source and reverting to the standard
FIG. 3. The mini-ECR source developed early in this work to reduce the3He background seen in the main ECR ion source. The quartz tube is mounted on the extractor electrode for the ECR source and extends into the ECR cavity. At the bottom of the quartz tube holding flange is the 1 mm extractor hole and the offset gas feed for the helium gas.
ECR geometry. This cycling process was quite time-consuming.
(2) Igniting the plasma in this geometry was occasionally difficult.
(3) While the initial sensitivity observed for this geometry was much improved, it was still at least an order of magnitude above the most interesting regime of 10−14 to 10−15.
To illustrate these points, an example of a measurement sequence with this source configuration as a function of gas pressure is shown in Fig.4. This plot shows the3He
/4He ratio starting out in the regime of natural abundance material with no flow of isotopically purified helium in the source. As a higher flow of purified gas is introduced into the source, the3He/4He ratio approaches an asymptotic value that is interpreted as representing that of the actual sample.
Attempts were made to further reduce the source of helium background in this geometry by replacing the quartz (known to have a high helium diffusion constant) with a pyrolytic boron nitride tube. These improvements achieved a sensitivity approaching 2×10⁻¹⁴ in the 3He
/4He ratio. Nevertheless, the difficulty of working with the mini-ECR source led us to explore other possibilities. The geometry for this two-source configuration is shown in Figure 2. We adopted an RF discharge ion source [20] that used a small quartz tube to define the plasma region and a simple inductive coupling scheme for RF power into the source. By utilizing a source completely separate from the ECR source, we made it possible to quickly switch between the beams of interest (3He1+, H1+
3 ,
and12C4+) to check beams tunes and to make quick repairs and
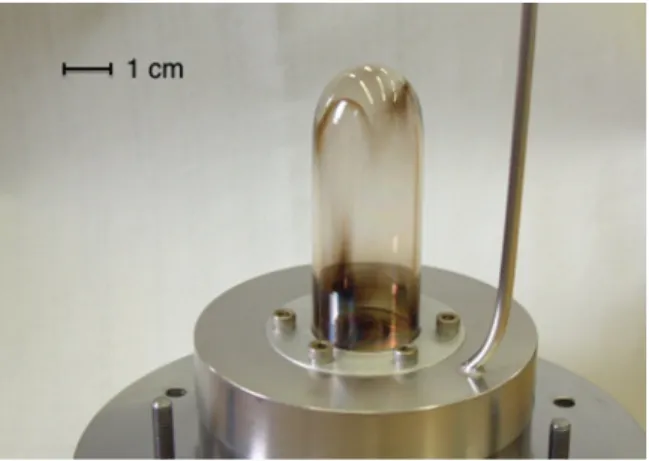
modifications to the source. Figure5shows the RF discharge source in operation with a helium plasma and Fig. 6 shows a more detailed drawing of the source glass and vacuum definition.
FIG. 4. The observed3He/4He ratio observed with an ultrapure sample as a function of the4He beam current from the source. The helium current is viewed as a surrogate to helium partial pressure in the source plasma. The asymptotic value of3He
/4He ≈3×10⁻¹³ observed at high4He source current (for which source background becomes less significant) is consistent with that obtained using the current source configuration as described in Sec.IV B. The highest ratio data points were obtained with only oxygen flowing into the source. The4He current for those data points was
FIG. 5. RF discharge source in operation with a helium plasma. Gas flow from the helium sample enters from the left and ions are extracted though the electrode on the right. RF power is supplied using the coils visible to the center right of the source.
The ECR remained the ion source for the12
C4+guide beam used to determine the initial accelerator configuration. The ECR source plasma is then turned off and gas flow into the ECR source stopped. The bending magnet between the RF source and the ECR source is set to transport a specific ion from the RF source through the ECR and out into the connecting low-energy beam transport (LEBT) system.
A molecular beam of H13+is used to retune the accelerator system from the ion source to the detection system, based on the previous12C4+ tune. This beam is created by the RF
source using a hydrogen plasma with a current of 10 to 20 nanoamperes (nA), allowing us to measure the accelerator beam transmission. Additionally, we note that the ability to operate the source with only pure hydrogen allowed a measurement of the residual helium in the system and established a baseline for 3He background, as discussed in Sec.IV B.
To further reduce natural helium backgrounds, a new plasma chamber for the RF discharge source was designed. The plasma chamber was intended to be easily swappable, allowing transmission measurements with a calibrated (≈1% natural)
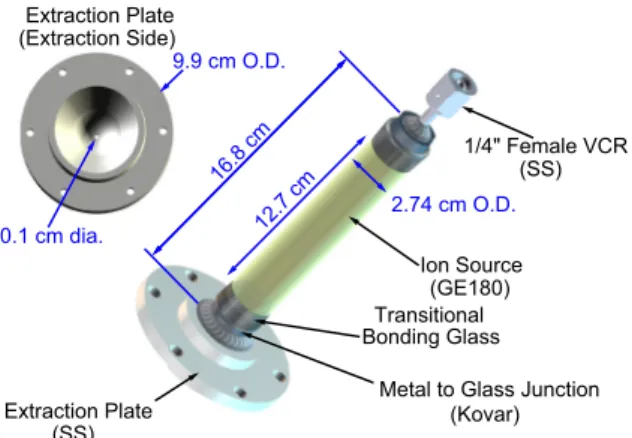
FIG. 6. The new RF source plasma chamber constructed with materials having a low helium diffusivity. This source operates by inductive coupling from an external coil surrounding the chamber oscillating at approximately 80 MHz with RF power less than 100 W.
helium sample to be followed by ultrapure measurements using an uncontaminated chamber to minimize the creation of large backgrounds for the isotopically purified samples. The new plasma chamber is 16.84 cm long by 2.74 cm in diameter and constructed using materials with inherently low helium content, a reduced probability of adsorption of helium onto the surface, and low helium diffusivity. The new chamber shown in Fig.6is constructed from Kovar1 bonded directly to Corning 7056, a borosilicate glass, and GE180, an aluminosilicate glass, with helium permeation rates several orders of magnitude lower than quartz. GE180 has been used very successfully in polarized3He neutron spin filters for many years [21].
C. Source gas handling system
As the experiment requires a stable and well-defined accelerator tune, it is important to have the capability to switch between samples and plasma conditions with as little impact on the tune as possible. For this to be true, the ion source operation must also be extremely stable and reproducible. In addition, the experiment requires the ability to compare samples with different isotopic ratios.
A gas handling system was built that allowed the switching of gas samples without turning off source voltages and without stopping the plasma operation. This allowed frequent returns to an ultrapure hydrogen plasma in order to check the beam tune. In addition, using the same gas handling system allowed for remote switching between an ultrapure sample and a reference sample, again while the voltages remained on.
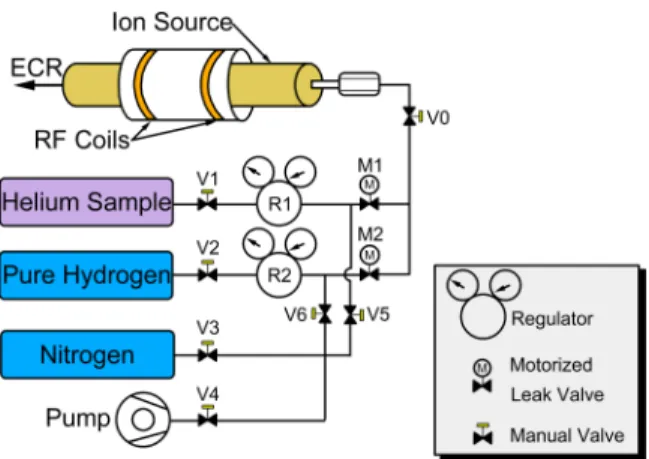
The gas handling system is shown in Fig.7. This setup is rather typical of ion source manifolds but is completely new and has never been exposed to natural helium. In addition, material choices for the manifold were made to minimize those that would easily absorb gasses, particularly helium, and thus lead to the potential contamination of high-purity samples. Central to the gas handling system design are two precision leak valves (Agilent Technologies model 951-5106). Each leak valve controls the gas flow from a separate gas bottle. The two leak valves were remotely operated by a DC servo motor located outside of the RF discharge source. This allowed the safe and controlled injection of gas into the ion source while lit. To avoid the possibility of helium diffusion into the system, all joints in the gas handling system were constructed of welded stainless steel or metal-metal compression fittings. The entire gas handling system was baked out and leak tested at NIST with hydrogen prior to use at ATLAS. Once installed at ATLAS the system was purged with dry boil-off nitrogen and pumped out. Because of the low operating pressure of the source, an absolute pressure regulator (Airgas Y11 C440N) was mounted on the helium sample bottle.
FIG. 7. Schematic of the gas handling system used with the RF discharge source. Two computer-controlled leak vales allow simple switching between samples while the source remains in operation. The nitrogen supply and pump were used to pump and purge the manifold assembly.
D. Detection setup
The accelerated3He1+beam was delivered to the ATLAS split-pole spectrograph where it was stripped to 3He2+ by a 300 μg/cm2 gold foil. In addition the stripping process
dissociated any contaminant molecular species such as residual molecules from the reference H13+. This relatively pure3He2+ beam is then bent by the SPS into the focal plane detector. As a final filter, the spectrograph completely separates any remaining molecular fragments, disperses the 3He ions by momentum and focuses them onto the focal plane. The ions are then detected and counted by a parallel-grid avalanche counter (PGAC) followed by a multi-anode ionization chamber [22]. The PGAC providesx position (horizontal dispersion plane) andy position (vertical plane) signals for individual ions and one of the anodes (dE4) of the ionization chamber provides an energy-loss signal distinctive for3He2+ions.
III. SAMPLE PREPARATION
Validation of the the mass-spectroscopic measurements re-lied on comparison to samples prepared to have a well-known isotopic ratio. In addition, samples of highly purified hydrogen gas were used to operate the source without helium and to provide a way of measuring the inherent3He background of the RF source and accelerator.
A. Ultrapure hydrogen sample
A commercial electrolysis hydrogen generator (Parker Balston H2-1200) with a palladium membrane was used to prepare samples of hydrogen gas with a very low helium content. The generator was leak-checked by the manufacturer with one bar of helium and no observable leakage through the membrane was detected. Assuming a natural helium isotopic ratio, this allows the maximum 3He mass transfer
rate through the membrane at this pressure differential to be estimated at 3×10⁻²⁰mol/s. The generator produces H
2gas
at 1×10⁻⁶mol/s. Assuming that natural helium had diffused
into the water used in the generator and reached equilibrium
(2×10⁻⁸ mol3
He/molH2O) and that no helium remained in
the all-metal sample bottle after evacuation and baking, we can place an upper limit on the possible3He contamination during normal operation of less than 1×10⁻²¹. This should
be understood to be a very rough estimate. Nonetheless, in the context of the work reported here, the H2 sample is free of
3He.
B. Reference sample preparation
Two reference samples, 1 and 2, of well-known concen-tration were prepared by mixing ultra-pure helium purified by the McClintock group using the heat-flush technique [11] with natural helium from a bottle of 99.999% commercial BIP (Built-In Purifier) helium. At the onset of this work the ultrapure helium was expected to beR34≈10−16as described
above, however in the mixing calculations that follow, the value ofR34 =(1.2±0.4)×10−12 eventually measured for
the ultrapure gas (sample 4, see TableII) was used, and results in a slight upward shift in concentration (see Sec.IV Bfor a description of this measurement). The3He/4He ratio of the commercial BIP helium was measured to approximately 1% precision using traditional mass spectroscopy.2Measurements of each BIP sample were bracketed with gas containing no helium to eliminate backgrounds and cross-contamination. Uncertainties are statistically dominated, thus we combine the standard uncertainties and obtain a result ofR34(BIP)=
(2.201±0.005)×10−7. This is consistent with a radiogenic helium signature, as would be expected from commercial compressed gas since such helium comes from crustal helium in natural gas wells [19].
The mixing apparatus consisted of an assembly of 1/ 4-inch Swagelok variable compression ratio (VCR) components that allowed connections for a bottle of the commercial helium, a bottle of purified4He, a well-determined evacuated expansion volume, a precision pressure gauge (Paroscientific model 745-400), a pump-out port, and a series of all-metal valves that allowed for control of gas flow between each of these components. The stainless-steel sample bottles and expansion volume had fully welded fittings and all-metal sealed bellows and metal-seated valves. They were pumped under vacuum while modestly heated for three hours prior to use. Measurements of pressure changes with the precision pressure gauge were used to determine all of the volumes in the system.
The mixing process used the following sequence. A 300 ml stainless-steel sample bottle filled with ultra-pure helium was attached to the gas handling system. Natural (BIP) helium was then allowed to fill the tubing (mixing volume) connecting the various valves (approximate volume 14 ml). The natural gas bottle was valved off, and the gas was allowed to expand into an evacuated 150 ml volume, reducing its pressure by roughly a factor of 10. Finally this bottle was valved off, and the residual gas allowed to mix with the ultrapure sample for 30
to 45 min. This process was repeated, giving a dilution factor of approximately 200 at each stage and yielding a concentration of approximately 1×10⁻⁹ and then 5×10⁻¹² for samples
1 and 2 respectively. The pressure gauge was used to record the pressures throughout the mixing process allowing precise calculations of the concentrations to be made.
1. Mixing simulations
Due to the limited conductance of the tubing used, a mixing time of 30–45 minutes is too short to completely reach equilibrium. To calculate the concentration of the reference samples, a detailed finite element analysis simulation of the gas-mixing system was performed. The calculation included an approximate geometrical model of the system and the pressures of each sample as a function of time. Temperatures were not recorded but are believed to have been relatively constant.
The ratio of the sample volume to the mixing volume was determined by measuring the pressure change of the sample bottle when opened to the evacuated mixing volume. Four consistent expansion measurements were made, two with the 300 ml gas cylinder and two with the 150 ml expansion cylinder. If these volume measurements are averaged we obtain (14.5±0.5) ml for the mixing volume, where the uncertainty is dominated by the manufacturer’s quoted uncertainty in the cylinder volume (10%; three different cylinders). A fifth ratio measurement was made using a more complicated sequence of pressure comparisons. This measurement yields (12.2±1.4) ml. The uncertainty in this measurement is correlated with two of the other measurements. We take the simplest pressure based ratio measurements as the best value, but expand the uncertainty to account for the differences between the three methods, giving (14.5±1.5) ml. This is consistent with the volume calculated based on engineering drawings of the individual components. The uncertainty in the volumes was simulated by adjusting the volume of the valve interiors within the model.
While the initial conditions of the system prior to mixing are well known, the exact response of the system to the opening of the valve was not modeled. To account for this, two limiting cases were considered. First, the gas in the mixing volume was assumed to be completely mixed during the turbulent flow associated with opening the valve between the low-concentration, high-pressure (0.28 MPa) sample and high-concentration, low-pressure (0.021 MPa) sample, and second, the gas was assumed to be unmixed, with the low-concentration gas compressed into the remaining three valves by the incoming higher-pressure gas and the subsequent mixing through diffusion. These limiting cases predict up to a 10% difference in final concentration. The uncertainty in the diffusion constant of3He in4He is roughly 4% [23]. We treat this as independent of concentration.
The initial concentration of the ultrapure sample 4 is assumed to be that measured at Argonne as described in Sec. IV B. The calculated concentrations and associated uncertainties, including the propagation of the uncertainty in the measured concentration of sample 4, are shown in TableI.
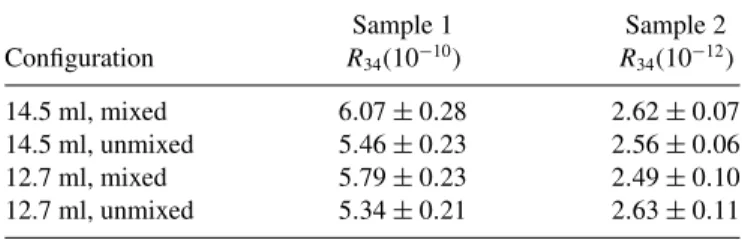
TABLE I. Summary of results from the concentration calculations for various configurations. The nominal configuration is 14.5 ml unmixed. 12.7 ml was used in place of 13 ml to estimate the effect of 1 standard error in volume before the final uncertainties were determined for this work. Uncertainties are combined standard errors (1σ). Calculations are compared to measurement in Fig.9.
Sample 1 Sample 2
Configuration R34(10−10)
R34(10−12) 14.5 ml, mixed 6.07±0.28 2.62±0.07 14.5 ml, unmixed 5.46±0.23 2.56±0.06 12.7 ml, mixed 5.79±0.23 2.49±0.10 12.7 ml, unmixed 5.34±0.21 2.63±0.11
The uncertainty in volume results in a roughly 4.5% and 4.9% change in concentration for the first and second stages of the mixing process respectively (in the mixed case). The uncertainty due to a lack of full knowledge of how the gas mixes is between 5% to 10% while the uncertainty due to the diffusion coefficient is 4%. Assuming that the uncertainties can be added in quadrature, the total uncertainty is then 9.5% for the first stage and 13% for the second, yielding concentrations ofR34 =(6.1±0.6)×10−10 andR34=(2.6±0.3)×10−12
for sample 1 and sample 2 respectively. These values include the 8.4% uncertainty in the measured ultrapure sample used in the mixing.
IV. COMPARATIVE RESULTS
While it is possible to report an absolute isotopic ratio, a potentially more precise approach is to make a comparative measurement between the samples of interest and the well known reference samples described in Sec.III B. In addition, we report results carried out with less sensitive traditional mass spectroscopy.
A. Oregon
The two reference helium samples (1 and 2) were measured with a sensitivity of roughly 1×10⁻⁹using traditional mass
spectroscopy at the Helium Isotope Laboratory [24]. As with the BIP helium, sample measurements were bracketed with gas samples expected to contain no3He to eliminate backgrounds and cross-contamination. Uncertainties are again statistically dominated. The samples were found to have isotopic ratios of (1.93±0.54)×10−9and (5.2±4.7)×10−10for 1 and 2,
respectively (standard errors indicated).
B. ATLAS
the SPS focal plane detector are compared with 4He beam current measured out of the ion source. This method relies on knowledge of the transmission efficiency through the accelerator and detector system. The 3He/4He ratio can be expressed as
R34= N 3
I4SPST t,
(1)
where N3 are the background subtracted counts of 3He in
the detector, I4 is the 4He beam intensity at the ion source
(measured in ions s−1),t is the3He counting time, T is the accelerator transmission, and SPS is the detector efficiency.
The accelerator transmission from the ion source Faraday cup to the spectrograph stripper foil is measured using the molecular hydrogen beam, H13+. To alleviate any concerns over the reproducibility of scaling between tunes, the primary samples were measured back-to-back, only measuring the transmission before and after the sequence. The drift in the accelerator transmission is assumed to be linear and the average value of these transmission measurements was used to calculate R34. For the data presented here, the average
transmission was 20%. After the run it was discovered that a magnet on the low energy beamline was not set with sufficient precision to ensure reproducible switching between
3He1+and H1+
3 . This introduces a potentially large uncertainty
into the determination of the transmission because the H3
transmission measurements may not accurately reflect the
3He transmission if this magnet was not precisely scaled.
Offline tests have shown that this effect introduces a 24% uncertainty in the transmission. Fortunately, all the samples were measured in a continuous sequence without adjusting the magnets or accelerator parameters, meaning that this uncertainty can be considered a systematic that effects all the sample measurements equally. Nonetheless, we conservatively assign a 24% uncertainty to the transmission measurement.
In order to normalize 3He counts to4He output, the 4He current was periodically measured by scaling the injection voltage out of the source and reading the current on the Faraday cup after the first dipole magnet as shown in Fig.2. Typically the 4He current was between 360 and 400 nA. The source stability and performance was checked by measuring the4He current before and after each sample.3He runs are typically one hour and the measured4He current before and after each
run was averaged for use in Eq. (1). The variation in 4He current did not exceed 10% during any data run.
On the focal plane of the spectrograph, the particles are detected with a combination of gas detectors. The PGAC measures position on the focal plane and an ionization chamber measures the energy deposition across five different anodes. Because the stripping foil provides excellent rejection of H+3, position information was unnecessary to distinguish it from
3He2+.3He ions were instead identified through cuts on energy
deposition. Figure8shows a typical plot of the energy loss in anode 4, dE4. dE4 was used for3He identification because it
showed the greatest separation of the3He from the noise in the lower channels.
The energy spectrum has a distinct double peak structure. The larger peak is identified as 3He while the smaller peak
FIG. 8. 3He energy loss in anode 4, dE4, of the focal plane detector. Events are required to be between channels 175 and 350.
at low channel number is a combination of energy-degraded
3He, effects from cosmic rays, and detector noise.3He events
were defined by a cut which was placed around the larger peak (channels 175 to 350). The detection efficiency for
3He produced by this cut combined with effects of the SPS
geometry was measured using the 8.78 MeV alpha from the
212Po daughter of a calibrated228Th source placed at the object
position of the spectrograph (the same position as the stripper foil). Using only the dE4 signal the efficiency was found to be (70±7)%. The 30% losses are estimated to be: 10% blockage through wire planes and 20% due to inefficient triggers in the PGAC and largely constitute the peak seen in Fig. 8at low channel number.
The 3He concentration in each sample was measured in three sequential runs each with sufficient statistics to make the statistical errors negligible. R34 was calculated as the
unweighted mean of these three runs. The uncertainties for each set of measurements are dominated by the systematics due to small fluctuations in the ion source output and accelerator transmission that cannot be tracked in real time. The uncertainty due to these fluctuations is quantified by the standard deviation of the three measurements, assuming a normal distribution. This uncertainty is around 10% for each sample.
We combine all uncertainties in quadrature. The results are tabulated in Table II. As seen in Fig. 9, good agreement is
TABLE II. AMS determined isotopic ratios of the four samples described in the text; the two samples prepared as known references, the sample extracted from the neutron lifetime apparatus, and a sample representing the original source of ultra-pure.
Sample number R34 Uncertainty
1 (reference) 3.8×10⁻¹⁰ 1.0×10⁻¹⁰
2 (reference) 3.0×10⁻¹² 0
.8×10−12
3 (apparatus) 1.8×10⁻¹² 0
.6×10−12
4 (ultrapure) 1.2×10⁻¹² 0
FIG. 9. Comparison of results. Good agreement is seen between the Argonne measurements,, and the calculated concentration of the reference samples,. Error bars show the combined standard uncertainty.
seen between the calculated concentrations of the prepared reference samples and the results of AMS. Importantly, the ultrapure samples extracted from the UCN lifetime apparatus show much higher concentrations of3He than was assumed in planning the experiment, although difficulties with the extraction procedure leads to some question as to how well this sample represents the concentration as seen by the trapped neutrons during data collection. Nonetheless a concentration ofR34=(1.8±0.6)×10−12 results in a systematic shift in
the measured lifetime of−(34±11) s, much larger than the ultimate goal of the measurement. We note also that3He was
measured in sample 4. It is not clear when this contamination occurred, or whether it has implications for the purification process. To address these questions we have built a new purifier and are preparing a new set of measurements that will be the subject of a future publication. Finally, we note that improvements in the AMS measurements are are expected. For example, a more precise Hall probe has been installed in the RF ion source injection magnet, and, in future experiments, the setting of this magnet should be reliable. In addition, a different choice of detector, for example a solid-state detector, is expected to reduce the uncertainty in detector efficiency.
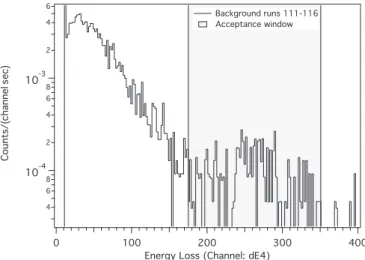
Near the end of the measurement, a series of runs were carried out with the ultrapure hydrogen described in Sec.III A in the source. These runs followed measurements taken with the≈10−9reference sample, and were intended to determine
the time constant of residual helium gas in the system. The count rates were seen to fall fairly rapidly to a stable rate with a time constant of≈730 s. From Fig.10, the constant background rate is seen to be 7.6×10⁻³ s−1. Assuming the
behavior of the source is the same when running hydrogen and helium, the limiting sensitivity from this constant background can be calculated to result in anR34 between 2×10⁻¹⁴ and
3×10⁻¹⁴. However, as described in Sec. II C both sides of the gas handling system are connected directly to the RF source chamber at all times. Thus we believe that the constant
3He background is likely the result of the valves not closing
)
(
FIG. 10. Count rate in spectrograph after running pure hydrogen in the source for roughly 45 minutes. Natural3He backgrounds fall in the region from 175 to 350 in dE4
completely, and does not represent a background for the helium sample runs. It will be possible to verify this in future experiments by evacuation and then back-flushing both sides with ultrapure hydrogen.
V. CONCLUSIONS AND FUTURE WORK
We have used AMS to perform absolute measurements of the isotopic ratio of 3He to 4He at the level of 10−13
and validated these measurements by comparison to known reference samples. The absolute ratios show good agreement with our produced standard concentrations. In addition we have shown that natural helium backgrounds can be controlled to at least the 10−14 level. Furthermore, we have reason to
believe that the contamination at this level was due to a leaky valve, and therefore expect that background can be reduced at least an order of magnitude. Systematic problems with the measurement, in particular setting and measuring the magnetic field of the steering magnet in the low energy beamline have been solved or, in the case of the detector efficiency, replacement of the gas counter by a solid-state detector would resolve the issue. We believe that it should be possible to reach measurement sensitivities of3He/4He ratios on the order of 10−15 at which point statistics will become a limiting factor
(for context, the3He count rate for the≈10−12samples was
less than 1 s−1. This level of sensitivity would be sufficient
to allow future versions of the neutron lifetime measurement to reach the 0.1 s level. Perhaps the most important result of this work is the demonstration that the3He/4He concentration of the ultrapure gas sample, originally expected to be in the range of 10−16based on the heat flush purification technique,
was in fact≈1×10⁻¹². This is critical in understanding the
ACKNOWLEDGMENT
We acknowledge the support of the NIST, U.S. Department of Commerce, in providing support for facilities used in this work. This work is also supported in part by the U.S. National Science Foundation under Grant No. PHY-0855593 and by
the U.S. Department of Energy, Office of Science, Office of Nuclear Physics, under Contracts No. DE-AC02-06CH11357 and No. DE-FG02-97ER41042. This research used resources of ANL’s ATLAS facility, which is a DOE Office of Science User Facility.
[1]Next Generation Experiments to Measure the Neutron Lifetime, edited by S. Seestrom (World Scientific, Singapore, 2014). [2] C. O’Shaughnessy, R. Golub, K. Schelhammer, C. Swank, P.-N.
Seo, P. Huffman, S. Dzhosyuk, C. Mattoni, L. Yang, J. Doyle, et al., Nucl. Instrum. Methods. Phys. Res. Sect. A 611, 171 (2009).
[3] P. Gumann, M. C. Keiderling, D. Ruffner, and H. Kojima,Phys. Rev. B83,224519(2011).
[4] P. Gumann, M. Keiderling, and H. Kojima,J. Low Temp. Phys. 168,162(2012).
[5] R. Golub and S. K. Lamoreaux,Phys. Rep.237,1(1994). [6] nEDM Experiment,http://www.phy.ornl.gov/nedm/
[7] K. Oliveet al.(Particle Data Group),Chin. Phys. C38,090001 (2014).
[8] E. Kim and M. H. W. Chan,Nature (London)427,225(2004). [9] G. Herzlinger and J. King,Phys. Lett. A40,65(1972). [10] M. Atkins and P. McClintock,Cryogenics16,733(1976). [11] P. McClintock,Cryogenics18,201(1978).
[12] P. Hendry and P. McClintock,Cryogenics27,131(1987). [13] W. Kutschera,Int. J. Mass Spectrom.242,145(2005). [14] H. Enge,Nucl. Instrum. Methods162,161(1979). [15] L. Alvrez and R. Cornog,Phys. Rev.56,379(1939).
[16] L. Alvarez, Proceedings of Symposium on Accelerator Mass Spectrometry, Argonne National Laboratory, Argonne, IL, Physics Division Report No. ANL/PHY-81-1, 1981.
[17] L. Bollinger, R. Pardo, K. Shepard, J. Bogaty, B. Clifft, F. Munson, and G. Zinkann,Nucl. Instrum. Methods Phys. Res. Sect. A328,221(1993).
[18] R. Vondrasek, S. Kondrashev, R. Pardo, R. Scott, and G. Zinkann, Proceedings of the 13th International Conference on Ion Sources, Gatlinburg, TN, September 20–25, 2009 [Rev. Sci. Instrum.81,02A907(2010).
[19] F. Pobell,Matter and Methods at Low Temperatures, 2nd ed. (Springer-Verlag, Berlin, 1996).
[20] C. Moak, H. Reese, and W. Good, Nucleonics9, 18 (1951). [21] JCNS Workshop on Modern Trends in Production and
Appli-cation of Polarized 3H e (IOP Publishing, Singapore, 2011), p. 294.
[22] M. Paulet al., Argonne National Laboratory Physics Division Annual Report, No. ANL-97/14, 1997, p. 79.