SOLUTION STRUCTURE, RHEOLOGY, AND NANOCOMPOSITES OF A LIQUID CRYSTALLINE POLYELECTROLYTE
Ryan John Fox
A dissertation submitted to the faculty at the University of North Carolina at Chapel Hill in partial fulfillment of the requirements for the degree of Doctor of Philosophy in Materials
Science in the College of Arts & Sciences.
Chapel Hill 2020
iii ABSTRACT
Ryan John Fox: Solution Structure, Rheology, and Nanocomposites of a Liquid Crystalline Polyelectrolyte
(Under the direction of Theo J. Dingemans)
High-performance polymers, most notably all-aromatic polyamides (aramids), enable the convergence of the disparate material properties, such as low density, high strength, high stiffness, and thermal stability. Sulfonated derivatives of aramids (sulfo-aramids) represent a unique class of materials that are a nexus between stiff and strong engineering materials and soft and dynamic biological matter. Specifically, sulfo-aramids are water soluble and often self-assemble into rodlike supramolecular structures in solution, similar to rodlike viruses or polypeptide helical assemblies. Such rodlike systems undergo spontaneous self-organization into a liquid crystalline (nematic) phase above a critical concentration, resulting in a high degree of local orientational order. Application of an external field, such as shear flow, can either increase or decrease the global orientational order of the nematic phase. Thus, understanding the solution structure and rheology of such phases has important implications for the fabrication of high-performance, sulfo-aramid nanocomposites.
iv
v
vi
ACKNOWLEDGMENTS
I have had the pleasure of working with many people who have made this Dissertation possible. My research advisor, Prof. Theo Dingemans, has provided me with the direction, resources, and opportunities that have enabled me to undertake this work and the freedom to explore my own interests. From my first meeting with Theo, I became convinced that his research direction was an exciting area with many opportunities, and I’ve enjoyed conducting the research presented in this Dissertation. I thank my doctoral committee, Profs. Sergei Sheiko, Ehssan Nazockdast, Frank Leibfarth, and especially my committee chair, Prof. Greg Forest, who have provided significant guidance and support in a variety of ways. Thanks to Profs. Stephen Picken, Lou Madsen, and Ed Samulski for elaborating many complex ideas in soft matter physics that I needed to integrate in order to complete this work. Many thanks to the members of the Dingemans Lab, Drs. Maruti Hegde, Will Daniels, Shreya Choudhury, and Anna Fraser, and all my other colleagues in the Applied Physical Sciences and Chemistry departments, and for their help over the years and making UNC a great place to work.
vii
being excellent graduate research mentors, as well as Drs. Koohee Han, Sangchul Roh, Alex Richter, Tim Shay, Sabina Islam, Dane Grismer, and Prof. Bhuvnesh Bharti for making a great lab environment to work in as an undergraduate. I thank my academic advisors, Profs. Michael Dickey and Lisa Bullard, for providing a significant amount of support in my path through Chemical Engineering at NC State.
I want to especially thank Matt Baker and Justin Whiteman, who supervised me while as an intern at Stiefel, a GlaxoSmithKline company. As my first laboratory experience, I could not have asked for a better pair of Chemical Engineers to introduce me to soft matter research and process engineering. Their guidance and words of advice were one of the primary reasons that I pursued graduate research. In addition, I thank my supervisors during my internship with Novozymes, Drs. Sarah Gould and Elizabeth DeFreese, who introduced me to all things related to enzyme fermentation. They taught me many things about graduate school and industrial research at an important time in my undergraduate career.
During my time as a graduate student, I have been fortunate to have received training opportunities provided by the Department of Energy (DOE). First, I want to thank the staff and scientists at Argonne National Laboratory and Oak Ridge National Laboratory (ORNL) for sponsoring my attendance to the 20th National School on Neutron and X-Ray Scattering
viii
William Heller for their help and support, in addition to the instrument staff, radiological control technicians, and instrument hall coordinators for their assistance during my experiments conducted at ORNL.
ix
TABLE OF CONTENTS
LIST OF TABLES ... xiv
LIST OF FIGURES ... xv
LIST OF ABBREVIATIONS AND SYMBOLS ... xxi
CHAPTER 1: INTRODUCTION ... 1
1.1. LIQUID CRYSTALS ... 1
1.2. LIQUID CRYSTALLINE POLYMERS ... 5
1.3. POLYELECTROLYTES ... 10
1.4. SULFONATED ALL-AROMATIC POLYAMIDES ... 12
1.5. POLYMER ELECTROLYTE MEMBRANES ... 23
1.6. GRAPHENE OXIDE NANOCOMPOSITES ... 27
1.7. DISSERTATION OUTLINE ... 31
CHAPTER 2: OBSERVATION OF TRANSITION CASCADES IN A SHEARED LIQUID CRYSTALLINE POLYELECTROLYTE ... 35
x
2.2. EXPERIMENTAL ... 38
2.3. RESULTS AND DISCUSSION ... 40
2.3.1. Nonlinear Transient and Steady-State Rheology ... 40
2.3.2. Assignment of Director State Transition Cascade ... 50
2.3.3. Transient Shear Step-Downs ... 52
2.4. CONCLUSIONS ... 60
CHAPTER 3: FINGERPRINTING THE NONLINEAR RHEOLOGY OF A LIQUID CRYSTALLINE POLYELECTROLYTE ... 62
3.1. INTRODUCTION ... 62
3.2. EXPERIMENTAL ... 65
3.3. RESULTS AND DISCUSSION ... 67
3.3.1. Nonlinear Rheology in the Isotropic Phase ... 67
3.3.2. Nonlinear Rheology in the Nematic Phase ... 75
3.3.3. Alignment under Nonlinear Shear from Rheo-SANS ... 83
3.3.4. Transient Rheology of the Nematic Phase ... 88
xi
3.4. CONCLUSIONS ... 102
CHAPTER 4: IRREVERSIBLE SHEAR-ACTIVATED GELATION OF A LIQUID CRYSTALLINE POLYELECTROLYTE ... 103
4.1. INTRODUCTION ... 103
4.2. EXPERIMENTAL ... 104
4.3. RESULTS AND DISCUSSION ... 105
4.3.1. Rodlike Assemblies and Nematic Phase Diagram ... 105
4.3.2. Nonlinear Rheology and Irreversible Gelation ... 107
4.3.3. Linear Rheology and Structural Characterization ... 110
4.3.4. Shear Rate Dependence of the Induction Time ... 114
4.3.5. Mechanism of Gel Formation ... 116
4.4. CONCLUSIONS ... 117
CHAPTER 5: MECHANICAL REINFORCEMENT OF LIQUID CRYSTALLINE GRAPHENE OXIDE NANOCOMPOSITES ... 118
5.1. INTRODUCTION ... 118
xii
5.3. RESULTS AND DISCUSSION ... 127
5.3.1. Wide- and Small-Angle X-ray Scattering: Solid-State Nanocomposites ... 127
5.3.2. Nanocomposite Cross-section: SEM and AFM Modulus Mapping ... 132
5.3.3. Stress-Strain Behavior ... 134
5.3.4. Thermomechanical Analysis ... 137
5.4. CONCLUSIONS ... 141
CHAPTER 6: NANOFIBRILLAR IONIC POLYMER COMPOSITES ENABLE HIGH MODULUS ION-CONDUCTING MEMBRANES ... 143
6.1. INTRODUCTION ... 143
6.2. EXPERIMENTAL ... 145
6.3. RESULTS AND DISCUSSION ... 148
6.3.1. Polymer Electrolyte Membranes from PBDT and IL ... 148
6.3.2. Morphological Observations ... 153
6.3.3. Thermal Behavior ... 156
6.3.4. SAXS/WAXS Characterization ... 159
xiii
6.3.6. Time-Temperature Superposition ... 172
6.3.7. Stress-Strain Behavior ... 175
6.4. CONCLUSIONS ... 176
APPENDIX A: CHAPTER 2 SUPPORTING INFORMATION ... 178
APPENDIX B: CHAPTER 3 SUPPORTING INFORMATION ... 180
APPENDIX C: CHAPTER 4 SUPPORTING INFORMATION ... 188
APPENDIX D: CHAPTER 5 SUPPORTING INFORMATION ... 196
APPENDIX E: CHAPTER 6 SUPPORTING INFORMATION ... 207
xiv
LIST OF TABLES
Table 6.1. Tabulated peak positions of WAXS analysis of PBDT-IL composites. ... 164
Table D.1. Dilute solution viscometry results in concentrated (96%)
xv
LIST OF FIGURES
Figure 1.1. Schematic of the orientational and structural ordering
found in liquid crystal phases. ... 3 Figure 1.2. Description of a rodlike nematic phase at the (a) microscopic
and (b) mesoscopic length scales. ... 4 Figure 1.3. Concentration regimes of rodlike particles in solution. ... 6 Figure 1.4. Models for describing the molecular conformation of
liquid crystalline polymers within the nematic phase. ... 10 Figure 1.5. Chemical structures of some commonly studied
polyelectrolytes with flexible backbones. ... 11 Figure 1.6. Solution structure of polyelectrolytes in contrast to neutral polymers. ... 12 Figure 1.7. Chemical structures of the sulfonated derivatives of PPTA. ... 13 Figure 1.8. Synthetic route and chemical structure of the sulfo-aramid,
poly(2,2’-disulfonyl-4,4’-benzidine terephthalamide) (PBDT). ... 14 Figure 1.9. Phase diagram of PBDT in water as a function of temperature
and concentration. ... 15 Figure 1.10. Polarized optical micrographs of a neat PBDT solid-state film. ... 17 Figure 1.11. Morphological and structural differences between solid-state
films of PBDT and PBDI, an isotropic structural isomer. ... 20 Figure 1.12. X-ray scattering data and analysis leading to the double helical
structural model of PBDT self-assembly. ... 22 Figure 1.13. Liquid crystalline ion gels formed from PBDT and a
room-temperature ionic liquid (IL). ... 24 Figure 1.14. Molecular dynamics (MD) simulations of PBDT-IL composite materials. ... 26 Figure 1.15. Characteristics of single layer graphene oxide (GO) sheets
xvi
Figure 1.16. Schematic of the perpendicular orientation of the polymer
director (n!) and GO director (n"#) in the hybrid liquid crystalline phase. ... 30 Figure 2.1. Characterization of the transient and steady-state nonlinear
rheology of nematic PBDT rodlike assemblies in water. ... 41 Figure 2.2. Steady-state flow curve of nematic PBDT in H2O at
c = 1.9 wt.%, with the assignment of director state transitions. ... 51 Figure 2.3. Steady-state flow curve (top) and normalized transient shear
stress as a function of strain following shear step-down (bottom). ... 53 Figure 2.4. Correlation of the steady-state rheological properties with
the stress transients following shear step-down. ... 56 Figure 2.5. Fourier transform power spectra of transient stress following
shear step-downs at c = 1.9 wt.% ... 59 Figure 3.1. Nonlinear rheology of quiescently isotropic PBDT solutions in D2O. ... 68
Figure 3.2. Concentration scaling of Cross model results from fitting
the flow curves of quiescently isotropic PBDT solutions ... 71 Figure 3.3. Steady-state η and N$ as a function of shear rate of
quiescently isotropic and biphasic PBDT solutions under shear. ... 74 Figure 3.4. Steady-state η (top) and N$ (bottom) of fully nematic
PBDT solutions in D2O at solution concentrations of 21, 23 and 30 g L−1. ... 76
Figure 3.5. Semi-log representation of the steady-state η as a function
of shear rate for nematic PBDT solutions in D2O. ... 78
Figure 3.6. Steady-state η and N$ of liquid crystalline PBDT in D2O
as a function of shear rate for 38 and 45 g L−1. ... 82
Figure 3.7. Measurement of shear-induced alignment of nematic PBDT
in D2O using rheo-SANS. ... 84
Figure 3.8. Steady-state η and S$% as a function of shear rate for (a) 21,
(b) 30, and (c) 45 g L−1. ... 85
xvii
Figure 3.10. Normalized stress transient following shear step-down from
570 s−1 to the shear rate indicated in the figure for c = 21 g L−1. ... 92
Figure 3.11. Normalized stress transients following step-down from an initial shear rate of 180 s−1 for c = 30 g L−1. ... 95
Figure 3.12. Comparison of σ(t) and N1(t) transients following shear step-down. ... 96
Figure 3.13. Transient stress paths following shear step-down for c = 21 g L−1 from an initial shear rate of 570 s−1. ... 99
Figure 3.14. Transient stress paths following shear step-down for c = 30 g L−1 from an initial shear rate of 180 s−1. ... 100
Figure 4.1. Structure and nematic phase behavior of PBDT in salt-free water. ... 106
Figure 4.2. Nonlinear rheology of nematic PBDT solutions. ... 108
Figure 4.3. Linear rheology of PBDT shear-activated gels. ... 111
Figure 4.4. Induction time prior to shear-activated gelation at c = 30 wt.%. ... 115
Figure 5.1. Overview of synthesis of PBDT-LCGO hybrid liquid crystalline nanocomposites. ... 120
Figure 5.2. 2D wide-angle X-ray scattering (WAXS) of PBDT-rGO nanocomposite films. ... 128
Figure 5.3. 2D small-angle X-ray scattering (SAXS) images of a 1.8 vol.% rGO nanocomposite. ... 131
Figure 5.4. Morphological analysis of PBDT-rGO nanocomposites via SEM and AFM. .. 133
Figure 5.5. Stress-strain behavior of PBDT-rGO nanocomposites from uniaxial tension measurements. ... 135
Figure 5.6. DMTA and time-temperature superposition (TTS) analysis of PBDT-rGO nanocomposites. ... 138
xviii
Figure 6.2. Comparison of PBDT-IL composites to a comprehensive
literature compilation of PEMs and ion gels. ... 151 Figure 6.3. AFM of the PBDT-IL composite morphology. ... 154 Figure 6.4. AFM phase angle map of a 5 wt.% PBDT-IL
composite and idealized representation of the two-phase morphology. ... 156 Figure 6.5. DSC characterization of PBDT-IL composites. ... 157 Figure 6.6. SAXS analysis of PBDT-IL composites. ... 159 Figure 6.7. WAXS spectra of neat PBDT, PBDT-IL composites, and
neat IL measured in the perpendicular configuration. ... 163 Figure 6.8. Isochronal DMTA results of PBDT-IL composites. ... 166 Figure 6.9. Analysis of the thermo-mechanical relaxations of neat
PBDT and PBDT-IL composites. ... 170 Figure 6.10. TTS analysis of PBDT-IL composites. ... 172 Figure 6.11. Stress-strain measurement in uniaxial tension for
three samples of neat PBDT (top) and 20 wt.% PBDT-IL composite (bottom). ... 175 Figure A.1. Analysis of 1D scattering intensity of a nematic PBDT monodomain. ... 178 Figure A.2. Analysis of 2D scattering anisotropy of a nematic PBDT monodomain. ... 179 Figure B.1. Determination of the relaxation time by fitting the steady-state flow curve .... 180 Figure B.2. Linear oscillatory rheology frequency sweeps of G’ and G”
within the linear viscoelastic regime (strain amplitude = 10%) at 25 °C. ... 181 Figure B.3. Concentration scaling of G’ at 10 rad s−1 of quiescently
isotropic PBDT solutions. ... 182 Figure B.4. Intensity as a function of azimuthal angle at various shear
rates for c = 21 g L−1 PBDT solution. ... 183
Figure B.5. Intensity as a function of azimuthal angle at various shear
xix
Figure B.6. Transient shear stress and N$ following shear step-down
from a flow aligned state for c = 21 g L−1 PBDT solution. ... 185
Figure B.7. Transient shear stress and N$ following shear step-down
from a flow aligned state for c = 21 g L−1 PBDT solution. ... 186
Figure B.8. Transient shear stress and N$ following shear step-down
from a flow aligned state for c = 30 g L−1 PBDT solution. ... 187
Figure C.1. Stop-start test during shear-activated gelation, and final
shear-activated gel for c = 18 wt.%. ... 188 Figure C.2. TTS analysis of shear-activated PBDT gels. ... 188 Figure C.3. 1D SAXS intensity as a function of scattering vector of
PBDT pre-shear, low-viscosity solutions and shear-activated gels. ... 190 Figure C.4. Correlation length for PBDT solutions and shear-induced
gels versus concentration pre-shear and post-shear. ... 191 Figure C.5. 1D WAXS intensity for PBDT solutions and shear-induced
gels at 18 and 20 wt.% pre-shear and post-shear. ... 192 Figure C.6. Scanning electron microscopy (SEM) images of the cross-section
surface of a freeze-fractured 16 wt.% PBDT sample pre-shear and post-shear. ... 193 Figure C.7. Effect of salt on the structure and nonlinear rheology of PBDT solutions. ... 195 Figure D.1. Tapping mode AFM of neat PBDT film revealing slender
nanofibers with cross-sectional dimension between 50 and 200 nm. ... 196 Figure D.2. Thermogravimetric analysis of GO. ... 197 Figure D.3. Flake size analysis of GO by SEM. ... 197 Figure D.4. Scanning TGA at 10 °C min−1 of PBDT-GO nanocomposite
films after drying at 60 °C in air. ... 198 Figure D.5. Scanning TGA of a neat PBDT and 4 wt.% GO (2.4 vol.% rGO)
xx
Figure D.6. 1D WAXS lineouts of a neat PBDT film (radially averaged)
and a 1.8 vol.% rGO nanocomposite film with 30° sector averages. ... 199 Figure D.7. Representative 2D WAXS patterns of PBDT-rGO nanocomposite
films in the perpendicular configuration. ... 200 Figure D.8. Loss tangent over the temperature range of −30 to 110 °C in
5 °C intervals from 0.1 to 10 Hz. ... 202 Figure D.9. Arrhenius plots over the 𝛽-relaxation temperature range. ... 203 Figure D.10. Fitting and residuals of the 𝛽-relaxation using the
Havriliak-Negami function for the loss modulus master curves. ... 204 Figure D.11. Dilute solution viscometry of PBDT and PPTA in 96%
sulfuric acid at 25 °C. ... 206 Figure E.1. 1H NMR spectra of 0.1 wt.% PBDT in D
2O directly
after synthesis and purification. ... 207 Figure E.2. TGA of neat PBDT and corresponding PBDT-IL composites. ... 208 Figure E.3. AFM 3D topological scans of a 5 (left) and 70 (middle) wt.%
PBDT-IL composite compared to the 100 wt.% PBDT film (right). ... 208 Figure E.4. DSC 2nd heat thermograms at a rate of 2 °C min−1 for
neat [Emim][TfO] and with 3.4 and 6.8 wt.% of [Na][TfO].. ... 209 Figure E.5. Differential scanning calorimetry thermograms of a 5 wt.%
PBDT-IL composite at a heating rate of 2 °C min-1. ... 209
Figure E.6. WAXS of neat [Emim][TfO] and with the addition of 3.4 and
xxi
LIST OF ABBREVIATIONS AND SYMBOLS
Aramid All-aromatic polyamide
AFM Atomic force microscopy
𝑘' Boltzmann constant
DSC Differential scanning calorimetry DMTA Dynamic mechanical thermal analysis
𝐸 Elastic modulus
𝑆() Equilibrium scalar order parameter
𝜎* Equilibrium shear stress
𝑁$ First normal stress difference
𝑇+ Glass transition temperature
GO Graphene oxide
LCGO Liquid crystalline graphene oxide LCP Liquid crystalline polymer
𝐸" Loss modulus (tension)
𝐺" Loss modulus (shear)
𝑇, Melting temperature
𝒏 Nematic director
xxii
PBDT Poly(2,2-benzidine-4,4’-disulfonyl terephthalamide) PPTA Poly(p-benzidine terephthalamide)
𝑞 Magnitude of the scattering vector
rGO Reduced graphene oxide
𝐷-. Rotational diffusivity in dilute solution
𝐷<- Rotational diffusivity in semidilute solution Sulfo-aramid Sulfonated all-aromatic polyamide
𝑇 Temperature
TGA Thermogravimetric analysis
𝜂 Viscosity
LCP Liquid crystalline polymer
LCGO Liquid crystalline graphene oxide
𝑇, Melting temperature
𝑆$% Scalar order parameter in the 1—3 (flow—vorticity) plane SANS Small-angle neutron scattering
SAXS Small-angle X-ray scattering
𝜎, 𝜎/0 Shear stress
𝐸′ Storage modulus (tension)
𝐺′ Storage modulus (shear)
1
CHAPTER 1: INTRODUCTION
1.1. LIQUID CRYSTALS
Condensed phases of simple liquids, such as diatomic argon, have a relatively simple structure in comparison to crystalline solids, such as metals. Simple liquids have no long-range positional order, like a crystalline lattice, or orientational order, like magnetic dipole moments of ferromagnets. It is well-known that the mathematical form of the intermolecular potential energy dictates, to a large extent, the liquid structure and phase behavior.1 For simple liquids, their
structure arises from the well-known hard-core repulsion and van der Waals attraction, respectively, embodied in the classic Leonard-Jones potential energy
𝑉12 = 4𝜀 CD3-E$4− D3-E5G (Eqn. 1.1)
where 𝑉12 is the potential energy, 𝜀 is the depth of the potential energy well, 𝜎 is the distance at which the pair-wise potential is zero, and 𝑟 is the distance between the molecules.2 The r6$4
2
However, Nature uses more complex forms of pair-wise interactions in concert with anisotropic (i.e., non-spherical) molecular architecture that it uses to construct life as we know it. Anisotropic molecular architectures are found in a variety of natural molecules, e.g., lipids and peptides, and biological systems, e.g., tobacco mosaic virus.3, 4 In the case of rodlike particles,
shape anisotropy is present when the length 𝐿 far exceeds the diameter 𝐷, meaning the aspect ratio 𝑝 is much greater than unity. The ultimate function of these anisotropic molecules or biological systems strongly depends on their shape and chemical composition.
In a fluid of anisotropic molecules or particles, a first-order phase transition occurs above a critical concentration from the isotropic state to an anisotropic, or liquid crystalline, state.5, 6
Liquid crystals are intermediate states of matter that possess the fluidity of liquids, while possessing a variety of orientational and structural ordering (depending on the exact liquid crystal phase, see below) associated with solids. The liquid crystalline phase can be either lyotropic (containing solvent) or thermotropic (no solvent). A variety of anisotropic shapes, such as rods, disks, boomerangs, and hockey sticks can exhibit liquid crystalline phases.7 The
anisotropy of the properties of liquid crystalline phases has spawned a plethora of new technologies, from liquid crystal displays (LCDs) to high-strength body armor (e.g., Kevlar™), making them an extremely important class of functional and structural materials.
A variety of liquid crystalline phases can be obtained with increasing complexity, such as nematic, smectic, and columnar phases.5 A schematic depiction of the organizational differences
between liquid crystal phases is shown in Figure 1.1.8 Nematic liquid crystals exhibit
3
average rod orientation is defined as the director, denoted by 𝒏. The angular distribution function of individual rods and distribution of rod orientations with respect to the director is quantified through a scalar order parameter. For perfect rod alignment, the order parameter is unity, while for an isotropic distribution of rod orientations, it is zero. Higher order phases, such as the cholesteric phase, can exhibit helical trajectories of the director. In addition, the class of smectics, may exhibit positional ordering, and tilts of the molecular axis within smectics layers.
Figure 1.1. Schematic of the orientational and structural ordering found in liquid crystal phases. From left to right: nematic, cholesteric, smectic A and B, smectic C, columnar phases. The director (𝒏) denotes the average orientation of the constituent molecules/particles. The black dots for the cholesteric phase indicate the rotation of the director in a helical pattern, characterized by a pitch length. Smectic liquid crystals organize into layers, which can be positionally ordered or disordered, or feature a tilt axis. Columnar phases of disklike molecules/particles are characterized by a director oriented normal to the surface, which can be positionally ordered. Reprinted with permission under Creative Commons CC BY license from Elsevier, Journal of Molecular Liquids, Introduction to liquid crystals, Andrienko, D., 2018.
The first observations of liquid crystals were made on small molecules, but sufficiently rigid polymers also exhibit liquid crystallinity. The structure and properties of nematic liquid crystals composed of rodlike polymers is the focus of this Dissertation. Rodlike liquid crystal polymers (LCPs) have at least three important length scales that influence the bulk fluid properties. For the purposes of this work, we will focus our attention solely on lyotropic LCPs, more specifically, in the concentration regimes where the solvent makes up the large majority of the volume fraction.
nematic cholesteric smectic smectic B
smectic A
smectic C columnar
rectangular
hexagonal
herringbone
half pitch director
n n
4
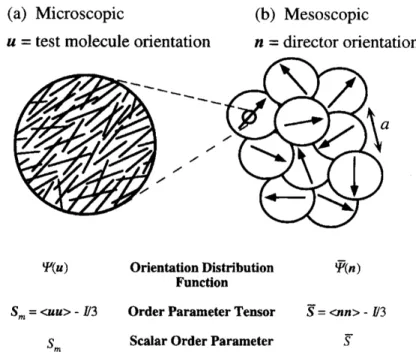
At the molecular level, chemical bonds and the polymer-solvent friction coefficient dictate the inherent rigidity of the polymer and its’ interactions with the surrounding solvent while undergoing translational or rotational motion. On microscopic length scales, the direction of average rod orientation is defined as the director, denoted by 𝒏, shown in Figure 1.2a. The breadth of the molecular orientational distribution function with respect to the director, 𝚿(𝒖), where 𝒖 is the orientation of a test molecule, is quantified through a scalar order parameter, 𝑆,. For perfect rod alignment with respect to the director, 𝑆, is unity, while it is zero for an isotropic distribution of rod orientations.
5
On mesoscopic length scales, nematic domains are pointed in arbitrary directions separated by disclination lines, i.e., discontinuities in the director field, shown in Figure 1.2b. As a result, in the absence of an applied field, a spatially heterogeneous “polydomain” defect texture (or Schlieren texture) is generally observed. The domain orientational distribution function, 𝚿< (𝒏), is similarly quantified through a scalar order parameter 𝑆̅, which similarly takes values from zero to unity for isotropic or perfect alignment, respectively. Generally, in the quiescent state, the presence of a polydomain defect texture results in LCPs having no global orientational order. This fact necessitates the use of external fields, such as electrical, magnetic, or shear, to produce macroscopic orientational order for fabrication of aligned materials, or to study the local degree of alignment. Due to the presence of interactions between neighboring nematic domains, the defect texture has a significant contribution to the stress tensor of LCPs. This elasticity that arises from the polydomain defect texture is one of the primary differences between LCPs and small-molecule LCs, and gives rise to some interesting rheological properties.
1.2. LIQUID CRYSTALLINE POLYMERS
Polymers that possess a high degree of intrinsic rigidity when dissolved in solution can be thought of as rodlike particles in a continuous medium. Prototypical examples of such polymers is the para-substituted all-aromatic polyamide (para-aramids), poly(p-phenylene terephthalamide) (PPTA, Kevlar®, Twaron®). The high rigidity of para-aramids requires strong
6
rigid polymer chain, with a modulus of ca. 230 GPa, to bear the tensile load.10 The molecular
alignment necessary for fabricating stiff and strong para-aramid fibers can only be attained when spun from the liquid crystalline state.11 However, it is well-known that LCP fibers are
hierarchically assembled into micro-, meso-, and macroscopic fibrils, whose organization and local orientation of polymer within the fibrils dictate the final mechanical properties after fiber spinning.12
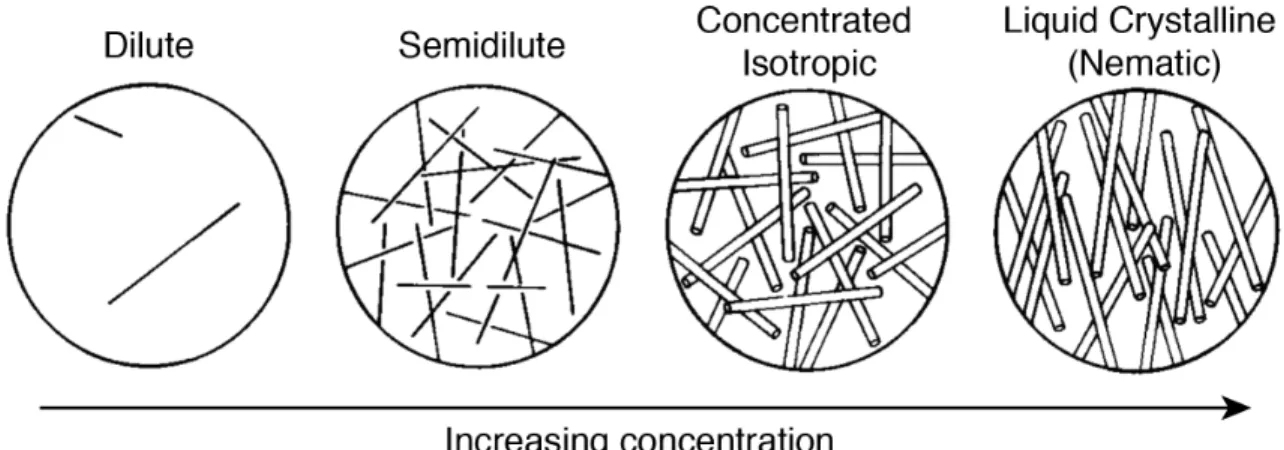
Four concentration regimes define the relevant solution structure of rodlike polymers, the (i) dilute, (ii) semidilute, (iii) concentrated isotropic, and (iv) liquid crystalline states, shown schematically in Figure 1.3.6
Figure 1.3. Concentration regimes of rodlike particles in solution. The dilute, semidilute, concentrated isotropic, and liquid crystalline phases are accessed by increasing the rod number density in solution. Reproduced with permission of the Licensor through PLSclear, Doi & Edwards 1986.6
7
neighboring rods. The rods undergo rotational diffusion with a diffusion constant in dilute solution 𝐷-. defined as
𝐷-. = 7!8
9" =
%7!8[;<(1/?)6A]
CD#1$ (Eqn. 1.2)
where 𝑘'𝑇 is the thermal energy, 𝜁- is the rod-solvent friction coefficient, 𝐿/𝐷 is the aspect ratio, 𝛾 is a geometrically specific constant, and 𝜂E is the solvent viscosity. The relaxation time of the rotational motion is 𝜏- = 1/(2𝐷-.), and thus scales as ~ 𝐿% in dilute solution. In comparison, the longest relaxation time 𝜏F in the Rouse model for flexible polymers exhibits a squared dependence on the degree of polymerization. Thus, the dynamics of rodlike polymers are more strongly dependent on the size of the polymer than in the case of flexible polymers. In this concentration regime, the viscosity increases linearly with concentration and the rodlike polymers do not interact.
Above a number density 𝑣$ ≈ 1/𝐿%, rods begin to overlap with one another and increasingly constrain their rotational motion. In this concentration regime, the solution is termed semidilute and the viscosity increases rapidly with concentration. Note that this definition is different than that used in defining the transition to semidilute solution for flexible polymers, where the overlap volume fraction is defined as 𝜙∗ = 𝑁𝑣,H</𝑉, where 𝑁 is the degree of polymerization, 𝑣,H< is the volume of a monomer, and 𝑉 is the volume of the polymer coil.13 As the concentration is
increased within the semidilute regime, the solution dynamics become strongly affected. In particular, the rotational diffusion coefficient in semidilute solution 𝐷<- is slowed down in comparison to 𝐷-., calculated as
8
where 𝑣 is the rod number density and 𝛽 is a positive, numerical prefactor. The value of 𝛽 is estimated to be on the order of 103—104. Recent experiments of rodlike fd virus particles in the
semidilute concentration regime provide evidence that the value of 𝛽 is near 1300.14 This
expression gives a very strong dependence of 𝐷<- on 𝐿, and thus on the molecular weight of the rodlike polymer, as 𝐿 ~ 𝑀.
At concentrations near 𝑣4 ≈ 1/𝐷𝐿4, excluded volume effects between rods become important and both the static and dynamical properties of the solution are affected. The rotational diffusivity is predicted to be hindered further with increasing concentration due to topological entanglements. Above a critical concentration, denoted 𝑣∗, 𝑐∗, or 𝜙∗, the rodlike polymers spontaneously align with their neighbors into a liquid crystalline phase.15, 16 In experimental
systems, non-ideal effects such as length dispersity, flexibility, and electrostatic interactions play a role in the critical concentrations for formation of the nematic phase.17-21 However, a widely
used expression for the onset of liquid crystallinity for rods of diameter 𝐷 and length 𝐿 is the so-called Onsager relation15, 16
𝜙∗ = I? 1 =
I
J (Eqn. 1.4)
where 𝑝 = 𝐿/𝐷 is the aspect ratio, or axial rigidity ratio. That is, the higher the aspect ratio, the lower the critical concentration for formation of the nematic phase. An alternative expression is given by Flory22
𝜙∗ = K JD1 −
4
JE (Eqn. 1.5)
9
length is proportional to the molecular weight, the onset of liquid crystallinity decreases inversely proportional with the molecular weight of the polymer.24
The solution conformation of LCPs is an important factor in their structure and rheology but has been largely neglected. Onsager and Flory both considered rigid rods and derived their theories for the nematic phase behavior using this model. Later work to describe the rheology of LCPs in the nematic phase assume rigid rods, which captures much of the salient features of LCP rheology.25-33 However, this oversimplification was noted and theories that incorporate flexibility
in the description of LCP rheology have been developed.34-36 Theory developed by Odijk37, 38
shows that even for polymers having a contour length much less than their persistence length, perfect rigidity is not realized. Small-angle neutron scattering (SANS) experiments on uniaxially aligned, contrast-matched solutions of PPTA in sulfuric acid by Picken et al. provided information on the single-chain conformation within the isotropic and nematic phases.39 These
authors found that the nematic environment had no effect on the persistence length of the PPTA chains, in contrast to the expectation that the nematic potential would extend the chain. Analysis of the radius of gyration parallel and perpendicular to the nematic director led these authors to conclude that hairpin defects must be present in the nematic. The significance of this work is that the confinement effect of the nematic potential does not completely prevent large angular excursions of the semirigid chain. Later work reported on the energies associated with such hairpins and their contribution to the physical properties of isotropic PPTA solutions.40 As such,
10
Figure 1.4. Models for describing the molecular conformation of liquid crystalline polymers within the nematic phase, ranging from idealized rigid rods (Onsager/Flory), semiflexible wormlike chains (Odijk, Khokhlov and Semenov), and wormlike chains with hairpin defects (Picken, Noirez, and Luckhurst). The arrows indicate the direction of the nematic director. Reprinted from Picken, S. J.; Noirez, L.; Luckhurst, G. R., Molecular conformation of a polyaramid in nematic solution from small angle neutron scattering and comparison with theory. J. Chem. Phys. 1998, 109 (17), 7612-7617., with the permission of AIP Publishing.39
1.3. POLYELECTROLYTES
Polyelectrolytes are polymers that bear electrically charged groups along the backbone, also referred to as polyions (polyanions and polycations for negative and positive backbone charges, respectively). Some commonly studied synthetic polyanions with flexible backbones are shown in Figure 1.5, while some commonly studied polyelectrolytes of biological origin include deoxyribonucleic acid (DNA), alginates, carrageenan, and carboxymethyl cellulose. One of the most important features of polyelectrolytes is that they are, in general, water soluble, while most synthetic polymers are not. That is, the addition of charges to the polymer backbone is crucial for water solubility. Polyelectrolytes are found throughout Nature, such as deoxyribonucleic acid (DNA) and proteins, and are utilized in a variety of industrial applications, such as flocculants for water purification.41 The effect of charges along the backbone has significant implications
with respect to inter- and intra-molecular interactions, and thus the polyelectrolyte conformation,
Onsager
Flory KhokhlovOdijk Semenov
Picken Noirez Luckhurst Rigid rods Semiflexible
11
solution structure and dynamics.42-44 As such, a fundamental understanding of polyelectrolyte
behavior is crucial from a scientific and technological perspective.
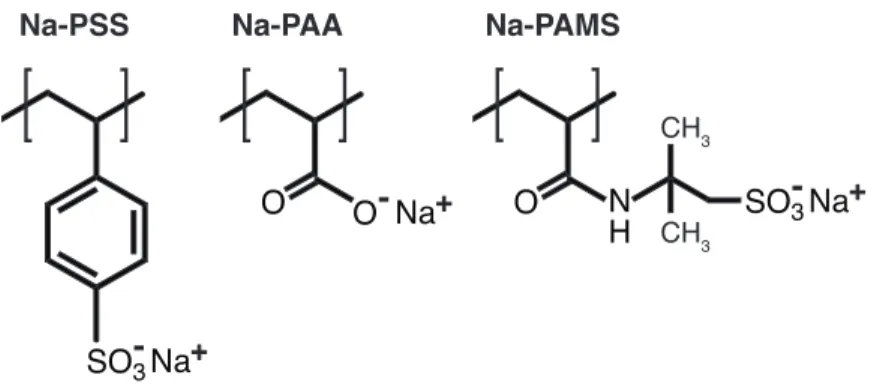
Figure 1.5. Chemical structures of some commonly studied polyelectrolytes with flexible backbones. Sodium poly(styrene sulfonate) (Na-PSS), sodium poly(acrylic acid) (Na-PAA), and sodium poly(2-acrylamido-2-methylpropanesulfonate) (Na-PAMS).
The electrostatic repulsion between chains gives rise to one of the most salient features of polyelectrolytes in comparison to neutral polymers. The high osmotic pressure of the counterions surrounding each chain prevents overlap of the correlation volumes, leading to a positional localization of the electrostatic correlation volumes, which contain the polyelectrolyte chains. This effect manifests itself as a peak in the small-angle scattering spectra for polyelectrolytes in contrast to neutral polymers, shown in Figure 1.6a.45 The correlation length 𝜉 between
polyelectrolyte chains can be found by application of Bragg’s law to the scattering peak, 𝜉 =
2𝜋/𝑞∗, where 𝑞∗ is the scattering vector of the peak. A schematic depiction of the structure of flexible polyelectrolytes is shown in Figure 1.6b, which show the correlation length between chains, and the electrostatic blob size, 𝜉(. Within the electrostatic blob, electrostatic interactions are completely screened such that the chain conformation at length scales smaller than 𝜉( is a self-avoiding random walk.46 Significant differences between neutral and charged flexible
Na-PSS Na-PAA
CH3
12
polymers are found, including the effect of concentration on the viscosity, terminal modulus, and longest relaxation time.43
Figure 1.6. Solution structure of polyelectrolytes in contrast to neutral polymers. (a) Difference between the structure factors of neutral polymers (red) and polyelectrolytes (blue). (b) Electrostatic blob model of flexible polyelectrolytes. Reprinted by permission from Springer, Rheologica Acta, Structure and linear viscoelasticity of flexible polymer solutions: comparison of polyelectrolyte and neutral polymer solutions, Ralph H. Colby, 2010.45
1.4. SULFONATED ALL-AROMATIC POLYAMIDES
Many polyelectrolyte systems, such as double stranded DNA,47 fd virus,48 and sulfonated
para-phenylenes,49 exhibit a high degree of intrinsic rigidity in solution. Such macromolecules can
13
derivatives of all-aromatic polyamides (sulfo-aramids). Picken and coworkers investigated sulfonated derivatives of PPTA, namely S-PPTA,50-52 S-invert-PPTA,53 and S2-PPTA,54 shown in
Figure 1.7, investigated for their envisioned use in proton exchange membranes. Picken and coworkers found that the location of the sulfonate strongly affected the solution properties and morphology of the resulting solid-state membranes.55 In the case of S-PPTA and S-invert-PPTA,
rodlike aggregates form in water with a diameter of ~30 Å and lengths on the order of 1 μm. In contrast, S2-PPTA forms molecular solutions that require solution concentrations of ca. 40 wt.%
to obtain a nematic phase. Thus, the self-assembly behavior of sulfo-aramids is apparently sensitive to the specific placement of charged groups along the polymer backbone. Moreover, the effect of either protonated or lithiated sulfonate groups was investigated using neutron scattering on S-PPTA. Mendes et al. found that increasing the fraction of sulfonates with Li+ counterions
enhanced the low-𝑞 scattering intensity, suggesting an enhancement of network formation of rodlike aggregates.
Figure 1.7. Chemical structures of the sulfonated derivatives of PPTA, (a) S-PPTA, (b) S-invert-PPTA, and (c) S2-PPTA synthesized by Picken and coworkers.50-54
n
S-PPTA
n
n a)
b)
c)
S-invert-PPTA
14
Sarkar and Kershner synthesized a variety of sulfo-aramids for their envisioned use as rheology modifiers in aqueous media, many of which were water soluble.56 Interesting
differences in the solution viscosities were observed depending on the particular chemical architecture that these authors suggested to arise from formation of higher-order assemblies, and possible helix formation. One such sulfo-aramid was the condensation product of 4,4’-diaminobiphenyl-2,2’-disulfonic acid (BDSA) and terephthaloyl chloride (TPC), poly(2,2’-disulfonyl-4,4’-benzidine terephthalamide) (PBDT), shown in Figure 1.8. An interfacial polymerization method was utilized with sodium carbonate acting as a base and polyethylene glycol (PEG300) as a phase-transfer catalyst. The viscosity dependence on the concentration of PBDT exhibited a maximum near 3 wt.% in salt-free water and decreased with increasing concentration, suggesting the formation of an anisotropic liquid crystalline phase.
Figure 1.8. Synthetic route via low-temperature interfacial polycondensation and chemical structure of the sulfo-aramid, poly(2,2’-disulfonyl-4,4’-benzidine terephthalamide) (PBDT).56
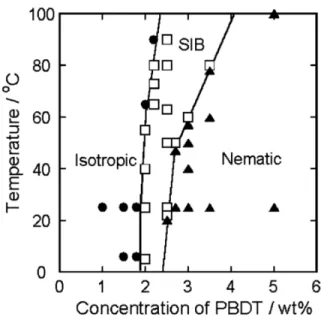
Funaki et al. reported a phase map of PBDT that showed the onset of shear-induced birefringence at ca. 2 wt.% at room temperature, shown in Figure 1.9.57 An equilibrium nematic
phase was observed at a concentration of ca. 2.5 wt.%. The concentration regime where coexistence of isotropic and nematic phase exist was not reported in this publication, but a fully nematic polarized optical micrograph at 5 wt.% was presented. For solutions above 1 wt.%, the addition of monovalent salt, NaCl, was found to increase the viscosity of the solutions, while at a
n PBDT
BDSA
Cl Cl
H2 H2
TPC
+ Na2CO3/PEG300
15
solution of 0.1 wt.%, addition of salt reduced the viscosity. This result was interpreted by invoking the formation of a mesoscopic network structure upon the addition of NaCl above a critical concentration through hydrophobic and hydrogen bonding interactions. Later work by Yang et al. further studied the influence of salt on the solution structure of PBDT through dynamic light scattering, viscometry, and cryo-TEM.58 These authors found a variety of unusual
structures through TEM with increasing amounts of salt. However, the influence of the TEM sample preparation cannot be neglected in this case, as sample preparation in this work involved the use of a heavy metal staining agent and blotting polymer solutions to dry prior to TEM observations.
16
Later work by Wu et al. reported small-angle X-ray scattering and cryo-TEM measurements on PBDT solutions in salt-free water.59 The onset of liquid crystallinity was reported at 2 wt.% and a
biphasic regime up to 6 wt.%. Both isotropic and nematic solutions of PBDT in water exhibited a peak in their scattering function, typical of polyelectrolytes, corresponding to the lateral correlation length between rods. Above 2 wt.%, the scattering peak was anisotropic, evidencing the nematic orientational ordering of the solution. The scaling exponent for the concentration dependence of the correlation length, predicted as 𝑐6$/4, was found as 𝑐6..%M. The authors suggested that this discrepancy originated from the self-assembly of PBDT into rodlike aggregates, thus decreasing the effective concentration of particles. However, it is now known that deviations from the 𝑐6$/4 to lower values originate from macromolecular clustering that arises from the solvation of counterions, resulting in long wavelength concentration fluctuations.60 This clustering results in a decrease in the scaling exponent, as scaling theory of
de Gennes assumed that the polyelectrolyte solutions were homogeneous.61 Thus, it is evident
that macromolecular clustering due to counterion solvation is present in PBDT solutions.
Wang et al. investigated the role of molecular orientation on the dynamics of water and counterions within isotropic and nematic PBDT solutions.62 The authors combined polarized
optical microscopy, pulsed-field-gradient (PFG) NMR diffusometry, 2H NMR spectroscopy, and
small-angle X-ray scattering to quantify the diffusion coefficients of Na+, the orientation of probe
D2O solvent molecules, and quantify the orientational order of the nematic phase. Similar to the
results of prior workers, they observed birefringence under POM consistent with a nematic phase above a critical concentration, which was further confirmed by splitting of the D2O peaks of the 2H NMR spectra. Here, an I-N transition concentration of 1.2 wt.% was reported with a fully
17
2.5—3 wt.%. These differences were attributed to variations in the polymer molecular weight that presumably have an influence on the self-assembled PBDT rod length. Solid-state films of PBDT exhibited Schlieren textures that are typical of nematic liquid crystals, indicating that the nematic order is maintained in the films, see Figure 1.10.
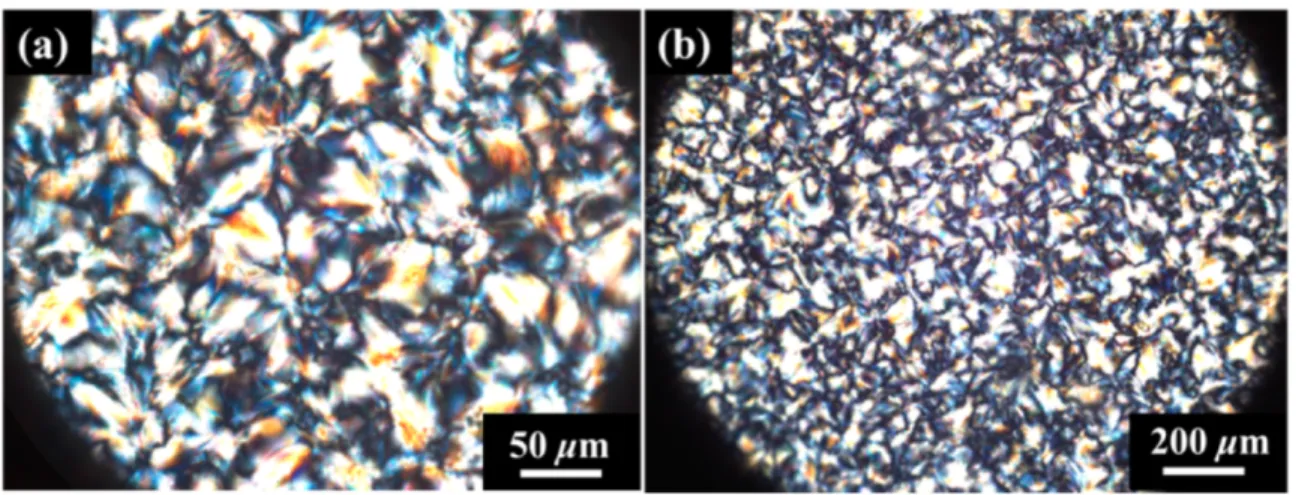
Figure 1.10. Optical micrographs under crossed polarizers of a neat PBDT solid-state film drop casted from a 6 wt.% PBDT solution at room temperature, exhibiting birefringent domains at (a) 40x and (b) 10x magnification. Reprinted with permission from Wang, Y.; Gao, J.; Dingemans, T. J.; Madsen, L. A., Molecular Alignment and Ion Transport in Rigid Rod Polyelectrolyte Solutions. Macromolecules 2014, 47 (9), 2984-2992. Copyright 2014 American Chemical Society.62
In solution, the Na+ counterions in PBDT solutions may either reside strongly localized, or
condensed, near the charged groups or remain free to diffuse. Understanding the extent to which counterions are condensed along the polymer backbone is important for understanding the mechanisms controlling ion transport in PBDT solutions. In this context, Manning theory of counterion condensation63 was used by Wang et al. to calculate whether or not the counterions
localize along the backbone expressed through the charge parameter, 𝜉, given as
𝜉 =ICO(%N
18
where 𝑒 is the elementary charge, 𝜀. and 𝜀 are the absolute and relative dielectric constants, 𝑘'is the Boltzmann constant, 𝑇 is the temperature, 𝑙 and 𝛼 are the repeat unit length and the number of charges per repeat unit, respectively. In the case of 𝜉 < 1, counterions are assumed to be subject to Brownian motion and are uncondensed, while for 𝜉 > 1 a certain fraction of counterions become condensed along the chain. Their motion is not eliminated in the condensed case, but becomes restricted to be along the long axis of the chain. Note that 𝜉 is independent of polymer concentration and thus is an intrinsic property of the polyelectrolyte in question. However, it is known that the fraction of condensed counterions on a solution of charged rigid-rods in fact depends on the separation distance.64
Regardless, from the consideration of a single PBDT chain, one can either treat the two sulfonates per repeat unit as one or two charges. These two considerations result in calculated charge parameters of 1.78 or 0.89, respectively. However, if a PBDT helical dimer is considered (see below for discussion on PBDT self-assembly), the results become 3.56 and 1.78, both values being above the critical value for the onset of counterion condensation. Thus, based on this theory, counterions are expected to condense along the backbone of PBDT rodlike assemblies. Experimentally, the lower values of the diffusion coefficient for Na+ ions in PBDT solutions as
measured by NMR, in comparison to pure NaCl solutions, is consistent with some fraction of counterions being condensed along the PBDT backbone that restricts their free diffusion.
The degree of orientational ordering of PBDT rods within the nematic phase was elucidated through a combination of 2H NMR measurements and small-angle X-ray scattering (SAXS).
19
was 0.61 and plateaued at 0.79 at 4 wt.%. A deuterated version of PBDT, d-PBDT, was also synthesized and the quadrupolar splitting of the deuterons resulted in similar order parameters found through this independent method. The high order parameter of the PBDT nematic monodomain evidences the high aspect ratio of the rodlike particles.
Gao et al. investigated membranes fabricated from liquid crystalline PBDT and a structural isomer, poly(2,2’-disulfonyl-4,4’-benzidine isophthalamide) (PBDI) for application as proton exchange membranes.65 The meta-linkage of the diacid chloride used in the synthesis of PBDI, in
comparison to the para-linkage of the diacid chloride for PBDT, results in a kinked molecular geometry. This kinked molecular geometry prevents the formation of a nematic liquid crystalline phase and instead isotropic physical gels are formed at low concentrations.65, 66 . The
cross-sections of the two films after freeze fracturing are shown in Figure 1.11, where PBDT membranes possess high in-plane alignment, while PBDI films were isotropic as measured by X-ray scattering. These authors reported water diffusion coefficients for neat polymer membranes and membranes with increasing degrees of ionic crosslinking with the divalent cation, Ba2+. The
20
Figure 1.11. Morphological and structural differences between solid-state films of PBDT, a liquid crystalline (LC) sulfo-aramid, and PBDI, an isotropic structural isomer. Cross-sectional scanning electron micrographs of neat (a) PBDT and (b) PBDI. Wide-angle X-ray scattering (WAXS) in the (c) through-plane direction shows a low degree of anisotropy, while the (d) in-through-plane scattering exhibits high anisotropy. WAXS of PBDI films in the (e) through-plane and (f) in-plane directions are consistent with an isotropic polymer orientation distribution function. Reprinted from J. Membr. Sci., 489, Gao, J.; Wang, Y.; Norder, B.; Garcia, S. J.; Picken, S. J.; Madsen, L. A.; Dingemans, T. J., Water and sodium transport and liquid crystalline alignment in a sulfonated aramid membrane, 194-203, Copyright 2015, with permission from Elsevier.65
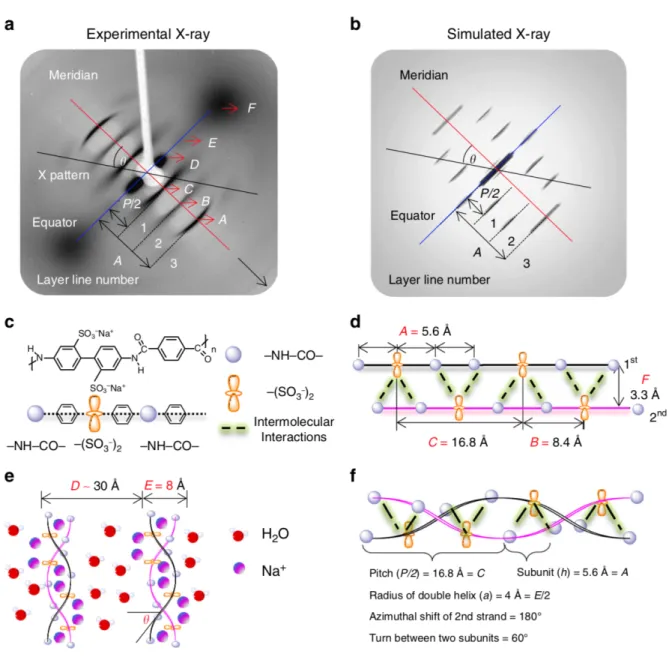
While analysis of the solution structure had been undertaken by prior authors, the exact structure of PBDT supramolecular assemblies was still uncertain. Wang et al. reported a combination of X-ray scattering, NMR, and molecular dynamics (MD) simulation results that support a double helical model for the self-assembly of PBDT in aqueous solution.67 Figure
1.12a shows experimental X-ray scattering results of a magnetically aligned monodomain of PBDT at 20 wt.% in water. A simulated X-ray scattering pattern of a double helical structure is
a) b)
21
22
23 1.5. POLYMER ELECTROLYTE MEMBRANES
With the knowledge of the structure and molecular alignment of PBDT rods in solution and the solid-state established from these earlier works, Wang et al. prepared a novel type of ion gel with PBDT and a room-temperature ionic liquid (IL).68 Ion gels fabricated with ILs are of interest for
their use in a variety of transport applications, such as solid-state battery membranes, proton exchange membranes, and gas separation membranes. A combination of high modulus, derived from the polymer, and high ionic conductivity, derived from the IL, is considered to be a key factor in designing next-generation devices for energy storage and generation. In this work, an IL was poured on top of a magnetically aligned nematic PBDT in water within a 5 mm glass tube and a viscoelastic interface forms between the two solutions, preventing convective mixing. Instead, due to the concentration gradients set up by this process, the IL and Na+ ions undergo an
ion exchange process, shown in Figure 1.13a. After equilibration, a portion of the native Na+
24
Figure 1.13. Liquid crystalline ion gels formed from PBDT and a room-temperature ionic liquid (IL). (a) Ion exchange between the Na+ ions within the nematic PBDT monodomain and the IL phase in the
presence of a magnetic field. (b) After ion exchange, IL condenses along the backbone of the PBDT helical assemblies. (c) Solid ion gel after ion exchange of the Na+ counterions with IL. The polymer
chains are nematically aligned along the long axis of the cylinder. Reprinted from Adv. Mater., 28, Wang, Y.; Chen, Y.; Gao, J.; Yoon, H. G.; Jin, L.; Forsyth, M.; Dingemans, T. J.; Madsen, L. A., Highly Conductive and Thermally Stable Ion Gels with Tunable Anisotropy and Modulus, 2571-2578, Copyright 2016, with permission from John Wiley & Sons, Inc.68
The ionic conductivity of the IL within the polymer matrix and electrochemical stability of these materials was investigated with PFG NMR. At polymer concentrations of 5 wt.%, the ionic conductivity was ~8 mS cm−1 and was isotropic with respect to the initial alignment direction. At
a higher concentration of 21 wt.%, the ionic conductivity was reduced to 4 mS cm−1 along the
alignment direction with an anisotropy ratio of ~3.5. Note that the pure IL possesses an ionic conductivity of 11 mS cm−1, meaning that the ion transport within the PBDT-IL materials is only
25
up to 2 GPa at room temperature. This extreme combination of both high ionic conductivity and high elastic modulus suggests a promising route towards high-performance membrane materials utilizing PBDT and ionic liquids.
The role of hydrogen bonding on the physical properties of these PBDT-IL gels was investigated by attempting to fabricate the gels using D2O instead of H2O. As is well-known, the
shorter O-D bond length in comparison to O-H results in D2O solutions exhibiting stronger
hydrogen bonding interactions than H2O. Interestingly, the authors report that they were not able
to prepare well-formed gels while using D2O instead of H2O. Thus, they proposed that a balance
of hydrogen bonding and electrostatic interactions plays a critical role in the development of the PBDT-IL gels.
In light of this experimental data on high ionic conductivity and high modulus PBDT-IL materials, molecular dynamics (MD) simulations were carried out by Yu et al. to investigate the new PBDT-IL composites.69, 70 The authors sought to understand the structure and dynamics of
the IL cations and anions in the vicinity of the rodlike polymer and what the influence of the residual Na+ cations is on these properties. The observation window of the MD simulation is
26
Figure 1.14. Molecular dynamics (MD) simulations of PBDT-IL composite materials. (a) Observation window of rodlike PBDT in the presence of a sea of ionic liquid. (b) Ion density map of cations and (c) anions within the interstitial volume between the PBDT rods. The units of the color scale is nm−3.
Adapted with permission from Yu, Z.; He, Y.; Wang, Y.; Madsen, L. A.; Qiao, R., Molecular Structure and Dynamics of Ionic Liquids in a Rigid-Rod Polyanion-Based Ion Gel. Langmuir 2017, 33 (1), 322-331. Copyright 2017 American Chemical Society.
By mapping out the spatial distribution of both cations and anions, shown in Figure 1.14b and Figure 1.14c, respectively, MD simulations showed the formation of ordered layers around the PBDT rods. Along the main polymer chain, cations strongly localized near the negatively charged sulfonates and anions occupied locations near the uncharged residues, forming a mixed nearest neighbor coordination shell. Past the nearest neighbor correlations, a distinct organization of cations and anions is observed, leading the authors to conclude that the formation of a long-range electrostatic network is, in part, responsible for the high mechanical properties of the PBDT-IL composite materials. However, in these simulations it was assumed that the rods are mobile, not in physical contact with one another, regularly spaced, and spatially homogeneous in these simulations. The extent to which these are valid requires more detailed analysis of the structure and properties of PBDT-IL composites.
27 1.6. GRAPHENE OXIDE NANOCOMPOSITES
A major research thrust in the materials science community is the design of polymer nanocomposite with enhanced mechanical and thermal properties over the native polymer. Graphene, single sheets of sp2 carbon, is an attractive nanomaterial for use in reinforcing
polymers due to its high elastic modulus (𝐸 ~ 1 TPa), ultimate strength (𝜎 ~ 130 GPa), thermal and barrier properties.71 However, its’ tendency to aggregate into 3D stacks, i.e., graphite, at high
concentrations reduces the specific surface area and allows inter-sheet sliding via weak van der Waals interactions to dominate as a failure mechanism, rather than bond scission.72 Both of these
effects cause a reduction in reinforcement efficiency, and typically an optimal concentration is found for mechanical properties. As a result, graphene oxide (GO), obtained by chemical oxidation of graphene, has been explored as a nanofiller instead of graphene. This achieves two goals simultaneously, (i) allowing facile dispersion of single layer sheets in polar solvents, including water,73 and (ii) improved polymer-nanofiller interfacial adhesion due to physical
interactions between GO functional groups and polymer.74 However, GO has a lower modulus (𝐸
~ 200—250 GPa) than graphene as a result of partial sp3 hybridized and lattice defects arising
from the oxidation process,75, 76 reducing the maximum theoretical reinforcement in comparison
to graphene. In 2011, several reports of liquid crystalline graphene oxide (LCGO) emerged, composed of aqueous dispersions of oxidize graphene sheets.77-82 The single sheets of GO have
high aspect ratio, with lateral dimensions on the 1—10 μm scale, and thickness of 0.8 nm, resulting in an aspect ratio of ca. 103. The large aspect ratio enables the formation of a nematic
28
Figure 1.15. Characteristics of single layer graphene oxide (GO) sheets that form a phase of liquid crystalline graphene oxide (LCGO) in water. (a) Atomic force microscopy of single layer graphene oxide sheets deposited on mica. (b) Birefringent dispersions of liquid crystal graphene oxide dispersions in water viewed through crossed polarizers with increasing concentration. (c) Schematic of the orientational order of LCGO sheets within the nematic phase. Reprinted with permission from Xu, Z.; Gao, C., Aqueous Liquid Crystals of Graphene Oxide. ACS Nano 2011, 4, 2908-2915. Copyright 2011 American Chemical Society.
All reported investigations to date utilizing lyotropic LCGO have combined this material with polymers that are isotropic, i.e., non-liquid crystalline. In one of the first reports of LCGO in 2011, poly(acrylic acid) (PAA) was mixed with LCGO in aqueous solution and hand drawing was used to obtain a nanocomposite fiber.79 This fiber was birefringent under crossed polars,
attributed to the nematic-like orientation of LCGO along the fiber axis. This result inspired a number of reports attempting to produce improved nacre-mimetic fibers consisting of polymer-LCGO, with a “brick-and-mortar” internal structure.83-86 Hyperbranched polyglycerol-LCGO
(HPG-LCGO) wet-spun nanocomposite fibers were prepared by Hu et al. and achieved a Young’s modulus of 8 GPa and tensile strength of 125 MPa.83 Ionic crosslinking with a divalent
cation, Mg2+, slightly increased the modulus and tensile strength of the nanocomposite fiber to 10
GPa and 145 MPa, respectively. Later work by the same group demonstrated that using ultra-large LCGO could produce HPG-LCGO nanocomposite fibers with tensile strengths as high as
29
555 MPa.84 Chemical crosslinking with glutaraldehyde (GA) provided a further increase in
tensile strength to 652 MPa.84
Liquid crystal phases of poly(acrylonitrile) (PAN) functionalized LCGO in polar organic solvents were obtained for the first time by Liu et al., and fibers spun from this nanocomposite LC dope achieved a tensile strength as high as 542 MPa and a Young’s modulus of 8 GPa.86
Stiffer PAN-LCGO fibers (80 wt% LCGO, 20 wt% PAN) were obtained by Kim et al. with a Young’s modulus as high as 19 GPa, but the tensile strength was only 220 MPa.87 Using
elastomers, Seyedin et al. utilized LCGO-driven alignment for the mechanical reinforcement of polyurethane (PU) nanocomposite fibers.88 The authors investigated the role of flake size on
mechanical reinforcement efficiency and found that the best results were obtained for the largest flake sizes. Another contribution by the same group demonstrated that thermal reduction of PU-LCGO fibers enables electrically conductive elastomer with linear strain sensing abilities up to 70% strain.89
LCGO’s self-alignment capabilities provides a facile route for large-scale production of aligned nanocomposite films. Towards this end, Yousefi et al. fabricated polyurethane nanocomposites incorporating large-flake LCGO.90 These nanocomposite films exhibited
enhanced in-plane flake alignment at high LCGO concentration, which was confirmed by polarized Raman spectroscopy and in-plane electrical conductivity measurements. Later work by these authors explored epoxy nanocomposites produced by the same method and indicated that this strategy is generalizable to other polymer systems, and useful for applications such as electromagnetic interference shielding.91, 92 In fact, the self-alignment property of LCGO may
30
Lee et al. fabricated elastomeric poly(dimethylsiloxane) (PDMS) nanocomposites by freeze-drying LCGO films to obtain aligned, porous films and backfilled the material with PDMS precursor.94 These studies have demonstrated that LCGO can be incorporated into polymer
matrixes which promote in-plane alignment during film formation.
Recently, Hegde et al. reported that mixtures of the nematic phase of PBDT and LCGO results in a stable, hybrid liquid crystalline phase that exhibits biaxiality (hN
b) above a critical
concentration, see Figure 1.16.66 A biaxial phase of rodlike and disklike mesogens, where the
directors of the rods and disks are orthogonal, is theoretically predicted to occur over a specific concentration regime.95, 96 When the concentration of PBDT was too low to form a nematic
phase, the polymer simply caused flocculation of GO, suggesting that the nematic phase of PBDT is necessary for stabilization of the hybrid nematic phase. Film casting of the hN
b phase
resulted in solid-state nanocomposites that exhibited significant enhancement of the mechanical properties over the neat polymer. In contrast, when the hybrid nematic dispersions were not in the hN
b phase, no mechanical reinforcement was observed.
31
In summary, we have reviewed the preceding literature that reported on the solution structure and applications of the sulfo-aramid, PBDT. However, several open questions remain with respect to the structure, self-assembly and rheological behavior of PBDT solutions that have yet to be elucidated. These questions have significant implication for the processing, solid-state structure, and mechanical properties of PBDT materials that will impact their performance in applications.
1.7. DISSERTATION OUTLINE
While the effect of concentration and ionic strength on the viscosity of PBDT solutions has been reported using capillary viscometry, a thorough understanding of the rheological behavior of PBDT is lacking. In Chapter 2, we present the first rheological measurements of fully nematic PBDT solutions in water. Under steady shear, we observe anomalous shear thickening behavior, followed by a hesitation in the viscosity accompanied by an extremely narrow range of negative first normal stress difference. The Peclet number (𝑃𝑒, shear rate normalized by rod rotational diffusivity) for the onset of shear thickening is in agreement with predictions from previous, high-resolution numerical simulations of the Doi-Edwards-Hess kinetic theory. We interrogate these dynamic responses through shear step-down experiments, revealing a complex evolution of transient responses. Detailed analysis of the stress transients provides compelling evidence that the nematic director undergoes a cascade of transitions and coexistence of periodic states known as kayaking, tumbling, and wagging, before transitioning to steady flow alignment above a critical shear rate. Our results on nematic PBDT solutions reveal the nature of periodic director states and introduce a new model system to study the complex rheology of LCPs.
32
under shear. The concentration dependence of the zero-shear viscosity, longest relaxation time, and terminal modulus of quiescently isotropic solutions are compared to the Doi-Edwards theory for hard rods. Within the concentrated isotropic regime, we find a non-monotonic shear rate dependence of the first normal stress difference, reminiscent of a sheared nematic phase. In the fully nematic phase, we investigate the steady-state and transient nonlinear rheological measurements to characterize the flow behavior. The steady-state viscosity as a function of shear rate is characterized by anomalous shear thickening behavior, which we assign as originating from the kayaking response of the nematic director. Utilizing transient shear step-down experiments, we characterize the response of the nematic director by constructing dynamic stress paths, where the shear stress is plotted as a function of the first normal stress difference. The rotation direction of the stress path indicates the relative importance of the viscous and elastic contributions to the stress tensor, which we find undergoes a transition from elastic to viscous at the onset of shear thickening. We conclude that the observed shear thickening behavior of nematic PBDT solutions arises from viscous stress contributions due to director kayaking, rather than an elastic stress contribution due to broadening of the molecular ODF under shear.
33
positional correlations and nematic orientational ordering. At a fixed concentration, the induction time prior to gelation decreases exponentially with the shear rate, reminiscent of a thermally activated Arrhenius process. This result indicates that shear-activated thermalization of the electrostatically stabilized rods overcomes the energy barrier for rod-rod contact, enabling rod fusion and subsequent irreversible network formation. To our knowledge, this is the first example of irreversible shear-activated gelation in a liquid crystalline polymer, possibly providing a novel route towards a unique microstructure of physically crosslinked rodlike polymer.