Association Between Variants in Arsenic
(
1
3 Oxidation State) Methyltranserase (AS3MT)
and
Urinary Metabolites of Inorganic Arsenic: Role of
Exposure Level
Xiaofan Xu,* Zuzana Drobn
a,
†V. Saroja Voruganti,* Keri Barron,*
Carmen Gonz
alez-Horta,
‡Blanca S
anchez-Ram
ırez,
‡Lourdes Ballinas-Casarrubias,
‡Roberto Hern
andez Cer
on,
§Dami
an Viniegra Morales,
§Francisco A. Baeza Terrazas,
§Mar
ıa C. Ishida,
‡Daniela S. Gutie´rrez-Torres,
‡R. Jesse Saunders,* Jamie Crandell,
¶,jjRebecca C. Fry,
jjjDana Loomis,
jjjjGonzalo G. Garc
ıa-Vargas,
#Luz M. Del Razo,** Miroslav St
yblo,* and Michelle A. Mendez*
,††,1*Department of Nutrition, Gillings School of Global Public Health;
†Department of Biological Sciences College
of Sciences, North Carolina State University, North Carolina;
‡Programa de Maestr
ıa en Ciencias en
Biotecnolog
ıa, Facultad de Ciencias Qu
ımicas, Universidad Aut
onoma de Chihuahua, Chihuahua, Me´xico;
§
Colegio de Me´dicos Cirujanos y Home
opatas del Estado de Chihuahua, A.C;
¶
Department of Biostatistics
Gillings School of Global Public Health;
jjSchool of Nursing;
jjjDepartment of Environmental Sciences and
Engineering, Gillings School of Global Public Health and Curriculum in Toxicology, University of North
Carolina, Chapel Hill, North Carolina;
jjjjInternational Agency for Research of Cancer, Monographs Section,
Lyon Cedex, France;
#Facultad de Medicina, Universidad Ju
arez del Estado de Durango, G
omez Palacio,
Durango, Me´xico; **Departamento de Toxicolog
ıa, Centro de Investigaci
on y de Estudios Avanzados del
Instituto Polite´cnico Nacional, Me´xico DF, Me´xico; and
††Carolina Population Center and Lineberger Cancer
Center, University of North Carolina, Chapel Hill, North Carolina
1To whom correspondence should be addressed at Department of Nutrition Gillings School of Global Public Health, University of North Carolina, Chapel
Hill, North Carolina. E-mail: [email protected].
ABSTRACT
Variants inAS3MT, the gene encoding arsenic (þ3 oxidation state) methyltranserase, have been shown to influence patterns of inorganic arsenic (iAs) metabolism. Several studies have suggested that capacity to metabolize iAs may vary depending on levels of iAs exposure. However, it is not known whether the influence of variants inAS3MTon iAs
metabolism also vary by level of exposure. We investigated, in a population of Mexican adults exposed to drinking water As, whether associations between 7 candidate variants inAS3MTand urinary iAs metabolites were consistent with prior studies, and whether these associations varied depending on the level of exposure. Overall, associations between urinary iAs metabolites andAS3MTvariants were consistent with the literature. Referent genotypes, defined as the genotype
VCThe Author 2016. Published by Oxford University Press on behalf of the Society of Toxicology. All rights reserved. For Permissions, please e-mail: [email protected]
112
doi: 10.1093/toxsci/kfw112
previously associated with a higher percentage of urinary dimethylated As (DMAs%), were associated with significant increases in the DMAs% and ratio of DMAs to monomethylated As (MAs), and significant reductions in MAs% and iAs%. For 3 variants, associations between genotypes and iAs metabolism were significantly stronger among subjects exposed to water As>50 versus50 ppb (water As X genotype interactionP<.05). In contrast, for 1 variant (rs17881215), associations were significantly stronger at exposures50 ppb. Results suggest that iAs exposure may influence the extent to which severalAS3MTvariants affect iAs metabolism. The variants most strongly associated with iAs metabolism—and perhaps with susceptibility to iAs-associated disease—may vary in settings with exposure level.
Key words:Arsenic (þ3 oxidation state) methyltranserase polymorphism; arsenic; drinking water; urinary arsenic; arsenic metabolites; methylation capacity.
Chronic exposure to inorganic arsenic (iAs) has been associated with increased risk of several types of cancer, with a substantial literature suggesting iAs exposure may also be associated with other health outcomes, including cardiovascular diseases and diabetes (Iarc Working Group on the Evaluation of Carcinogenic Risks to Humans, 2012;Maullet al., 2012;Moonet al., 2012;Sung et al., 2015). There are multiple sources of exposure to iAs, in-cluding contaminated drinking water, food, soil, and air, as well as occupational settings (Iarc Working Group on the Evaluation of Carcinogenic Risks to Humans, 2012). Contaminated drinking water is a common source of high exposure, and is a wide-spread public health problem, estimated to affect around 140 million people worldwide (Iarc Working Group on the Evaluation of Carcinogenic Risks to Humans, 2012;Smithet al., 2000). There is growing evidence that, along with levels of expo-sure to iAs, inter-individual variation in the capacity to metabo-lize iAs is an important determinant of toxicity, and thus of health risks related to this exposure (Pierceet al., 2013;Sunet al., 2007). Using measures of proportions of iAs metabolites in urine, which have been postulated to reflect capacity to metabo-lize iAs, numerous studies suggest that individual variation in patterns of iAs metabolism may influence susceptibility to ad-verse health outcomes among subjects exposed to iAs in drink-ing water (Chen et al., 2013;Mendez et al., 2015), or may be directly associated with health risks (Del Razoet al., 2011;Huang et al., 2007;Kuoet al., 2015;Lindberget al., 2008;Sunet al., 2007). Although the indicators of iAs metabolism most strongly re-lated to risk have varied, associations between measures of iAs metabolism and health risks have been reported in settings with widely varying levels of iAs exposure (Chenet al., 2005, 2013;Del Razoet al., 2011;Engstromet al., 2015;Lindberget al., 2008;Mendezet al., 2015).
In humans, the primary pathway for metabolism of iAs in-volves sequential methylation to form monomethylated As (MAs) and dimethylated As (DMAs) metabolites, which are ex-creted in the urine (Thomaset al., 2007). Higher percentages of total urinary As represented by DMAs (DMAs%), and lower per-centages of MAs or the unmethylated iAs (MAs% and iAs%, re-spectively) in urine have been hypothesized to be indicators of higher capacity to metabolize iAs (Thomaset al., 2007;Tseng, 2007;Vahter, 2002). The ratios of MAs to iAs (MAs/iAs) and of DMAs to MAs (DMAs/MAs) in urine have also been widely used as indicators of capacity for the first and second methylation steps. However, the measures of iAs metabolism most predic-tive of increased health risks remain to be established, given the conflicting associations reported in recent studies (Chen et al., 2013;Del Razoet al., 2011;Mendezet al., 2015;Nizamet al., 2013;Thomaset al., 2007).
Arsenic (þ3 oxidation state) methyltrasferase (AS3MT) is a key enzyme in the pathway for the methylation of iAs, and
variants in theAS3MThave been shown to be associated with inter-individual differences in iAs metabolism (Antonelli et al., 2014; Fu et al., 2014; Gribble et al., 2015; Pierce et al., 2012; Schlebuschet al., 2015;Woodet al., 2006). Previous studies have linked polymorphic sites in this gene to significant differences in urinary measures of iAs metabolism in various populations (Antonelliet al., 2014;Fuet al., 2014;Gaoet al., 2015;Gribbleet al., 2015;Pierceet al., 2012;Woodet al., 2006). It has been suggested that iAs exposure level may modify iAs metabolism, as reflected by changes in urinary As methylation profiles, with a shift in the proportions of urinary metabolites among persons exposed to levels approximately>50 versus50ppb (Kile et al., 2009; Lindberg et al., 2008;Pierceet al., 2013;Schlebuschet al., 2015). We have previously reported based on laboratory experiments that levels and proportions of the methylated products, includ-ing DMAs/MAs ratio, differ between recombinant variants of
hu-manAS3MTand depend on the substrate concentration (Ding
et al., 2012). However, to our knowledge, no population study has formally explored to what extent associations between
AS3MTvariants and measures of iAs metabolism may vary
de-pending on levels of iAs exposure. Such heterogeneity, if pre-sent, could lead to inconsistencies across populations with varying iAs exposure in the extent to which genetic variants ei-ther relate to measures of iAs metabolism, or modify health risks associated with environmental iAs exposure.
The aims of this study were to examine the consistency of previously established associations between multiple AS3MT variants and the profiles of urinary iAs metabolites in a popula-tion with substantial variability in exposure, and to assess evi-dence of heterogeneity in the magnitude of these associations depending on the extent to which subjects are exposed to iAs in drinking water.
METHOD
S
Study populationinterviewer-administered questionnaires were used to collect a wide array of information on factors including health status (including diagnosed diabetes), use of medications, smoking, use of alcohol. Physical exams included an oral glucose tolerance test (OGTT) for detecting undiagnosed diabetes, as well as measures of weight, height, body mass index (BMI), waist and hip circum-ferences, blood pressure, and skin lesions associated with iAs exposure. For use in sensitivity analyses exploring effects of dia-betes, subjects were classified as having diabetes based on fast-ing plasma glucose 126 mg/dl or 2-h post OGTT glucose (2 HPG200 mg/dl), or on self-reported diagnosis or use of diabe-tes medication (Kerner et al., 2014; World Health Organization, 2006). All subjects provided signed informed consent, and the study was approved by the Institutional Review Boards of UNC-Chapel Hill and the Centro de Investigacion y de Estudios Avanzados of the Instituto Polite´cnico Nacional in Mexico City.
Measurements of water and urinary As
The analyses of As in water and urines were described in detail in the parent study (Mendezet al., 2015). Drinking water was col-lected in subjects’ homes, and the concentration of iAs in these water samples was measured by hydride generation (HG)-cryo-trapping (CT)-atomic absorption spectrometry (AAS) (Hernandez-Zavala et al., 2008). Spot urine samples were col-lected during morning medical exams as described previously (Currier et al., 2014). Concentrations of iAs, MAs and DMAs in spot urine were measured by HG-CT-AAS. Certified standard reference materials (SRMs) from the inter-laboratory compari-son program in Quebec and the SRM 2669 (Arsenic Species in Frozen Human Urine) from National Institute of Standards and Technology were used as quality controls.
The limit of detection (LOD) for iAs in water as well As spe-cies in urine was 0.01lg As/l. Concentrations of water iAs and urinary As species which were below LOD (1.9% for water iAs, 1.6% for urinary iAs) were imputed at LOD/2. Total speciated As in urine (tAs) was calculated as sum of the iAs, MAs and DMAs. iAs metabolism was characterized using measures recom-mended in the literature (Thomas et al., 2001; Vahter and Concha, 2001), namely percentages of each iAs metabolite (DMAs%, MAs%, iAs%), as well as the ratios of MAs/iAs (also known as the primary methylation index) and DMAs/MAs (the secondary methylation index) in urine.
Genotyping
DNA was isolated from venous blood collected in the OGTT using the QIAamp DNA Blood Mini Kit (Qiagen) according to the manufacturer’s protocol. We reviewed the available literature to look for candidateAS3MTvariants associated with urinary As profiles. Nine AS3MT variants linked to differences in iAs metabolism or susceptibility to iAs toxicity were identified for analysis in this study based on literature published through April 2011 (Agusaet al., 2009;Chunget al., 2009a,b;Engstrom et al., 2011;Hernandez-Zavala et al., 2008; Hwanget al., 2010; Lindberg et al., 2007; Sampayo-Reyes et al., 2010; Schlawicke Engstromet al., 2007;Thomaset al., 2001;Valenzuelaet al., 2009; Wood et al., 2006). These AS3MT variants included 8 single nucleotide polymorphisms (SNPs), rs35232887 (Arg173Trp), rs34556438 (Thr306lle), rs11191439 (Met287Thr), rs17881215 (G4965C), rs3740393 (G12390C), rs3740390 (C14215T), rs11191453 (T35587C), rs10748835 (G35991A), and 3 variable number of tan-dem repeats (VNTR) variants, AB, A2B, and A3B. TheAS3MT var-iants were analyzed either in the Mammalian Genotyping Core
(UNC, Chapel Hill, North Carolina, USA) or in our laboratory (VNTR and rs17181215), using predesigned or custom TaqMan assays (Applied Biosystems, Carlsbad, CA, USA). The ABI Dual 384-Well GeneAmp PCR System 9700 and ABI PRISM 7900HT Sequence Detection System from Applied Biosystems was used for genotyping and the ABI SDS software for data analysis. VNTR variants and rs17881215 were identified by sequencing a PCR-amplified promoter region.
Due to funding constraints, samples for a random subset of approximately half the subjects in the full sample were sent to the Mammalian Genotyping Core (N¼543). A random sample was also analyzed for rs17881215 and VNTR in our laboratory. Due to genotyping failure, the analysis sample available for each variant measured in the core facility varied in size from N¼500 (for rs10748835) toN¼506 (for rs3740393), withN¼715 available for rs17881215 and VNTR. 772 subjects had data on at least 1 candidate genetic marker along with measures of water As, iAs metabolism, age and gender. In addition to our primary analyses in the maximum sample with available data for each variant, we analyzed associations in a sample limited to sub-jects with data available for all candidate variants (N¼483) to confirm that effects were not affected by varied sample size; results were not meaningfully different (Supplementary Appendix Table 1).
Statistical analysis
We estimated associations between candidate variants in
AS3MTand each measure of iAs metabolism described above. In
all analyses, we defined the variant previously reported to be associated with a higher DMAs% as the referent genotype in order to facilitate comparisons with existing literature. Genotype frequencies were estimated and tested for departure from Hardy-Weinberg equilibrium by calculating pairwise r2 coefficients between variants.
To determine whether candidate AS3MT variants were related to biomarker estimates of overall iAs exposure versus to measures of iAs metabolism, we first compared median (25th and 75th percentile) tAs, as well as each indicator of iAs metab-olism, across allelic variants. Medians were used rather than means given the highly non-normal distribution of tAs (Shapiro-WilkP<.01). The non-parametric Kruskall-Wallis test was used to identify statistically significant differences in each As measure across genotypes for each polymorphism. For all analyses,P<.10 was useda priorito define marginal signifi-cance andP <.05 to define significance, given the moderate sample size. We further evaluated associations betweenAS3MT genotypes and indicators of metabolism using multiple linear regression models adjusting for age and gender, which are known to influence iAs metabolism (Lindberg et al., 2007,2008; Loffredoet al., 2003;Tseng, 2009). Coefficients from these mod-els estimated the mean differences in each measure of iAs metabolism among different genotypes of each variant, adjust-ing for age and sex.
were also run stratified by higher versus lower water As to com-pare the magnitude of associations betweenAS3MTvariants and measures of iAs metabolism among individuals more versus less exposed, regardless of the significance of interactions.
In addition to sensitivity analyses to evaluate the influence of varying sample size described above, we compared the asso-ciations between urinary As profiles andAS3MTvariants before and after adjusting for or excluding persons with diabetes; results did not differ meaningfully (Supplementary Appendix Table 2). Additionally, because numerous epidemiological stud-ies have shown that BMI may influence the metabolism of iAs (Gomez-Rubio et al., 2011;Grashow et al., 2014; Gribble et al., 2013;Suet al., 2012), we evaluated the impact of adjusting for BMI; again, results did not differ meaningfully (data not shown). Adjusting for self-reported parental race-/ethnicity (Hispanic 93. 5%, Amerindian/indigeneous 2.9%, white 3.3%, and other 0.4%) did not affect our findings (not shown). Similarly, additionally adjusting for either total water As or urinary tAs had no mean-ingful effect (data not shown). Statistical analysis was per-formed using STATA version 13 (Stata Corporation, College Station, Texas) except Global F test for the polymorphism
water As interactions, which was performed with PROC GLM in SAS, version 9.4 (SAS Institute, Inc., Cary, North Carolina).
RESULTS
Characteristics of the Population andAS3MTGenotype Frequencies
After excluding subjects with missing data on urinary As species, age, or gender (N¼42), there were 772 individuals (520 females, 252 males) with available information on at least 1 candidate variant. Exposure to water As varied substantially, with a median (25–75th percentile) of 48.6 (37.1–74.1) ppb and range of
0.01–419.77 ppb. Of the 9 initial candidateAS3MTvariants, 2 SNPs (rs35232887 and rs34556438) had a very low frequency (N<5) for the non-wildtype genotypes and were not used for further analy-sis. Genotype frequencies varied substantially for all other var-iants (Table 1). Three pairs of SNPs—rs11191439 and rs17881215, rs3740393 and rs3740390, rs3740390 and rs11191453—were in linkage disequilibrium with r2>0.8. The referent genotype— which we defined as the genotype associated with a higher DMAs% in previously published studies—corresponded to the wildtype (based on global genotype frequency reports from National Center for Biotechnology Information) for only 2 SNPs (rs11191439 and rs17881215, highly correlated with each other) (Table 1). For rs11191453, since there was no observation in our sample with the homozygous variant (CC) previously associated with the highest DMAs%, we used the heterozygous variant (TC) as the referent. For VNTR, as onlyN¼1 subject had the true refer-ent genotype A3B, we defined A2B, which was also associated with a higher DMAs% (Fuet al., 2014;Woodet al., 2006), as the referent. A3B was excluded from further analyses due to low fre-quency (N¼1).
Urinary Measures of Arsenic Metabolism Varied Substantially With Variants
Table 1also shows the median (25th and 75th percentile) of each measure of iAs metabolism—DMAs%, MAs%, iAs%, DMAs/ MAs, and MAs/iAs—overall and stratified by genotypes of each
AS3MTvariant. Values for the percentages and ratios of urinary
metabolites were consistent with the full study population (Mendezet al., 2015). The median (25th and 75th percentiles) for tAs, DMAs%, MAs%, iAs%, DMAs/MAs, and MAs/iAs were 62.9
mg/l (34.2, and 108.4 mg/l), 76.9% (71.3%, 81.4%), 13.9% (10.9%, 17.4%), 8.8% (6.3%, 12.2%), 5.5 (4.2, 7.4), and 1.6 (1.2, 2.1),
TABLE 1.Urinary As Profiles of Arsenic Metabolites Overall and byAS3MTVariants (Median and 25 and 75th Percentiles)
N % tAs DMAs% MAs% Unmethylated iAs% DMAs/MAs Ratio MAs/iAs Ratio p50 (p25, p75) p50 (p25, p75) p50 (p25, p75) p50 (p25, p75) p50 (p25, p75) p50 (p25, p75)
All subjects 772 62.9 (34.2, 108.4) 76.9 (71.3. 81.4) 13.9 (10.9,17.4) 8.8 (6.3, 12.2) 5.5 (4.2, 7.4) 1.6 (1.2, 2.1) By AS3MT variant:
rs11191439a dTT 412 82 59.5 (31.3, 105.5) 77.3** (71.7, 81.8) 13.5** (10.8, 16.7) 8.9 (6.1, 12.4) 5.7** (4.4, 7.6) 1.5 (1.1, 2.1)
TC 86 17 52.5 (30.4, 99.7) 74.9 (66.5, 79.0) 15.8 (13.0, 20.0) 9.8 (6.3, 14.5) 4.7 (3.3, 6.0) 1.8 (1.2, 2.5)
CC 3 1 64.8 (26.6, 151.0) 65.6 (59.2, 73.8) 19.7 (13.9, 27.8) 13.0 (12.2, 14.7) 3.3 (2.1, 5.3) 1.3 (1.1, 2.1)
rs17881215a dGG 579 81 61.4 (33.1, 107.4) 77.6** (72.8, 82.5) 13.4** (10.7, 16.6) 8.6 (6.1, 11.6) 5.8** (4.4, 7.6) 1.6 (1.2, 2.1)
GC 124 17 67.5 (38.0, 112.8) 74.9 (69.0, 80.5) 15.1 (12.8, 19.2) 8.8 (6.7, 13.9) 4.9 (3.6, 6.3) 1.6 (1.2, 2.3)
CC 12 2 45.2 (34.3, 82.4) 73.9 (65.3, 78.7) 19.8 (12.6, 21.6) 11.2 (5.0, 13.1) 3.7 (3.0, 6.2) 1.8 (1.3, 3.0)
rs3740393b GG 280 55 59.0 (30.9, 97.4) 75.3** (69.3, 79.6) 14.7** (11.7, 18.9) 9.9** (7.1, 13.1) 5.1** (3.8, 6.8) 1.6 (1.2, 2.1)
GC 200 40 57.2 (30.6, 107.6) 78.6 (72.9, 83.3) 13.0 (10.8, 16.0) 8.3 (5.4, 12.0) 5.8 (4.6, 7.6) 1.6 (1.1, 2.3) dCC 26 5 72.6 (46.5, 125.0) 80.7 (74.0, 84.4) 12.0 (9.4, 15.0) 9.2 (4.3, 12.0) 6.7 (5.3, 9.0) 1.2 (1.0, 1.8)
rs3740390a,b,c CC 293 58 59.9 (32.4, 99.5) 75.5** (69.4, 79.7) 14.5** (11.8, 18.8) 10.0** (7.1, 13.3) 5.3** (3.8, 6.8) 1.6 (1.1, 2.1)
CT 192 38 56.6 (30.1, 105.6) 78.7 (73.5, 83.4) 12.8 (10.5, 15.9) 8.1 (5.4, 11.9) 6.2 (4.7, 7.8) 1.6 (1.1, 2.3) dTT 20 4 71.3 (36.9, 119.2) 80.3 (70.2, 86.0) 12.6 (9.0, 15.3) 7.9 (4.4, 14.8) 6.3 (4.7, 9.5) 1.2 (0.9, 1.7)
rs11191453c TT 290 58 59.7 (32.4, 99.5) 75.3** (69.2, 79.7) 14.6** (11.8, 18.9) 10.0** (7.1, 13.4) 5.2** (3.7, 6.8) 1.6 (1.2, 2.1) dTC 212 42 57.9 (30.1, 107.6) 78.8 (73.4, 83.5) 12.8 (10.3, 15.9) 8.1 (5.3, 12.0) 6.2 (4.7, 8.0) 1.6 (1.1, 2.3)
rs10748835 GG 151 30 60.5 (33.1, 99.5) 76.0* (70.1, 80.2) 14.5 (12.0,18.1) 9.5 (7.1, 12.9) 5.4* (3.9, 6.6) 1.5 (1.1, 2.1)
GA 251 50 57.2 (29.4, 104.3) 76.7 (70.3, 81.3) 13.7 (10.8, 17.4) 9.0 (6.1, 12.9) 5.5 (4.1, 7.6) 1.6 (1.1, 2.1) dAA 98 20 64.8 (32.0, 112.6) 78.5 (73.8, 83.5) 13.7 (10.3, 15.9) 8.3 (5.1, 11.7) 5.7 (4.6, 7.7) 1.6 (1.1, 2.2)
VNTR AB 587 82 61.5 (33.2, 112.0) 76.9* (70.9, 81.5) 13.9 (11.0, 17.4) 8.7 (6.2, 12.3) 5.5 (4.1, 7.3) 1.6 (1.2, 2.1) dA2B 127 18 60.5 (34.2, 92.6) 77.9 (73.8, 82.1) 13.6 (10.6, 16.1) 8.3 (6.3, 10.5) 5.6 (4.6, 7.9) 1.6 (1.2, 2.2) a,b,c,The pairs of variants shown were in linkage disequilibrium withr2>0.8.
dIdentifies the referent genotype, defined as the genotype associated in previous literature with a higher DMAs%.
*P<.10,
respectively. Water As was significantly positively correlated with urinary tAs (Spearman’sR¼0.23,P<0.01).
In descriptive analysis, no significant difference in tAs was observed across genotypes for any of the 7 candidate variants (P>0.10;Table 1). Descriptive analyses also showed that consis-tent with prior literature, the referent genotype was associated with increases in the DMAs% for all 7 candidate markers. These differences were significant (P<.05) for 5 variants, and marginally significant for 2 (VNTR and rs10748835,P<.10). The 5 variants associated with significant increases in the DMAs% were also asso-ciated with significant reductions in the MAs% (P<0.05); VNTR and rs10748835 were associated with small but non-significant reductions in this measure. Similarly, the DMAs/MAs ratio was sig-nificantly higher among participants with the referent genotype for 6 variants, the exception being VNTR. There was a reduction in iAs% observed for the referent genotypes for 6 of the candidate markers examined, although differences were at least of margin-ally significance for only 3 variants. The exception to this pattern, rs3740393, showed lower iAs% for the heterozygous (GC) instead of referent homozygous (CC) genotype. In contrast to the patterns observed for all other measures of iAs metabolism, there were no clear pattern and no significant differences in the MAs/iAs ratio across genotypes in any of the candidate variants.
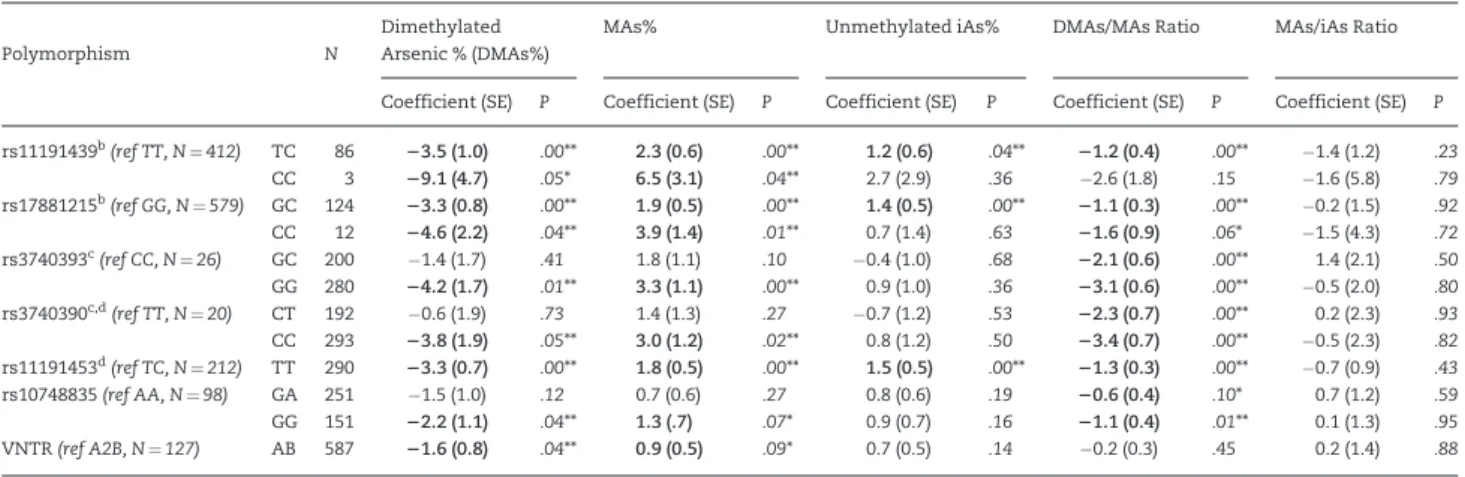
Adjusted mean differences in urinary measures of iAs metabolism associated with having polymorphisms other than the referent genotypes are shown inTable 2, based on multi-variable linear models adjusted for age and gender. Results were similar to descriptive analyses. Having non-referent geno-types was associated with significant (P<.05) decreases in the DMAs% for at least one genotype in all 7 variants, significant increases in the MAs% for 5 variants, and marginally significant increases (P<.10) in the MAs% for rs10748835 and VNTR. Excluding some genotypes with very small cell sizes (N<5), the 5 SNPs significantly associated with these measures of iAs metabolism (rs3740390 and 2 correlated SNPs rs3740393 and rs11191453; rs17881215 and the correlated SNP rs11191439) were associated with the largest adjusted mean differences in both DMAs% (from 3.360.7 to 4.662.2%) and MAs% (from 1.860.5 to 3.961.4%), with smaller differences associated with polymor-phisms in rs10748835 and VNTR.
Significant differences in measures of iAs metabolism associated with genetic polymorphisms were most notable for the DMAs/MAs ratio. When compared with the referent geno-type, all other genotypes in each variant were associated with at least marginally significant (P<.10) differences in DMAs/ MAs with only 2 exceptions: the homozygous variant of rs11191439, for which the cell size was small (N¼3), and poly-morphisms in VNTR, for which the association was null. The magnitude of association with DMAs/MAs was strongest— a>2-unit change—for variants in rs3740393 and the correlated SNP rs3740390, with the weakest associations—of about half this magnitude—for rs10748835. Like the descriptive analyses, few variants (N¼3) were significantly associated with the iAs%, and none with the MAs/iAs ratio, after multivariable adjustment.
Associations BetweenAS3MTVariants and Urinary
Measures of iAs Metabolism Among Subjects With Higher Versus Lower Exposure to Drinking Water As
There were interactions between elevated (>50 ppb) exposure to water As and several genetic variants, suggesting that the degree to which genotype in these variants influence patterns of iAs metabolism may vary with increasing exposure. Interactions were significant primarily for the DMAs/MAs ratio (P<.05 for 3 variants: the correlated SNPS rs3740390 and rs3740393, as well as rs10748835; Figure 1C, Supplementary Appendix Table 3). There were also marginal significant (P<.10) interactions between exposure level and one variant (rs17881215) for the DMAs% and MAs%.
As shown inFigure 1C, the decline in the DMAs/MAs ratio associated with having genotypes other than the referent was considerably as well as significantly larger among more versus less highly exposed individuals for 3 SNPs: rs3740390, the corre-lated SNP rs3740393, and rs10748835 (see alsoSupplementary Appendix Table 4). In the sample as a whole, the magnitude of associations with the DMA/MAs ratio was strongest for the first 2 SNPs. However, except for the null relationship with VNTR, this last SNP—rs10748835—was the variant most weakly associated with the DMAs/MAs in the overall sample. Though
TABLE 2.Adjusted Associations Between A S3MT Variants and Urinary Profiles of Arsenic Metabolitesa
Dimethylated Arsenic % (DMAs%)
MAs% Unmethylated iAs% DMAs/MAs Ratio MAs/iAs Ratio Polymorphism N
Coefficient (SE) P Coefficient (SE) P Coefficient (SE) P Coefficient (SE) P Coefficient (SE) P
rs11191439b(ref TT, N¼412) TC 86
23.5 (1.0) .00** 2.3 (0.6) .00** 1.2 (0.6) .04** 21.2 (0.4) .00** 1.4 (1.2) .23
CC 3 29.1 (4.7) .05* 6.5 (3.1) .04** 2.7 (2.9) .36 2.6 (1.8) .15 1.6 (5.8) .79
rs17881215b(ref GG, N¼579) GC 124
23.3 (0.8) .00** 1.9 (0.5) .00** 1.4 (0.5) .00** 21.1 (0.3) .00** 0.2 (1.5) .92
CC 12 24.6 (2.2) .04** 3.9 (1.4) .01** 0.7 (1.4) .63 21.6 (0.9) .06* 1.5 (4.3) .72
rs3740393c(ref CC, N¼26) GC 200 1.4 (1.7) .41 1.8 (1.1) .10 0.4 (1.0) .68
22.1 (0.6) .00** 1.4 (2.1) .50
GG 280 24.2 (1.7) .01** 3.3 (1.1) .00** 0.9 (1.0) .36 23.1 (0.6) .00** 0.5 (2.0) .80
rs3740390c,d(ref TT, N¼20) CT 192 0.6 (1.9) .73 1.4 (1.3) .27 0.7 (1.2) .53
22.3 (0.7) .00** 0.2 (2.3) .93
CC 293 23.8 (1.9) .05** 3.0 (1.2) .02** 0.8 (1.2) .50 23.4 (0.7) .00** 0.5 (2.3) .82
rs11191453d(ref TC, N¼212) TT 290
23.3 (0.7) .00** 1.8 (0.5) .00** 1.5 (0.5) .00** 21.3 (0.3) .00** 0.7 (0.9) .43
rs10748835(ref AA, N¼98) GA 251 1.5 (1.0) .12 0.7 (0.6) .27 0.8 (0.6) .19 20.6 (0.4) .10* 0.7 (1.2) .59
GG 151 22.2 (1.1) .04** 1.3 (.7) .07* 0.9 (0.7) .16 21.1 (0.4) .01** 0.1 (1.3) .95
VNTR(ref A2B, N¼127) AB 587 21.6 (0.8) .04** 0.9 (0.5) .09* 0.7 (0.5) .14 0.2 (0.3) .45 0.2 (1.4) .88 aLinear regression model adjusted for age and gender; referent genotype defined as the genotype associated in previous literature with a higher DMAs%.
b,c,dThe pairs of variants shown were in linkage disequilibrium withr2>0.80.
*P<.10,
interactions did not reach significance, the magnitude of associ-ations with polymorphisms in rs10748835 and both the DMAs% and MAs% were more than 2 times larger among highly versus more moderately exposed individuals (Figure 1A and B, Supplementary Appendix Table 4).
In contrast to the stronger associations seen at higher levels of exposure for these 3 variants, for polymorphisms in rs17881215 the magnitude of association with both the DMAs% and MAs% was marginally significantly weaker at higher expo-sure (P<.10;Figure 1A and B,Supplementary Appendix Tables 3 and 4). There was, however, no difference in the magnitude of association between polymorphisms in this SNP and the DMAs/ MAs ratio at high versus low levels of exposure.
In models predicting variation in the iAs% and the MAs/iAs ratio, no significant effect modification by water As was observed. However, for both outcomes, the magnitude of associa-tions appeared to vary depending on the level of water As expo-sure for polymorphisms that included both rs10748835 and rs17881215, for which interactions reached significance for other measures (Supplementary Appendix Table 4,Figure 1D and E).
In sensitivity analyses exploring the effects of additionally adjusting for diabetes (Supplementary Appendix Table 2), or for
BMI, urinary tAs and water As (not shown), there were no mean-ingful differences in results. False discovery rate adjustment (Benjaminiet al., 2001) of models for each measure of metabo-lism led to loss of significance for associations with a number of variants and iAs%, and for the association between variants in rs3740390 and MAs% among subjects exposed to low levels of drinking water arsenic. Interactions for models predicting the DMA/MAs ratio remained significant.
DISCUSSION
Inter-individual variation in urinary measures of iAs metabo-lism has been associated with the risk of adverse health out-comes associated with iAs exposure (Kuoet al., 2015;Mendez et al., 2015;Pierceet al., 2013;Sunet al., 2007), indicating that fac-tors influencing metabolism may affect susceptibility to dis-ease. There is growing evidence—including a recent review— that a number of candidate variants inAS3MTaffect iAs metab-olism (Antonelliet al., 2014;Fuet al., 2014;Gribbleet al., 2015; Pierceet al., 2012;Schlebuschet al., 2015;Woodet al., 2006). At present, evidence on the consistency with which these variants relate to markers of metabolism across populations is limited
and mixed, perhaps in part due to the small sample size and modest power in most previous studies (N<300) (Drobnaet al., 2013;Fuet al., 2014). Moreover, although it has been suggested that the extent to which some variants influence iAs metabo-lism might be stronger among subjects more highly exposed to iAs (Pierceet al., 2013), to our knowledge, studies have yet to for-mally explore such heterogeneity. In this study, we aimed to confirm relationships between 7 candidateAS3MTvariants and urinary markers of iAs metabolism (Antonelliet al., 2014; Beebe-Dimmeret al., 2012;Drobnaet al., 2013;Engstromet al., 2011, 2015; Hernandez et al., 2014; Hernandez-Zavala et al., 2008; Hwanget al., 2010;Lindberget al., 2007;Sampayo-Reyeset al., 2010;Valenzuelaet al., 2009;Woodet al., 2006), and examine the extent to which these associations may vary depending on the level of exposure to drinking water As.
In this study, genotypes associated with a higher DMAs% in previous studies were consistently associated with significantly higher DMAs%, DMAs/MAs and lower MAs%; almost all associa-tions were at least marginally significant at P<.10. Reference genotypes also tended to be associated with a lower iAs%, though these relationships were largely not significant. However, associ-ations with the ratio of MAs to iAs, which has been used as an indicator of the efficiency of the first methylation step, were con-sistently non-significant, and varied considerably in terms of direction and magnitude.
We found significant interactions between 4 of the 7
candi-date AS3MT variants and concentrations of As in drinking
water. Three SNPs (rs3740393, rs3740390, and rs10748835) had somewhat stronger associations with indicators of iAs metabo-lism among individuals exposed to higher versus lower levels of As in drinking water, with significant differences in the magni-tude of association for the DMAs/MAs ratio. In contrast, one SNP (rs17881215) was more strongly associated with 2 markers of iAs metabolism—the DMAs% and MAs%—among partici-pants with lower rather than with higher exposure. This sug-gests that the genetic variants most influential for aspects of iAs metabolism may vary across populations, depending on prevailing levels of exposure. This finding also suggests the pos-sibility that the variants most influential for modifying health risks may differ in more highly exposed populations than in set-tings with low exposure. Though earlier studies, to the best of our knowledge, have not formally examined whether the degree of exposure to iAs may modify the influence ofAS3MTvariants on iAs metabolism, prior literature has suggested that patterns of metabolism may vary by level of exposure (Ahsanet al., 2007; Kileet al., 2009;Lindberg et al., 2008;Stybloet al., 1999;Tseng, 2009). Several studies have suggested that at exposures exceed-ing 50 ppb, there may be an increase in the MAs% in urine and decrease in DMAs%, perhaps due to saturated capacity for the secondary methylation step or the inhibition of AS3MT activity by high levels of iAs (Kileet al., 2009;Lindberg et al., 2008). At these higher exposures, genetic variants may be either more, or less, influential on iAs metabolism. However, in our sample, we did not observe meaningful differences in urinary As profiles between groups exposed to higher (50 ppb) versus lower con-centrations of water As in our study. The median (25th and 75th percentile) for more versus less exposed groups were 77.2% (71.4%, 81.8%) versus 76.5% (70.9%, 81.2%), 14.0% (11.1%, 17.4%) versus 13.6% (10.9%. 17.4%), and 5.4 (4.2, 7.3) versus 5.6 (4.2, 7.4) for DMAs%, MAs%, and DMAs/MAs accordingly (Kruskall-Wallis P>.10 for all pairwise comparisons).
Interactions betweenAS3MTvariants and levels of exposure (ie, water iAs) did not depend on the magnitude of the associa-tion between those variants and urinary iAs profiles in the
overall population. For example, in the population as a whole, polymorphisms in rs10748835 were much more weakly associ-ated with urinary iAs metabolites than those in rs3740393. However, there were significant differences in the magnitude of association with the DMAs/MAs ratio among participants with high versus low exposure for both variants.
In our analyses, the referent genotype, defined as the one previously associated with a higher DMAs%—and postulated to be associated as well with a higher DMAs/MAs, lower MAs%, and lower iAs%—was not always the major (ie, most frequent) genotype in our sample. Indeed, the postulated beneficial refer-ent genotype was the major genotype only for rs11191439 and rs17881215, the SNPs with the strongest magnitude of associa-tion with methylaassocia-tion indicators in our sample (seeTable 2).
It is unclear what the implications of theAS3MTvariant-iAs metabolism associations are for health of iAs-exposed individu-als. Based on previous literature, the relevance of a high versus low DMAs%, MAs%, or DMAs/MAs ratio for health risks is uncer-tain, and may depend on the level of exposure. Several studies in high exposure settings have found a high MAs% to be associ-ated with increased risk of cancer and other health outcomes, including cardiovascular diseases and diabetes (Chen et al., 2005; Chung et al., 2009a,b; Lindberg et al., 2008). However, numerous studies in settings with more moderate exposure have reported a higher DMAs% to be associated with increased risk of diabetes and other cardiometabolic outcomes (Chen et al., 2013;Del Razoet al., 2011;Mendezet al., 2015;Nizamet al., 2013). The conflicting results for the associations between uri-nary iAs methylation profiles and health outcomes may be due to differences in the distribution of trivalent and pentavalent methylated metabolites (MAsIII vs MAsV; DMAsIII vs DMAsV) which exhibit different toxicities in laboratory models (Chung
et al., 2009;Del Razoet al., 2011;Kligerman and Tennant, 2007;
Nizamet al., 2013; Petrick et al., 2000;Schwerdtle et al., 2003; Styblo et al., 2000; Tseng, 2007). However, differentiating between the trivalent and pentavalent As species in urine is technically challenging and is rarely implemented in population studies (Valenzuelaet al., 2005). Therefore, analyses performed in most population studies, including this study, are typically limited to measurements of total iAs, MAs, and DMAs, and the percentages and ratios of these metabolites in urine.
Though a considerable literature indicates that inter-individual variation in the capacity to metabolize iAs is associ-ated with diverse health risks, including cancer, diabetes, cardi-ovascular disease, and skin lesions (Chen et al., 2013; Gribble et al., 2014;Huanget al., 2007;Karagaset al., 1998;Kuoet al., 2015; Lesseuret al., 2012;Mendezet al., 2015;Pierceet al., 2013;Tseng, 2007), less is known about the health effects of variants in
AS3MTthat influence metabolism. Previous studies of
cancer were null (Karagas et al., 1998; Lesseur et al., 2012). Similarly, C versus G alleles in rs17881215 [G4965C] were associ-ated with increases in trivalent DMAs and higher fasting and 2-h glucose (Drobnaet al., 2013). For rs3740393 (G vs C), rs3740390 (C vs T), and/or rs10748835 (G vs A)—the 3 variants for which we found significant interactions with exposure in our analysis of methylation patterns—there were null associations with the outcomes under study: glucose levels (Drobnaet al., 2013), skin lesions (Valenzuelaet al., 2009), or bladder cancer (Lesseuret al., 2012). These studies did not examine interactions between SNPs and arsenic exposure. A recent study in Bangladesh (Pierce et al., 2013) found evidence of such an interaction. Variants in rs9527 (P<.05), theAS3MTSNP that was associated with DMAs% and MAs% in urine, were also associated with increased odds of skin lesions, but only among individuals in the highest tertile of water arsenic exposure (>87 ppb). Though mechanisms remain to be fully elucidated, a study in a U.S. pop-ulation reported differential methylation of the AS3MT pro-moter depending on arsenic exposure (Gribbleet al., 2014).
This study was conducted in the Chihuahua area of Mexico, with moderately elevated levels of iAs in drinking water (median concentration of 48.6 ppb). Many previous studies have been conducted in areas with substantially higher exposure (Maullet al., 2012) (eg, water iAs exposure level for studies done in Bangladesh is likely to be between 100 and 200 ppb (Ahsan et al., 2007;Chenet al., 2013;Farzanet al., 2015;Lindberg et al., 2008)). Thus there is uncertainty regarding the health effects of more moderate levels of iAs exposure, and the influence of genetic polymorphisms on iAs metabolism and toxicity, in areas with moderate exposure, which are more typical popula-tion exposures around the world. The range of exposure in this Chihuahua cohort—with nearly 50% of subjects at levels below 50 ppb—enabled us to analyze interactions betweenAS3MT var-iants in the moderate range of water As exposure at which some studies have suggested iAs metabolism may shift (Kile et al., 2009;Lindberg et al., 2008).
A limitation of this study is that, although the sample size was larger than in many previous studies(Drobna et al., 2013; Engstrom et al., 2011; Fu et al., 2014; Lindberg et al., 2007; Valenzuelaet al., 2009), we had small cell sizes for genotypes of several candidate AS3MT variants, particularly in analyses stratified by water As. The small cell sizes may have reduced our power to detect interactions between level of exposure and methylation profiles for those variants.
CONCLUSION
In this study, 7AS3MTvariants which may play a role in iAs metabolism were examined based on results of previous stud-ies. The patterns of association between markers of iAs metabo-lism and these variants were highly consistent with those reported in previous studies, confirming that these variants are in part responsible for the inter-individual differences in uri-nary profiles of iAs metabolites. We found that specific geno-types in 5 SNPs, rs17881215, rs3740393, rs3740390, rs11191439, and rs11191453, were associated with significantly higher DMAs% and lower MAs% in urine. Polymorphisms in these SNPs, along with rs10748835, were also associated with the DMAs/MAs ratio.
Our results also suggested that the role of several of these
AS3MTvariants in iAs metabolism may differ among populations
with different levels of iAs exposure. Three SNPs, rs3740393, rs3740390, and rs10748835, appeared to have significantly more potent effects, based on associations with larger decreases in the
DMAs/MAs ratio, among subjects highly exposed to As in drink-ing water (>50 ppb). In contrast, rs17881215 had significantly more potent effects among subjects with lower water As levels. Since measures of iAs metabolism have been associated with risk of adverse health outcomes, these findings suggest that var-iants inAS3MTmay influence susceptibility to health effects of iAs exposure, and that the role of these variants may depend on the level of iAs exposure. However, given that toxicity of iAs metabolites varies by oxidation status (Del Razo et al., 2011; Kligerman and Tennant, 2007;Nizamet al., 2013;Petricket al., 2000;Schwerdtleet al., 2003;Stybloet al., 2000;Tseng, 2007), fur-ther research focusing on whefur-ther and how these variants relate to the distribution of trivalent and pentavalent metabolites is needed to better clarify the influence ofAS3MTpolymorphism on iAs methylation profiles, and on health outcomes.
SUPPLEMENTARY DATA
Supplementary data are available online at http://toxsci. oxfordjournals.org/.
FUNDING
This work was supported by the National Institute for Environmental Health Sciences (grant R21ES023690 to M.S. and M.M., and R01ES015326 to M.S.). Support was also provided by the University of North Carolina Nutrition Obesity Research Center grant DK056350.
REFERENCES
Agusa, T., Iwata, H., Fujihara, J., Kunito, T., Takeshita, H., Minh, T. B., Trang, P. T., Viet, P. H., and Tanabe, S. (2009). Genetic polymorphisms in AS3MT and arsenic metabolism in resi-dents of the Red River Delta, Vietnam. Toxicol. Appl.
Pharmacol.236, 131–141.
Ahsan, H., Chen, Y., Kibriya, M. G., Slavkovich, V., Parvez, F., Jasmine, F., Gamble, M. V., and Graziano, J. H. (2007). Arsenic metabolism, genetic susceptibility, and risk of premalignant skin lesions in Bangladesh.Cancer Epidemiol. Biomarkers Prev. 16, 1270–1278.
Antonelli, R., Shao, K., Thomas, D. J., Sams, R., 2nd, and Cowden, J. (2014). AS3MT, GSTO, and PNP polymorphisms: Impact on arsenic methylation and implications for disease
susceptibil-ity.Environ. Res.132, 156–167.
Beebe-Dimmer, J. L., Iyer, P. T., Nriagu, J. O., Keele, G. R., Mehta, S., Meliker, J. R., Lange, E. M., Schwartz, A. G., Zuhlke, K. A., Schottenfeld, D., and Cooney, K. A. (2012). Genetic variation in glutathione S-transferase omega-1, arsenic methyltrans-ferase and methylene-tetrahydrofolate reductase, arsenic exposure and bladder cancer: A case-control study.Environ.
Health11, 43.
Benjamini, Y., Drai, D., Elmer, G., Kafkafi, N., and Golani, I. (2001). Controlling the false discovery rate in behavior genetics re-search.Behav. Brain Res.125, 279–284.
Chen, C. J., Hsu, L. I., Wang, C. H., Shih, W. L., Hsu, Y. H., Tseng, M. P., Lin, Y. C., Chou, W. L., Chen, C. Y., Lee, C. Y.,et al. (2005). Biomarkers of exposure, effect, and susceptibility of arsenic-induced health hazards in Taiwan.Toxicol. Appl. Pharmacol. 206, 198–206.
methylation capacity, and risk of cardiovascular disease in Bangladesh.Environ. Health Perspect.121, 832–838.
Chung, C. J., Hsueh, Y. M., Bai, C. H., Huang, Y. K., Huang, Y. L., Yang, M. H., and Chen, C. J. (2009a). Polymorphisms in arse-nic metabolism genes, urinary arsearse-nic methylation profile and cancer.Cancer Causes Control20, 1653–1661.
Chung, W. H., Sung, B. H., Kim, S. S., Rhim, H., and Kuh, H. J. (2009b). Synergistic interaction between tetra-arsenic oxide and paclitaxel in human cancer cells in vitro.Int. J. Oncol.34, 1669–1679.
Cocker, J., Morton, J., Warren, N., Wheeler, J. P., and Garrod, A. N. (2006). Biomonitoring for chromium and arsenic in timber treatment plant workers exposed to CCA wood Preservatives.Ann. Occup. Hyg.50, 517–525.
Colin-Torres, C. G., Murillo-Jimenez, J. M., Del Razo, L. M., Sanchez-Pena, L. C., Becerra-Rueda, O. F., and Marmolejo-Rodriguez, A. J. (2014). Urinary arsenic levels influenced by abandoned mine tailings in the Southernmost Baja California Peninsula, Mexico. Environ. Geochem. Health 36, 845–854.
Currier, J. M., Ishida, M. C., Gonzalez-Horta, C., Sanchez-Ramirez, B., Ballinas-Casarrubias, L., Gutierrez-Torres, D. S., Ceron, R. H., Morales, D. V., Terrazas, F. A., Del Razo, L. M.,et al. (2014). Associations between arsenic species in exfoliated urothelial cells and prevalence of diabetes among residents of Chihuahua, Mexico.Environ. Health Perspect.122, 1088–1094. Del Razo, L. M., Garcia-Vargas, G. G., Valenzuela, O. L.,
Castellanos, E. H., Sanchez-Pena, L. C., Currier, J. M., Drobna, Z., Loomis, D., and Styblo, M. (2011). Exposure to arsenic in drinking water is associated with increased prevalence of di-abetes: A cross-sectional study in the Zimapan and Lagunera regions in Mexico.Environ. Health10, 73.
Ding, L., Saunders, R. J., Drobna, Z., Walton, F. S., Xun, P., Thomas, D. J., and Styblo, M. (2012). Methylation of arsenic by recombinant human wild-type arsenic (þ3 oxidation state) methyltransferase and its methionine 287 threonine (M287T) polymorph: Role of glutathione.Toxicol Appl Pharmacol.264, 121–130.
Drobna, Z., Del Razo, L. M., Garcia-Vargas, G. G., Sanchez-Pena, L. C., Barrera-Hernandez, A., Styblo, M., and Loomis, D. (2013). Environmental exposure to arsenic, AS3MT polymorphism and prevalence of diabetes in Mexico.J. Expo. Sci. Environ.
Epidemiol.23, 151–155.
Engstrom, K., Vahter, M., Mlakar, S. J., Concha, G., Nermell, B., Raqib, R., Cardozo, A., and Broberg, K. (2011). Polymorphisms in arsenic(þIII oxidation state) methyltransferase (AS3MT) predict gene expression of AS3MT as well as arsenic metabo-lism.Environ. Health Perspect.119, 182–188.
Engstrom, K. S., Vahter, M., Fletcher, T., Leonardi, G., Goessler, W., Gurzau, E., Koppova, K., Rudnai, P., Kumar, R., and Broberg, K. (2015). Genetic variation in arsenic (þ3 oxidation state) methyltransferase (AS3MT), arsenic metabolism and risk of basal cell carcinoma in a European population.
Environ. Mol. Mutagen.56, 60–69.
Farzan, S. F., Karagas, M. R., Jiang, J., Wu, F., Liu, M., Newman, J. D., Jasmine, F., Kibriya, M. G., Paul-Brutus, R., Parvez, F.,et al. (2015). Gene-arsenic interaction in longitudinal changes of blood pressure: Findings from the Health Effects of Arsenic Longitudinal Study (HEALS) in Bangladesh. Toxicol. Appl.
Pharmacol.288, 95–105.
Fu, S., Wu, J., Li, Y., Liu, Y., Gao, Y., Yao, F., Qiu, C., Song, L., Wu, Y., Liao, Y., and Sun, D. (2014). Urinary arsenic metabolism in a Western Chinese population exposed to high-dose inor-ganic arsenic in drinking water: Influence of ethnicity and
genetic polymorphisms. Toxicol. Appl. Pharmacol. 274, 117–123.
Gao, J., Tong, L., Argos, M., Scannell Bryan, M., Ahmed, A., Rakibuz-Zaman, M., Kibriya, M. G., Jasmine, F.,Slavkovich, V., Graziano, J.H.,et al. (2015). The genetic architecture of arsenic metabolism efficiency: A SNP-based heritability study of Bangladeshi adults.Environ. Health Perspect.123, 985–992. Gardner, R. M., Engstrom, K., Bottai, M., Hoque, W. A., Raqib, R.,
Broberg, K., and Vahter, M. (2012). Pregnancy and the methyl-transferase genotype independently influence the arsenic methylation phenotype. Pharmacogenet. Genomics 22, 508–516.
Gomez-Rubio, P., Roberge, J., Arendell, L., Harris, R. B., O’Rourke, M. K., Chen, Z., Cantu-Soto, E., Meza-Montenegro, M. M., Billheimer, D., Lu, Z.,et al. (2011). Association between body mass index and arsenic methylation efficiency in adult women from southwest U.S. and northwest Mexico.Toxicol.
Appl. Pharmacol.252, 176–182.
Grashow, R., Zhang, J., Fang, S. C., Weisskopf, M. G., Christiani, D. C., Kile, M. L., and Cavallari, J. M. (2014). Inverse association between toenail arsenic and body mass index in a population of welders.Environ. Res.131, 131–133.
Gribble, M. O., Crainiceanu, C. M., Howard, B. V., Umans, J. G., Francesconi, K. A., Goessler, W., Zhang, Y., Silbergeld, E. K., Guallar, E., and Navas-Acien, A. (2013). Body composition and arsenic metabolism: A cross-sectional analysis in the Strong Heart Study.Environ. Health12, 107.
Gribble, M. O., Tang, W. Y., Shang, Y., Pollak, J., Umans, J. G., Francesconi, K. A., Goessler, W., Silbergeld, E. K., Guallar, E., Cole, S. A.,et al. (2014). Differential methylation of the arsenic (III) methyltransferase promoter according to arsenic expo-sure.Arch. Toxicol.88, 275–282.
Gribble, M. O., Voruganti, V. S., Cole, S. A., Haack, K., Balakrishnan, P., Laston, S. L., Tellez-Plaza, M., Francesconi, K. A., Goessler, W., Umans, J. G.,et al. (2015). Linkage analysis of urine arsenic species patterns in the strong heart family study.Toxicol. Sci.148,89–100.
Hernandez, A., Paiva, L., Creus, A., Quinteros, D., and Marcos, R. (2014). Micronucleus frequency in copper-mine workers ex-posed to arsenic is modulated by the AS3MT Met287Thr polymorphism.Mutat. Res. Genet. Toxicol. Environ. Mutagen.759, 51–55.
Hernandez-Zavala, A., Valenzuela, O. L., Matousek, T., Drobna, Z., Dedina, J., Garcia-Vargas, G. G., and Styblo, M. (2008). Speciation of arsenic in exfoliated urinary bladder epithelial cells from individuals exposed to arsenic in drinking water.
Environ. Health Perspect.116, 1656–1660.
Huang, Y. K., Tseng, C. H., Huang, Y. L., Yang, M. H., Chen, C. J., and Hsueh, Y. M. (2007). Arsenic methylation capability and hypertension risk in subjects living in arseniasis-hyperendemic areas in southwestern Taiwan.Toxicol. Appl.
Pharmacol.218, 135–142.
Hwang, Y. H., Chen, Y. H., Su, Y. N., Hsu, C. C., Chen, Y. H., and Yuan, T. H. (2010). Genetic polymorphism of As3MT and de-layed urinary DMA excretion after organic arsenic intake from oyster ingestion.J. Environ. Monit.12, 1247–1254. Iarc Working Group on the Evaluation of Carcinogenic Risks to
Humans. (2012). Arsenic, metals, fibres, and dusts. IARC
Monogr. Eval. Carcinog. Risks Hum.100, 11–465.
Kerner, W., Bruckel, J., and German Diabetes, A. (2014). Definition, classification and diagnosis of diabetes mellitus.
Exp. Clin. Endocrinol. Diabetes122, 384–386.
Kile, M. L., Hoffman, E., Hsueh, Y. M., Afroz, S., Quamruzzaman, Q., Rahman, M., Mahiuddin, G., Ryan, L., and Christiani, D. C. (2009). Variability in biomarkers of arsenic exposure and metabolism in adults over time.Environ. Health Perspect.117, 455–460. Kligerman, A. D., and Tennant, A. H. (2007). Insights into the
car-cinogenic mode of action of arsenic.Toxicol. Appl. Pharmacol. 222, 281–288.
Kuo, C. C., Howard, B. V., Umans, J. G., Gribble, M. O., Best, L. G., Francesconi, K. A., and Navas-Acien, A. (2015). Arsenic expo-sure, arsenic metabolism, and incident diabetes in the strong heart study.Diabetes Care38, 620–627.
Lesseur, C., Gilbert-Diamond, D., Andrew, A. S., Ekstrom, R. M., Li, Z., Kelsey, K. T., Marsit, C. J., and Karagas, M. R. (2012). A case-control study of polymorphisms in xenobiotic and arse-nic metabolism genes and arsearse-nic-related bladder cancer in New Hampshire.Toxicol. Lett.210, 100–106.
Li, Y., Ye, F., Wang, A., Wang, D., Yang, B., Zheng, Q., Sun, G., and Gao, X. (2016). Chronic arsenic poisoning probably caused by arsenic-based pesticides: Findings from an investigation study of a household.Int. J. Environ. Res. Public Health13(1), pii: E133.
Lindberg, A. L., Ekstrom, E. C., Nermell, B., Rahman, M., Lonnerdal, B., Persson, L. A., and Vahter, M. (2008). Gender and age differences in the metabolism of inorganic arsenic in a highly exposed population in Bangladesh.Environ. Res.106, 110–120.
Lindberg, A. L., Kumar, R., Goessler, W., Thirumaran, R., Gurzau, E., Koppova, K., Rudnai, P., Leonardi, G., Fletcher, T., and Vahter, M. (2007). Metabolism of low-dose inorganic arsenic in a central European population: Influence of sex and genetic polymorphisms.Environ. Health Perspect.115, 1081–1086. Lindberg, A. L., Rahman, M., Persson, L. A., and Vahter, M. (2008).
The risk of arsenic induced skin lesions in Bangladeshi men and women is affected by arsenic metabolism and the age at first exposure.Toxicol. Appl. Pharmacol.230, 9–16.
Loffredo, C. A., Aposhian, H. V., Cebrian, M. E., Yamauchi, H., and Silbergeld, E. K. (2003). Variability in human metabolism of arsenic.Environ. Res.92, 85–91.
Loh, M. M., Sugeng, A., Lothrop, N., Klimecki, W., Cox, M., Wilkinson, S. T., Lu, Z., and Beamer, P. I. (2016). Multimedia exposures to arsenic and lead for children near an inactive mine tailings and smelter site.Environ. Res.146, 331–339. Maull, E. A., Ahsan, H., Edwards, J., Longnecker, M. P.,
Navas-Acien, A., Pi, J., Silbergeld, E. K., Styblo, M., Tseng, C. H., Thayer, K. A., and Loomis, D. (2012). Evaluation of the association be-tween arsenic and diabetes: A National Toxicology Program workshop review.Environ. Health Perspect.120, 1658–1670. Mendez, M. A., Gonzalez-Horta, C., Sanchez-Ramirez, B.,
Ballinas-Casarrubias, L., Hernandez Ceron, R., Viniegra Morales, D., Terrazas, F. A., Ishida, M. C., Gutie´rrez-Torres, D. S., Saunders, R. J.,et al. (2015). Chronic exposure to arsenic and markers of cardiometabolic risk-a cross-sectional study in Chihuahua, Mexico.Environ. Health Perspect.124, 104–111. Moon, K., Guallar, E., and Navas-Acien, A. (2012). Arsenic
expo-sure and cardiovascular disease: An updated systematic re-view.Curr. Atheroscler. Rep.14, 542–555.
Nizam, S., Kato, M., Yatsuya, H., Khalequzzaman, M., Ohnuma, S., Naito, H., and Nakajima, T. (2013). Differences in urinary arsenic metabolites between diabetic and non-diabetic sub-jects in Bangladesh. Int. J. Environ. Res. Public Health 10, 1006–1019.
Petrick, J. S., Ayala-Fierro, F., Cullen, W. R., Carter, D. E., and Vasken Aposhian, H. (2000). Monomethylarsonous acid (MMA(III)) is more toxic than arsenite in Chang human hepa-tocytes.Toxicol. Appl. Pharmacol.163, 203–207.
Pierce, B. L., Kibriya, M. G., Tong, L., Jasmine, F., Argos, M., Roy, S., Paul-Brutus, R., Rahaman, R., Rakibuz-Zaman, M., Parvez, F., et al. (2012). Genome-wide association study identifies chromosome 10q24.32 variants associated with arsenic metab-olism and toxicity phenotypes in Bangladesh. PLoS Genet. 8, e1002522.
Pierce, B. L., Tong, L., Argos, M., Gao, J., Farzana, J., Roy, S.,Paul-Brutus, R., Rahaman, R., Rakibuz-Zaman, M., Parvez, F.,et al. (2013). Arsenic metabolism efficiency has a causal role in ar-senic toxicity: Mendelian randomization and gene-environment interaction.Int. J. Epidemiol.42, 1862–1871. Sampayo-Reyes, A., Hernandez, A., El-Yamani, N.,
Lopez-Campos, C., Mayet-Machado, E., Rincon-Castaneda, C. B., Limones-Aguilar Mde, L., Lopez-Campos, J. E., de Leon, M. B., Gonzalez-Hernandez, S.,et al. (2010). Arsenic induces DNA damage in environmentally exposed Mexican children and adults. Influence of GSTO1 and AS3MT polymorphisms.
Toxicol. Sci.117, 63–71.
Schlawicke Engstrom, K., Broberg, K., Concha, G., Nermell, B., Warholm, M., and Vahter, M. (2007). Genetic polymorphisms influencing arsenic metabolism: Evidence from Argentina.
Environ. Health Perspect.115, 599–605.
Schlebusch, C. M., Gattepaille, L. M., Engstrom, K., Vahter, M., Jakobsson, M., and Broberg, K. (2015). Human adaptation to arsenic-rich environments.Mol. Biol. Evol.32, 1544–1555. Schwerdtle, T., Walter, I., Mackiw, I., and Hartwig, A. (2003).
Induction of oxidative DNA damage by arsenite and its triva-lent and pentavatriva-lent methylated metabolites in cultured hu-man cells and isolated DNA.Carcinogenesis24, 967–974. Smith, A. H., Lingas, E. O., and Rahman, M. (2000).
Contamination of drinking-water by arsenic in Bangladesh: A public health emergency. Bull. World Health Organ. 78, 1093–1103.
Styblo, M., Del Razo, L. M., LeCluyse, E. L., Hamilton, G. A., Wang, C., Cullen, W. R., and Thomas, D. J. (1999). Metabolism of ar-senic in primary cultures of human and rat hepatocytes.
Chem. Res. Toxicol.12, 560–565.
Styblo, M., Del Razo, L. M., Vega, L., Germolec, D. R., LeCluyse, E. L., Hamilton, G. A., Reed, W., Wang, C., Cullen, W. R., and Thomas, D. J. (2000). Comparative toxicity of trivalent and pentavalent inorganic and methylated arsenicals in rat and human cells.Arch. Toxicol.74, 289–299.
Su, C. T., Lin, H. C., Choy, C. S., Huang, Y. K., Huang, S. R., and Hsueh, Y. M. (2012). The relationship between obesity, insu-lin and arsenic methylation capability in Taiwan adoles-cents.Sci. Total Environ.414, 152–158.
Sun, G., Xu, Y., Li, X., Jin, Y., Li, B., and Sun, X. (2007). Urinary ar-senic metabolites in children and adults exposed to arar-senic in drinking water in Inner Mongolia, China.Environ. Health
Perspect.115, 648–652.
Sung, T. C., Huang, J. W., and Guo, H. R. (2015). Association be-tween arsenic exposure and diabetes: A meta-analysis.Biomed.
Res. Int.2015, doi: http://dx.doi.org/10.1155/2015/368087.
Thomas, D. J., Li, J., Waters, S. B., Xing, W., Adair, B. M., Drobna, Z., Devesa, V., and Styblo, M. (2007). Arsenic (þ3 oxidation state) methyltransferase and the methylation of arsenicals.
Exp. Biol. Med. (Maywood)232, 3–13.
Tseng, C. H. (2007). Arsenic methylation, urinary arsenic metab-olites and human diseases: Current perspective. J. Environ.
Sci. Health C Environ. Carcinog. Ecotoxicol. Rev.25, 1–22.
Tseng, C. H. (2009). A review on environmental factors regulating arsenic methylation in humans.Toxicol. Appl. Pharmacol.235, 338–350.
Vahter, M. (2002). Mechanisms of arsenic biotransformation.
Toxicology181–182, 211–217.
Vahter, M., and Concha, G. (2001). Role of metabolism in arsenic toxicity.Pharmacol. Toxicol.89, 1–5.
Valenzuela, O. L., Borja-Aburto, V. H., Garcia-Vargas, G. G., Cruz-Gonzalez, M. B., Garcia-Montalvo, E. A., Calderon-Aranda, E. S., and Del Razo, L. M. (2005). Urinary trivalent methylated ar-senic species in a population chronically exposed to inorganic arsenic.Environ. Health Perspect.113, 250–254.
Valenzuela, O. L., Drobna, Z., Hernandez-Castellanos, E., Sanchez-Pena, L. C., Garcia-Vargas, G. G., Borja-Aburto, V. H., Styblo, M., and Del Razo, L. M. (2009). Association of AS3MT polymorphisms and the risk of premalignant arsenic skin le-sions.Toxicol. Appl. Pharmacol.239, 200–207.
Wood, T. C., Salavagionne, O. E., Mukherjee, B., Wang, L., Klumpp, A. F., Thomae, B. A., and Weinshilboum, R. M. (2006). Human arsenic methyltransferase (AS3MT) pharmacogenetics: Gene resequencing and functional genomics studies.J. Biol. Chem. 281, 7364–7373.
World Health Organization. (2006).Definition and diagnosis of dia-betes mellitus and intermediate hyperglycaemia: Report of a WHO/
IDF consultation. https://www.idf.org/webdata/docs/WHO_