Macronutrient Intake, Diagnosis Status, and Glycemic
Control Among US Hispanics/Latinos With Diabetes
Xueyin Wang, Molly Jung, Yasmin Mossavar-Rahmani, Daniela Sotres-Alvarez, Rebeca A. Espinoza Giacinto, Amber Pirzada, Samantha A. Reina,
Sarah S. Casagrande, Tao Wang, M. Larissa Avilés-Santa, Robert C. Kaplan, and Qibin Qi*
Context:Diet modification is a mainstay of diabetes management. US Hispanics/Latinos are dis-proportionately affected by diabetes, but few studies have examined dietary intake among US Hispanics/Latinos with diabetes, and little is known regarding the influence of diabetes awareness on dietary intake.
Objective:We evaluated macronutrient intake and its associations with diabetes awareness and glycemic control among US Hispanics/Latinos with diabetes.
Participants:This analysis included 3310 diabetic adults aged 18 –74 years from the Hispanic Com-munity Health Study/Study of Latinos (2008 –2011).
Main Outcome Measures:Diabetes was defined as diagnosed (based on medical history or anti-hyperglycemic medication use) or undiagnosed diabetes (based on fasting glucoseⱖ126 mg/dL, glycated hemoglobin [HbA1c]ⱖ6.5%, or 2 h glucoseⱖ200 mg/dL in the absence of a physician diagnosis). Dietary intake was assessed using two 24-hour recalls.
Results:Among Hispanic/Latino adults with diabetes, 21.2%, 55.7%, and 71.2% met the American Diabetes Association recommendations for fiber (ⱖ14 g per 1000 kcal), saturated fat (⬍10% of total energy), and cholesterol intake (⬍300 mg), respectively. Compared with those with undiag-nosed diabetes, people with diagundiag-nosed diabetes consumed less carbohydrate (50.3 vs 52.4% of total energy;P⫽.017), total sugar (19.1 vs 21.5% of total energy;P⫽.002), added sugar (9.8 vs 12.1% of total energy;P⬍.001), and more total fat (30.7 vs 29.3% of total energy;P⫽.048) and monounsaturated fat (11.5 vs 10.7% of total energy;P⫽.021). Association between diabetes awareness and low total and added sugar intake was observed in individuals of Mexican and Puerto Rican background but not in other groups (Pfor interaction⬍.05). Among people with diagnosed diabetes, those with HbA1c of 7% or greater consumed more total fat, saturated fat, and choles-terol than those with HbA1c less than 7% (allP⬍.05).
Conclusions:Among US Hispanics/Latinos with diabetes, fiber intake is low, and diabetes aware-ness is associated with reduced carbohydrate and sugar intake and increased monounsaturated fat intake. Sugar intake may require special attention in certain Hispanic/Latino background groups.(J Clin Endocrinol Metab101: 1856 –1864, 2016)
H
ispanics/Latinos are the largest minority group of the US population (1) and suffer disproportionately from diabetes (2). Baseline examination data from the His-panic Community Health Study/Study of Latinos (HCHS/ SOL) estimated that the prevalence of diabetes in Hispan-ic/Latino adults aged 18 –74 years was 16.9%, rangingfrom 10.2% among Hispanics/Latinos of South American background to 18.3% among those of Mexican descent (3). There is some evidence that US Hispanics/Latinos tend to have poorer diabetes outcomes and suboptimal self-monitoring of lipids, blood glucose, and blood pressure compared with non-Hispanic whites (4 – 6). Moreover,
ISSN Print 0021-972X ISSN Online 1945-7197 Printed in USA
Copyright © 2016 by the Endocrine Society Received August 21, 2015. Accepted March 2, 2016. First Published Online March 7, 2016
* Author Affiliations are shown at the bottom of the next page.
Abbreviations: ADA, American Diabetes Association; HbA1c, glycated hemoglobin; HCHS/ SOL, Hispanic Community Health Study/Study of Latinos; NHANES, National Health and Nutrition Examination Survey.
1856 press.endocrine.org/journal/jcem J Clin Endocrinol Metab, April 2016, 101(4):1856 –1864 doi: 10.1210/jc.2015-3237
the US Hispanic/Latino population is a heterogeneous group, with differences in diabetes control and manage-ment across diverse backgrounds which may be attributed to differences in socioeconomic status, acculturation, ac-cess to health care, income level, lifestyles, and dietary patterns (7, 8).
Nutrition therapy is one of the most vital and effective components of diabetes management (9), and what con-stitutes a healthy dietary pattern may differ across popu-lations and cultures. Carbohydrate intake is a major factor of glycemic control due to its immediate effect on post-prandial glucose levels (10). Several randomized trials have indicated that replacement of saturated fatty acids and carbohydrate with monounsaturated fatty acids im-proves glycemic control and other metabolic parameters among subjects with diabetes (11–14). The American Di-abetes Association (ADA) recommends increased con-sumption of fiber (ⱖ14 g per 1000 kcal) (9), which has been shown to improve cardiovascular disease risk factor control and other complications among individuals with diabetes (10, 15).
Recent data from the National Health and Nutrition Examination Survey (NHANES) 2005–2010 suggested that awareness of diabetes status may favorably affect some dietary patterns (eg, less sugar and carbohydrate intake) in individuals with diabetes (16). Another study also reported that higher fat and lower carbohydrate in-takes were associated with worse glycemic control in American Indians (17). However, no study has examined macronutrient and fiber intake among US Hispanics/La-tinos of diverse backgrounds with diabetes. Therefore, in this study, we evaluated macronutrient and fiber intake among US Hispanic/Latino adults with diabetes from the HCHS/SOL and further examined whether dietary intake differed by diabetes awareness and glycemic control.
Materials and Methods
Study population
The HCHS/SOL is a population-based cohort study designed to examine the prevalence and development of chronic diseases among Hispanic/Latino individuals residing in four US commu-nities (Bronx, New York; Chicago, Illinois; Miami, Florida; and San Diego, California). Details of the sample design and cohort selection are provided elsewhere (18, 19). Briefly, between March 2008 and June 2011, the HCHS/SOL examined 16 415 Hispanic/Latino men and women aged 18 –74 years. Participants
were recruited from randomly selected households in the four field centers through a stratified two-stage area probability sam-pling approach. The data collection included demographic char-acteristics, standardized clinical examination components, fast-ing and postglucose load blood collection, medical history, and assessment of health behaviors and acculturation-related fac-tors. In the current study, 3310 subjects with diabetes were in-cluded after exclusion of diabetic individuals with two unreliable 24-hour dietary recalls (n⫽72); those with abnormal or missing energy intake (n⫽91); and those with missing diagnosis status (n ⫽56). In addition, we also included 12 548 individuals without diabetes for further comparison between people with diabetes and those without diabetes. All participants gave their written informed consent, and the study was approved by the institutional review boards at each participating institution.
Diabetes definition
Diagnosed diabetes mellitus was defined as self-reported his-tory of physicidiagnosed diabetes or documented use of an-tihyperglycemic agents. Undiagnosed diabetes mellitus was de-fined as not having been diagnosed by a physician and not taking antihyperglycemic medications but meeting laboratory criteria at field examination: fasting plasma glucose of 126 mg/dL or greater, 2-hour postload glucose levels of 200 mg/dL or greater, or a glycated hemoglobin (HbA1c) level of 6.5% or greater. Study participants with diagnosed diabetes were considered to have their blood glycemic levels well controlled if their HbA1c was less than 7.0%; and those with an HbA1c of 7.0% or greater were considered to be uncontrolled.
Dietary intake
Macronutrient intake was assessed using two 24-hour dietary recalls. The first 24-hour dietary recall was conducted in person at the time of the baseline interview, whereas the second was performed primarily via telephone approximately 30 days after the baseline interview. Interviews were conducted in Spanish or English based on the participant’s preference using the multiple-pass method. Diet assessments were performed using the Nutri-tion Data System for Research software (version 11) developed by the Nutrition Coordinating Center at the University of Min-nesota. The Nutrition Data System for Research used in the pres-ent study included common foods, brand-name products, and Hispanic/Latino foods. Detailed information on dietary data col-lection has been previously published elsewhere (20).
In this study, dietary intake variables of interest included total energy, carbohydrate, total and added sugar, fiber, protein, total fat, saturated, monounsaturated, and polyunsaturated fatty ac-ids, and total cholesterol. We used the means of two 24-hour diet recalls to quantify usual dietary intake of the aforementioned macronutrients. Recalls with energy below the sequence-sex-specific first percentile or greater than the 99th percentile or those that were considered to be unreliable according to the interviewer were excluded.
Department of Epidemiology and Population Health (X.W., M.J., Y.M.-R., T.W., R.C.K., Q.Q.), Albert Einstein College of Medicine, Bronx, New York 10461; Department of Epidemiology and Biostatistics (X.W.), School of Public Health, Peking University Health Science Center, Beijing 100191, China; Collaborative Studies Coordinating Center (D.S.-A.), Department of Biostatistics, Gillings School of Global Public Health, University of North Carolina at Chapel Hill, Chapel Hill, North Carolina 27599; San Diego State University (R.A.E.G.), San Diego, California 92182; Institute for Minority Health Research (A.P.), University of Illinois at Chicago, Chicago, Illinois 60637; Department of Psychology (S.A.R.), University of Miami, Miami, Florida 33136; National Institute of Diabetes and Digestive and Kidney Diseases (S.S.C.), National Institutes of Health, Bethesda, Maryland 20892; and Division of Cardiovascular Sciences (M.L.A.-S.), National Heart, Lung, and Blood Institute, National Institutes of Health, Bethesda, Maryland 20824
Covariates
Height and weight were measured during the in-person ex-amination. Body mass index was calculated as weight in kilo-grams divided by the square of height in meters and was cate-gorized as normal weight (⬍25 kg/m2
); overweight (ⱖ25 kg/m2 and⬍30 kg/m2); and obese (ⱖ30 kg/m2). Self-reported data were used to define Hispanic/Latino background (Dominican, Central American, Cuban, Mexican, Puerto Rican, South Amer-ican, or mixed/other); nativity (born within 50 US states or not); length of time in the United States (⬍10 y orⱖ10 y); annual household income (⬍$20,000, $20,000-$49,999, orⱖ$50,000, not reported); education level (less than high school, high school equivalent, greater than high school); health insurance (yes or no); physical activity (metabolic equivalents in minutes per day); cigarette use (current, former, or never); alcohol use (current, former, or never); diabetes medication use (yes or no); family history of diabetes (yes or no); and medical history of diabetes by using standardized instruments. Physical activity was measured as metabolic equivalents in minutes per day during work and travel and leisure time provided by the Global Physical Activity Questionnaire, which was developed by the World Health Or-ganization (scoring information is available:www.who.int/chp/ steps). Participants were instructed to bring in their currently used prescription medications, which were scanned or tran-scribed into a database and matched to a Medical Therapeutic Classification or the National Drug Code.
Statistical analyses
General linear regression and2
tests were used to compare means and proportions of participant characteristics by diabetes
diagnosis status. Means and SEs of usual macronutrient intake were estimated using predicted marginals from separate general linear regression models for each macronutrient by diagnosis status and control status. These models were adjusted for age, sex, field center, Hispanic/Latino background, body mass index categories, use of diabetes medication, family history of diabetes, annual household income, education level, nativity, length of time in the United States, health insurance status, cigarette use, alcohol use, and physical activity level. Similarly, separate general linear regression models were used to examine differences in dietary in-take between people without diabetes and those with undiagnosed or diagnosed diabetes, respectively. In addition, among participants with diagnosed diabetes separate linear regression models were fit with HbA1c levels as the dependent variable and each macronu-trient dietary intake as the independent variable adjusting by pre-viously mentioned covariates. We further conducted stratified anal-yses by Hispanic/Latino background, sex, and age groups (⬍45 andⱖ45 y). All analyses accounted for complex survey design and were performed using SAS version 9.3 software (SAS Institute) or SAS-callable SUDAAN software, release 11 (RTI International, Re-search Triangle Park, NC).
Results
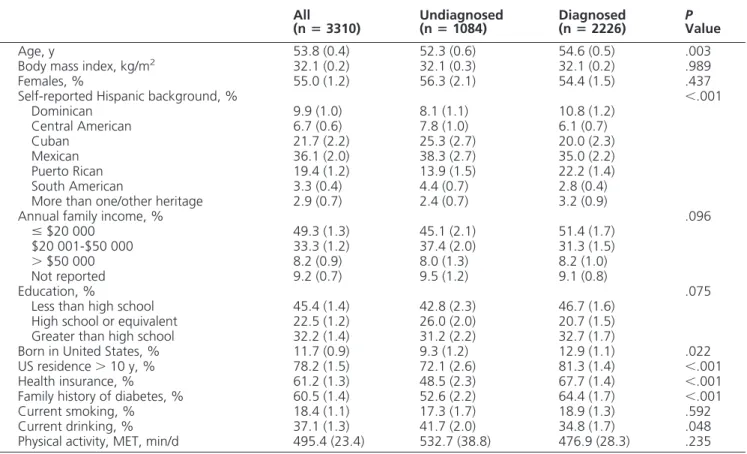
Table 1 shows the characteristics of the study sample. Among 3310 participants with diabetes, 1820 (55.0%) were females, and 2226 (67.3%) were aware of their
di-Table 1. Characteristics of Hispanics/Latinos With Diabetes, Hispanic Community Health Study/Study of Latinos, 2008 –2011
All
(nⴝ3310)
Undiagnosed (nⴝ1084)
Diagnosed (nⴝ2226)
P Value
Age, y 53.8 (0.4) 52.3 (0.6) 54.6 (0.5) .003 Body mass index, kg/m2 32.1 (0.2) 32.1 (0.3) 32.1 (0.2) .989 Females, % 55.0 (1.2) 56.3 (2.1) 54.4 (1.5) .437 Self-reported Hispanic background, % ⬍.001
Dominican 9.9 (1.0) 8.1 (1.1) 10.8 (1.2) Central American 6.7 (0.6) 7.8 (1.0) 6.1 (0.7) Cuban 21.7 (2.2) 25.3 (2.7) 20.0 (2.3) Mexican 36.1 (2.0) 38.3 (2.7) 35.0 (2.2) Puerto Rican 19.4 (1.2) 13.9 (1.5) 22.2 (1.4) South American 3.3 (0.4) 4.4 (0.7) 2.8 (0.4) More than one/other heritage 2.9 (0.7) 2.4 (0.7) 3.2 (0.9)
Annual family income, % .096
ⱕ$20 000 49.3 (1.3) 45.1 (2.1) 51.4 (1.7) $20 001-$50 000 33.3 (1.2) 37.4 (2.0) 31.3 (1.5)
⬎$50 000 8.2 (0.9) 8.0 (1.3) 8.2 (1.0) Not reported 9.2 (0.7) 9.5 (1.2) 9.1 (0.8)
Education, % .075
Less than high school 45.4 (1.4) 42.8 (2.3) 46.7 (1.6) High school or equivalent 22.5 (1.2) 26.0 (2.0) 20.7 (1.5) Greater than high school 32.2 (1.4) 31.2 (2.2) 32.7 (1.7)
Born in United States, % 11.7 (0.9) 9.3 (1.2) 12.9 (1.1) .022 US residence⬎10 y, % 78.2 (1.5) 72.1 (2.6) 81.3 (1.4) ⬍.001 Health insurance, % 61.2 (1.3) 48.5 (2.3) 67.7 (1.4) ⬍.001 Family history of diabetes, % 60.5 (1.4) 52.6 (2.2) 64.4 (1.7) ⬍.001 Current smoking, % 18.4 (1.1) 17.3 (1.7) 18.9 (1.3) .592 Current drinking, % 37.1 (1.3) 41.7 (2.0) 34.8 (1.7) .048 Physical activity, MET, min/d 495.4 (23.4) 532.7 (38.8) 476.9 (28.3) .235
Abbreviation: MET, metabolic equivalent. Data are means (SEs) or percentages (SEs). All values were weighted to account for complex survey design.
abetes status. Compared with individuals with undiag-nosed diabetes, those with diagundiag-nosed diabetes were older and were more likely to have been born in the United States (50 US states only), to have resided in the United States for more than 10 years, to have health insurance, to have a family history of diabetes, and to not consume alcohol (all P⬍.05). Individuals with diagnosed diabetes were more likely to be of Dominican or Puerto Rican background than their undiagnosed counterparts (P⬍.001).
Macronutrient intake by diagnosis status of diabetes
Table 2 presents macronutrient and fiber intakes among all diabetic participants as well as by diabetes di-agnosis status. Overall, on a given day, Hispanic/Latino adults with diabetes consumed 51.1% of their daily total energy from carbohydrate (19.9% and 10.6% from total sugar and added sugar, respectively), 18.1% from protein, 30.2% from total fat (9.9% from saturated fats), and con-sumed 10.9 g fiber per 1000 kcal and 246.8 mg total cho-lesterol. Moreover, 21.2% of Hispanic/Latino adults with diabetes met the ADA recommendations for fiber intake (ⱖ14 g per 1000 kcal), ranging from 9.5% among those of Puerto Rican background to 33.6% among those of Mexi-can background; 55.7% of Hispanic/Latino adults with di-abetes met the ADA recommendations for saturated fat in-take (⬍10% of total kilocalories), ranging from 50.8% (Puerto Rican background) to 70.1% (Dominican
back-ground); 71.2% of Hispanics/Latino adults with diabetes met the ADA recommendations for total cholesterol intake (⬍300 mg), ranging from 64.3% (Mexican background) to 86.6% (Dominican background) (Supplemental Table 1).
The self-reported mean total energy intake was 1706.9 kcal/d in US Hispanics/Latinos with diabetes (Table 2), and there was no significant difference between individ-uals with diagnosed diabetes and those with undiagnosed diabetes. The relatively low energy intake reflects signif-icant underreporting, which has been confirmed in our prior work when compared with the biomarker doubly labeled water (21). Compared with adults with undiag-nosed diabetes, individuals with diagundiag-nosed diabetes con-sumed less carbohydrate (50.3 vs 52.4% of total energy, P⫽.017), total sugar (80.3 vs 89.3 g/d,P⫽.022; 19.1 vs 21.5% of total energy,P⫽.002), added sugar (43.1 vs 52.0 g/d,P⫽.008; 9.8 vs 12.1% of total energy,P⬍.001), and more total fat (30.7 vs 29.3% of total energy,P⫽ .048), monounsaturated fatty acids (23.5 vs 21.0 g/d,P⫽ .033; 11.5 vs 10.7% of total energy,P⫽.021), total cho-lesterol (255.7 vs 229.8 mg/d,P⫽.047; 152.4 vs 136.9 mg per 1000 kcal,P⫽.031). In particular, adults with diag-nosed diabetes were less likely to consume sugar-sweet-ened beverages than their undiagnosed counterparts (38.6 vs 47.4 g/d,P⫽.010; 8.8 vs 11.0% of total energy,P⫽ .004) (Supplemental Table 2). No significant differences in daily total energy, fiber, or protein intake were observed
Table 2. Macronutrient Intake Among Hispanics/Latinos With Diabetes by Diagnosis Status, Hispanic Community Health Study/Study of Latinos, 2008 –2011
All
(nⴝ3310)
Undiagnosed (nⴝ1084)
Diagnosed (nⴝ2226)
P Value
Total energy, kcal 1706.9 (15.3) 1688.0 (39.2) 1716.9 (24.2) .598 Carbohydrate, g 219.2 (2.2) 221.0 (5.5) 218.2 (3.6) .728 Total kilocalories, % 51.1 (0.2) 52.4 (0.6) 50.3 (0.4) .017 Total sugar, g 83.4 (1.1) 89.3 (2.9) 80.3 (1.7) .022 Total kilocalories, % 19.9 (0.2) 21.5 (0.6) 19.1 (0.3) .002 Added sugar, g 46.2 (0.9) 52.0 (2.4) 43.1 (1.4) .008 Total kilocalories, % 10.6 (0.2) 12.1 (0.5) 9.8 (0.3) ⬍.001 Fiber, g 17.9 (0.2) 17.5 (0.5) 18.1 (0.3) .454 Fiber, g per 1000 kcal 10.9 (0.1) 10.8 (0.3) 10.9 (0.2) .624 Protein, g 74.7 (0.8) 71.1 (2.0) 76.6 (1.4) .069 Total kilocalories, % 18.1 (0.1) 17.6 (0.3) 18.4 (0.2) .077 Total fat, g 60.7 (0.7) 57.0 (1.9) 62.6 (1.3) .060 Total kilocalories, % 30.2 (0.2) 29.3 (0.5) 30.7 (0.3) .048 Saturated fatty acids, g 19.6 (0.2) 18.7 (0.7) 20.0 (0.4) .163 Total kilocalories, % 9.9 (0.1) 9.6 (0.2) 10.0 (0.1) .185 Monounsaturated fatty acids, g 22.6 (0.3) 21.0 (0.8) 23.5 (0.6) .033 Total kilocalories, % 11.2 (0.1) 10.7 (0.2) 11.5 (0.2) .021 Polyunsaturated fatty acids, g 13.2 (0.2) 12.4 (0.6) 13.7 (0.4) .143 Total kilocalories, % 6.5 (0.1) 6.4 (0.2) 6.5 (0.1) .589 Total cholesterol, mg 246.8 (3.9) 229.8 (9.0) 255.7 (6.3) .047 Total cholesterol, mg per 1000 kcal 147.0 (2.2) 136.9 (4.9) 152.4 (3.6) .031
Data are means (SEs), adjusted for age, sex, field center, Hispanic/Latino background, body mass index categories, use of diabetes medications, family history of diabetes, annual household income, education, born in the United States, US residence more than 10 years, health insurance status, smoking, alcohol consumption, and physical activity. All values were weighted to account for complex survey design.
between individuals with diagnosed and undiagnosed di-abetes (Table 2). In addition, we also repeated these anal-ysis by excluding socioeconomic status (indicated by ed-ucation, annual household income, born in the United States, and US residence more than 10 y), access to medical care (indicated by health insurance status), and family his-tory of diabetes as covariates in the models one at a time. The results did not change materially (data not shown).
To further investigate the influence of diabetes status on dietary intake, we also compared dietary intake among in-dividuals with diabetes and those without diabetes. Individ-uals with undiagnosed and diagnosed diabetes tended to con-sume less total sugar and added sugar and more fiber and protein, compared with those without diabetes (Table 3). These differences in dietary intake were more significant in the comparison between individuals with diagnosed diabetes and those without diabetes. In addition, adults with diag-nosed diabetes were more likely to consume less carbohy-drate (49.3 vs 51.8% of total energy,P⫽.002) and more total fat (31.7 vs 30.2% of total energy,P⫽.032) and mono-unsaturated fat (11.8 vs 11.1% of total energy,P⫽.018), compared with those without diabetes.
We then examined total and added sugar intake (as percentage of total energy) between diagnosed and undi-agnosed adults with diabetes across Hispanic/Latino backgrounds. As shown in Figure 1, total and added sugar
intakes were lower in participants with diagnosed diabetes than their undiagnosed counterparts among those of Mex-ican (total sugar: 19.1 vs 23.6% of total energy,P⬍.001; added sugar: 9.5 vs 13.5% of total energy;P⬍.001) and Puerto Rican backgrounds (total sugar: 20.0 vs 23.2% of total energy;P⫽.043; added sugar: 11.6 vs 15.5% of total energy;P⫽.009). No significant difference was found in other Hispanic/Latino background groups.
We also performed stratified analyses by Hispanic/La-tino background (Supplemental Table 3), sex ( Supplemen-tal Table 4), and age groups (Supplemental Table 5). Re-sults were generally consistent pertaining to differences in macronutrient intake between adults who had diagnosed vs undiagnosed diabetes across subgroups.
Macronutrient intake by glycemic control
We examined associations between dietary intake and glycemic control among individuals with diagnosed dia-betes. As shown in Table 4, among Hispanic/Latino adults with diabetes, individuals with HbA1c less than 7% con-sumed less total fat (30.1 vs 31.0% of total energy,P⫽ .039), saturated fat (9.7 vs 10.2% of total energy, P⫽ .001), and total cholesterol (144.0 vs 156.4 mg per 1000 kcal,P⫽.017) compared with those with HbA1c of 7% or greater. We also found a borderline significantly greater intake of carbohydrate (51.1 vs 50.1% of total energy,P⫽
Table 3. Macronutrient Intake Among Hispanics/Latinos by Diagnosis Status, Hispanic Community Health Study/ Study of Latinos, 2008 –2011
Nondiabetics
(nⴝ12 548) Undiagnosed(nⴝ1084) Diagnosed(nⴝ2226) P1 P2
Total energy, kcal 1914.2 (10.1) 1871.7 (30.1) 1891.6 (42.7) .160 .636 Carbohydrate, g 250.0 (1.6) 242.5 (4.4) 238.3 (6.5) .086 .106 Total kilocalories, % 51.8 (0.2) 51.4 (0.4) 49.3 (0.7) .332 .002 Total sugar, g 105.7 (0.9) 99.2 (2.4) 89.8 (3.2) .007 ⬍.001
Total kilocalories, % 22.4 (0.1) 21.6 (0.5) 19.4 (0.6) .077 ⬍.001 Added sugar, g 69.3 (0.8) 62.8 (1.9) 53.8 (2.7) ⬍.001 ⬍.001 Total kilocalories, % 14.3 (0.1) 13.3 (0.4) 11.2 (0.5) .016 ⬍.001 Fiber, g 17.2 (0.1) 17.6 (0.4) 17.9 (0.6) .462 .266 Fiber, g per 1000 kcal 9.3 (0.1) 9.8 (0.2) 9.9 (0.2) .033 .022 Protein, g 79.0 (0.5) 79.0 (1.3) 84.1 (2.5) .956 .067 Total kilocalories, % 17.0 (0.1) 17.5 (0.2) 18.2 (0.4) .016 .002 Total fat, g 67.9 (0.6) 65.7 (1.3) 71.1 (2.4) .100 .219 Total kilocalories, % 30.2 (0.1) 30.1 (0.3) 31.7 (0.6) .813 .032 Saturated fatty acids, g 22.2 (0.2) 21.3 (0.5) 22.7 (0.8) .072 .584 Total kilocalories, % 9.9 (0.1) 9.8 (0.1) 10.3 (0.2) .545 .196 Monounsaturated fatty acids, g 24.9 (0.2) 24.1 (0.5) 26.4 (0.9) .102 .142 Total kilocalories, % 11.1 (0.1) 11.0 (0.1) 11.8 (0.3) .589 .018 Polyunsaturated fatty acids, g 14.8 (0.1) 14.5 (0.4) 15.9 (0.7) .501 .185 Total kilocalories, % 6.5 (0.04) 6.6 (0.1) 6.8 (0.2) .400 .257 Total cholesterol, mg 269.4 (2.7) 259.8 (6.3) 283.6 (10.7) .143 .232 Total cholesterol, mg per 1000 kcal 142.6 (1.5) 141.4 (3.7) 155.7 (6.1) .760 .051
P1indicated differences between individuals without diabetes and those with undiagnosed diabetes.P2indicated differences between individuals without diabetes and those with diagnosed diabetes. Data are means (SEs), adjusted for age, sex, field center, Hispanic/Latino background, body mass index categories, use of diabetes medications, family history of diabetes, annual household income, education, born in the United States, US residence more than 10 years, health insurance status, smoking, alcohol consumption, and physical activity. All values were weighted to account for complex survey design.
.069) in diabetic individuals with HbA1c less than 7% than those with HbA1c of 7% or greater. In addition, we also examined the associations between macronutrient di-etary intake and HbA1c levels as continuous variables. There were no statistically significant associations be-tween the macronutrient dietary intake and HbA1c levels (Supplemental Table 6), but the directions of the associ-ations were generally consistent with the results in Table 4 by comparing individuals with HbA1c less than 7% and those with HbA1c of 7% or greater.
Discussion
The ADA dietary guidelines for patients with diabetes rec-ommend increasing fiber intake to 14g per 1000 kcal and
reducing saturated fat to less than 10% of total energy intake, dietary cholesterol less than 300 mg/d (9). Our study found that only 21.2% of US Hispanic/Latino adults with diabetes met the ADA recommenda-tions for fiber intake. This is consis-tent with data from NHANES 2005– 2010 (predominantly non-Hispanic white population) (16). Although it would be impracticable to consume the required amount of fiber (⬎50 g/d) for glycemic control improve-ment, individuals with diabetes are still encouraged to increase fiber in-take due to its potential benefits on cardiovascular disease risk factors such as decreases in total and low-density lipoprotein cholesterol (9, 10). Whereas NHANES data showed that US diabetic patients consumed on average slightly more saturated fat than is recommended (16), the aver-age saturated fat intake in our His-panic/Latino diabetic population (9.9% of calories) was aligned with the ADA recommendations, regard-less of diagnosis status of diabetes. In addition, the majority of individuals in the HCHS/SOL with diabetes (71.2%) met the ADA recommenda-tions for total cholesterol intake.
A major contribution of this study is that we extend previous findings (16) to US Hispanics/Latinos of di-verse backgrounds. Both the HCHS/ SOL and the NHANES 2005–2010 (16) demonstrated that individuals who were aware of having diabetes consumed less carbohydrates and sugars than their undiagnosed counterparts. People who are aware of their diabetes might have more knowledge about healthful diets and modify their diet/lifestyle to control their glucose levels. This is particularly pertinent for con-sumption of sugar-containing foods/drinks, especially sugar-sweetened beverages, which should be limited or avoided in people with diabetes according to the ADA recommendations (9). Consistent with our results, a pre-vious study has reported that adults with diagnosed dia-betes had a lower consumption of added sugar from sugar-sweetened beverages than those with undiagnosed diabetes (22). Also, our study found that individuals with diagnosed diabetes tended to consume more monounsat-Figure 1. Total and added sugar intake (% from energy) among Hispanics/Latinos with diabetes
by diagnosis status of diabetes, stratified by Hispanic background, Hispanic Community Health Study/Study of Latinos, 2008 –2011. *,P⬍.05 comparing diagnosed vs undiagnosed groups within Hispanic background. Data are means (SEs), adjusted for age, sex, field center, body mass index categories, use of diabetes medications, family history of diabetes, annual household income, education, born in the United States, US residence more than 10 years, health insurance status, smoking, alcohol consumption, and physical activity, stratified by Hispanic/Latino background. All values were weighted to account for complex survey design.
urated fat than their undiagnosed counterparts. Numer-ous studies have indicated that high monounsaturated fat intake is associated with glycemic control and improved insulin responsiveness, blood lipid profiles, and cardio-vascular risk factors (9, 14, 23–25).
A unique contribution of this study is that we evaluated dietary intake in adults with diabetes of diverse Hispanic/ Latino backgrounds. Interestingly, we found that people of Mexican and Puerto Rican backgrounds with diag-nosed diabetes consumed less total and added sugar than their undiagnosed counterparts, but there was no obvious such difference among other Hispanic/Latino background groups. This may suggest that, after diagnosis of diabetes, individuals of Mexican and Puerto Rican Hispanic back-grounds might make a greater effort to limit total and added sugar intake or be less likely to report higher levels of intake compared with those of other Hispanic/Latino backgrounds, although the underlying reasons are un-clear. At the same time, it should be noted that total and added sugar intake was much higher in people with
un-diagnosed diabetes of Mexican (total sugar: 23.6% of to-tal energy; added sugar: 13.5% of toto-tal energy) and Puerto Rican (total sugar: 23.2% of total energy; added sugar: 15.5% of total energy) backgrounds than in those of other Hispanic/Latino backgrounds (total sugar: 17.9%–20.5% of total energy; added sugar: 7.9%–11.3% of total en-ergy). This may imply that total and added sugar intake is high among Mexican and Puerto Rican background inviduals, and therefore reducing its consumption after di-abetes diagnosis is more feasible compared with those of other Hispanic/Latino backgrounds. Nevertheless, our findings should be interpreted with caution because of reporting bias in self-reported dietary data. It is possible that some individuals might be more familiar with macro-nutrient composition of traditional meals or food com-monly consumed by their group of background.
Another major finding of our study is that low total and saturated fat intake and low total cholesterol intake were associated with good glycemic control among US Hispan-ic/Latino adults with diagnosed diabetes. Our results are consistent with those observed in US diabetic men from the NHANES 2005–2010 (16), American Indians with dia-betes (17), and African American women with diadia-betes (26). An adverse effect of high saturated fat consumption on HbA1c levels has been also observed in individuals without diabetes (27). Interestingly, we also found that carbohydrate intake was marginally significantly higher in diabetic people with good glycemic control than those with poor glycemic control, which is consistent with pre-vious studies (16, 17). However, it should be noted that quality and/or resources of carbohydrates were not exam-ined, and these data were based on cross-sectional obser-vational studies. In addition, underreporting of sugar-sweetened beverage intake was observed in individuals with overweight and obesity, which might influence the positive association between sugar-sweetened beverage intake and risk of obesity (28). Thus, we speculate that carbohydrate intake including sugar intake might be un-derreported in those diabetic individuals with poor glyce-mic control, but further research is needed to clarify this. This study may have important public health implica-tions because our findings further emphasize the impor-tance of diabetes awareness, which may help people to improve dietary eating behaviors. This might be of par-ticular importance to US Hispanic/Latinos who have a high prevalence of diabetes mellitus. Moreover, a large proportion of diabetes cases (⬃40%) have been found to be undiagnosed in our US Hispanic/Latino study (3), which was similar to that found in non-Hispanic whites (29). Many diet recommendations have been developed for the management of individuals with diabetes. For ex-ample, carbohydrate intake from vegetables, fruits, whole
Table 4. Macronutrient Intake Among
Hispanics/Latinos With Diagnosed Diabetes by Glycemic Control, Hispanic Community Health Study/Study of Latinos, 2008 –2011
HbA1C
<7.0% (nⴝ967)
HbA1C
>7.0%
(nⴝ1242) P Value
Total energy, kcal 1693.2 (29.9) 1657.8 (24.6) .364 Carbohydrates, g 218.3 (4.3) 208.0 (3.40) .054 Total kilocalories, % 51.1 (0.4) 50.1 (0.4) .069 Total sugar, g 81.1 (2.0) 76.1 (1.8) .066 Total kilocalories, % 19.5 (0.4) 18.8 (0.4) .149 Added sugar, g 43.2 (1.5) 39.7 (1.5) .118 Total kilocalories, % 9.8 (0.3) 9.3 (0.3) .252 Fiber, g 18.4 (0.4) 17.5 (0.4) .105 Fiber, g per 1000 kcal 11.2 (0.2) 11.0 (0.2) .364 Protein, g 74.7 (1.4) 74.8 (1.4) .971 Total kilocalories, % 18.3 (0.2) 18.5 (0.2) .553 Total fat, g 60.2 (1.4) 60.8 (1.3) .752 Total kilocalories, % 30.1 (0.3) 31.0 (0.3) .039 Saturated fatty acids, g 19.1 (0.5) 19.8 (0.4) .279 Total kilocalories, % 9.7 (0.1) 10.2 (0.1) .001 Monounsaturated fatty
acids, g
22.5 (0.6) 22.8 (0.6) .766
Total kilocalories, % 11.2 (0.1) 11.5 (0.2) .141 Polyunsaturated fatty
acids, g
13.4 (0.4) 13.0 (0.3) .486
Total kilocalories, % 6.6 (0.1) 6.5 (0.1) 0.635 Total cholesterol, mg 238.7 (6.9) 257.2 (6.7) 0.044 Total cholesterol, mg
per 1000 kcal
144.0 (3.9) 156.4 (3.7) 0.017
Data are means (SEs), adjusted for age, sex, field center, Hispanic/Latino background, body mass index categories, use of diabetes medications, family history of diabetes, annual household income, education, born in the United States, US residence more than 10 years, health insurance status, smoking, alcohol consumption, and physical activity. All values were weighted to account for complex survey design.
grains, legumes, and dairy products should be advised over intake from other carbohydrate sources, and total fiber intake, especially from natural food sources (vs sup-plements) may have a beneficial effect on major cardio-vascular disease risk factor control (9).
To the best of our knowledge, this is the first study evaluating macronutrient intake by awareness of diabetes in a relatively large representative population sample of US Hispanics/Latinos of diverse national backgrounds. Several limitations of this study should be noted. Due to the cross-sectional nature of this study, we were unable to test causality of the observed differences in dietary intake by diabetes awareness and glycemic control. In addition, bias and measurement error in self-reported dietary intake data are inevitable. Participants might have inaccurately described their dietary intake and have underreported foods detrimental for glycemic control or overreported healthy foods beneficial to glycemic control (20). Notably, underestimation of total energy intake, a prevalent finding in most of dietary self-report surveys (30 –32), was also observed in this study of Hispanics/Latinos with diabetes. Indeed, our previous analysis has indicated similar mean energy intake in the general US Hispanics/Latinos (20), and this systematic underreporting of energy intake has been also confirmed using objective recovery biomarkers (21). However, it should be noted that our analyses were controlled for total energy intake by using a percentage of kilocalories or a ratio per 1000 kcal for nutrient intake, but the results could be biased if underestimation of total energy intake was associated with diabetes diagnosed sta-tus. Although we have adjusted for multiple covariates in the analyses, there might be other unknown and unmea-sured confounding factors. Because of the complexity of the biological and cultural diversity within the US His-panics/Latinos, information on internal or detailed dis-parities in acculturation and custom might not be fully captured in our study. Finally, we defined undiagnosed diabetes mellitus based on one-time laboratory measure-ments. Therefore, some individuals who were classified as having undiagnosed diabetes may have not actually met clinical criteria for diabetes on repeat tests.
In conclusion, our data suggested that Hispanic/Latino adults with diabetes, in general, adhere to the ADA rec-ommendations for restricting saturated fat and total cho-lesterol intake but should need to increase fiber intake to benefit their diabetes management. Diabetes awareness is favorably associated with some aspects of dietary intake (less carbohydrate and sugar intake and greater monoun-saturated fat intake) among US Hispanics/Latinos with diabetes, further emphasizing the importance of screening for diabetes in this population. Additionally, there is sig-nificant heterogeneity in sugar intake by diabetes
aware-ness among Hispanic/Latino backgrounds, but this needs to be validated in further studies. These findings may pro-vide useful information for the development of effective diet strategies for diabetes management and control among US Hispanics/Latinos.
Acknowledgments
We thank the staff of Hispanic Community Health Study/Study of Latinos for their important contributions. A complete list of staff and investigators has been provided by P. Sorlie et al (Ann
Epidemiol.2010;20:642– 649) and is also available on the study
web site (http://www.cscc.unc.edu/hchs/).
Address all correspondence and requests for reprints to: Qibin Qi, PhD, Department of Epidemiology and Population Health, Albert Einstein College of Medicine, 1300 Morris Park Avenue, Bronx, NY 10461. E-mail:[email protected].
The opinions shared by the authors of this manuscript do not represent the opinions of the National Heart, Lung, and Blood Institute, the National Institutes of Health, or the federal government.
This work was supported by contracts from the National Heart, Lung, and Blood Institute to the University of North Car-olina (N01-HC65233), University of Miami (N01-HC65234), Albert Einstein College of Medicine (N01-HC65235), North-western University (N01-HC65236), and San Diego State Uni-versity (N01-HC65237). The following institutes/centers/offices contributed to the Hispanic Community Health Study/Study of Latinos through a transfer of funds to the National Heart, Lung, and Blood Institute: National Center on Minority Health and Health Disparities, the National Institute of Deadness and Other Communications Disorders, the National Institute of Dental and Craniofacial Research, the National Institute of Diabetes and Digestive and Kidney Diseases, the National Institute of Neuro-logical Disorders and Stroke, and the Office of Dietary Supple-ments. X.W. was supported by the China Scholarship Council. Disclosure Summary: The authors have nothing to disclose.
References
1. Ennis S, Rios-Vargas M, Albert N.2010 Census briefs: the Hispanic population: 2010. US Census Bureau.http://www.census.gov/prod/ cen2010/briefs/c2010br-04.pdf. Accessed May 1, 2015
2. Geiss LS, Wang J, Cheng YJ, et al.Prevalence and incidence trends for diagnosed diabetes among adults aged 20 to 79 years, United States, 1980 –2012.JAMA. 2014;312:1218 –1226.
3. Schneiderman N, Llabre M, Cowie CC, et al.Prevalence of diabetes among Hispanics/Latinos from diverse backgrounds: the Hispanic Community Health Study/Study of Latinos (HCHS/SOL).Diabetes Care. 2014;37:2233–2239.
4. Axon RN, Gebregziabher M, Echols C, Msph GG, Egede LE.Racial and ethnic differences in longitudinal blood pressure control in vet-erans with type 2 diabetes mellitus.J Gen Intern Med. 2011;26: 1278 –1283.
5. Egede LE, Gebregziabher M, Lynch CP, Gilbert GE, Echols C. Lon-gitudinal ethnic differences in multiple cardiovascular risk factor control in a cohort of US adults with diabetes.Diabetes Res Clin Pract2011;94:385–394.
6. Sequist TD, Adams A, Zhang F, Ross-Degnan D, Ayanian JZ.Effect of quality improvement on racial disparities in diabetes care.Arch Intern Med. 2006;166:675– 681.
7. Mainous AG 3rd, Majeed A, Koopman RJ, et al.Acculturation and diabetes among Hispanics: evidence from the 1999 –2002 National Health and Nutrition Examination Survey. Public Health Rep (Washington, DC: 1974).2006;121:60 – 66.
8. Vega WA, Rodriguez MA, Gruskin E.Health disparities in the La-tino population.Epidemiol Rev. 2009;31:99 –112.
9. Evert AB, Boucher JL, Cypress M, et al.Nutrition therapy recom-mendations for the management of adults with diabetes.Diabetes Care. 2014;37(suppl 1):S120 –S143.
10. Franz MJ, Powers MA, Leontos C, et al E.The evidence for medical nutrition therapy for type 1 and type 2 diabetes in adults.J Am Diet Assoc. 2010;110:1852–1889.
11. Brunerova L, Smejkalova V, Potockova J, Andel M.A comparison of the influence of a high-fat diet enriched in monounsaturated fatty acids and conventional diet on weight loss and metabolic parameters in obese non-diabetic and type 2 diabetic patients.Diabet Med. 2007;24:533–540.
12. Shai I, Schwarzfuchs D, Henkin Y, et al.Weight loss with a low-carbohydrate, Mediterranean, or low-fat diet.N Engl J Med. 2008; 359:229 –241.
13. Esposito K, Maiorino MI, Ciotola M, et al.Effects of a Mediterra-nean-style diet on the need for antihyperglycemic drug therapy in patients with newly diagnosed type 2 diabetes: a randomized trial.
Ann Intern Med. 2009;151:306 –314.
14. Brehm BJ, Lattin BL, Summer SS, et al.One-year comparison of a high-monounsaturated fat diet with a high-carbohydrate diet in type 2 diabetes.Diabetes Care. 2009;32:215–220.
15. Wheeler ML, Dunbar SA, Jaacks LM, et al.Macronutrients, food groups, and eating patterns in the management of diabetes: a sys-tematic review of the literature, 2010.Diabetes Care. 2012;35:434 – 445.
16. Bardenheier BH, Cogswell ME, Gregg EW, Williams DE, Zhang Z, Geiss LS.Does knowing one’s elevated glycemic status make a dif-ference in macronutrient intake?Diabetes Care. 2014;37:3143– 3149.
17. Xu J, Eilat-Adar S, Loria CM, et al.Macronutrient intake and gly-cemic control in a population-based sample of American Indians with diabetes: the Strong Heart Study.Am J Clin Nutr. 2007;86: 480 – 487.
18. Lavange LM, Kalsbeek WD, Sorlie PD, et al.Sample design and cohort selection in the Hispanic Community Health Study/Study of Latinos.Ann Epidemiol. 2010;20:642– 649.
19. Sorlie PD, Aviles-Santa LM, Wassertheil-Smoller S, et al.Design and
implementation of the Hispanic Community Health Study/Study of Latinos.Ann Epidemiol. 2010;20:629 – 641.
20. Siega-Riz AM, Sotres-Alvarez D, Ayala GX, et al.Food-group and nutrient-density intakes by Hispanic and Latino backgrounds in the Hispanic Community Health Study/Study of Latinos.Am J Clin Nutr. 2014;99:1487–1498.
21. Mossavar-Rahmani Y, Shaw PA, Wong WW, et al.Applying re-covery biomarkers to calibrate self-report measures of energy and protein in the Hispanic Community Health Study/Study of Latinos.
Am J Epidemiol. 2015;181:996 –1007.
22. Bleich SN, Wang YC.Consumption of sugar-sweetened beverages among adults with type 2 diabetes.Diabetes Care. 2011;34:551– 555.
23. Schwingshackl L, Strasser B, Hoffmann G.Effects of monounsat-urated fatty acids on glycaemic control in patients with abnormal glucose metabolism: a systematic review and meta-analysis.Ann Nutr Metab. 2011;58:290 –296.
24. Itsiopoulos C, Brazionis L, Kaimakamis M, et al.Can the Mediter-ranean diet lower HbA1c in type 2 diabetes? Results from a ran-domized cross-over study.Nutr Metab Cardiovasc Dis. 2011;21: 740 –747.
25. Tanasescu M, Cho E, Manson JE, Hu FB.Dietary fat and cholesterol and the risk of cardiovascular disease among women with type 2 diabetes.Am J Clin Nutr. 2004;79:999 –1005.
26. Bell RA, Summerson JH, Konen JC.Dietary intakes by levels of glycemic control for black and white adults with non-insulin de-pendent diabetes mellitus (NIDDM).J Am Coll Nutr. 1995;14:144 – 151.
27. Harding AH, Sargeant LA, Welch A, et al.Fat consumption and HbA(1c) levels: the EPIC-Norfolk study.Diabetes Care. 2001;24: 1911–1916.
28. Emond JA, Patterson RE, Jardack PM, Arab L.Using doubly labeled water to validate associations between sugar-sweetened beverage intake and body mass among white and African-American adults.
Int J Obes (2005). 2014;38:603– 609.
29. Cowie CC, Rust KF, Ford ES, et al.Full accounting of diabetes and pre-diabetes in the US population in 1988 –1994 and 2005–2006.
Diabetes Care. 2009;32:287–294.
30. Briefel RR, Sempos CT, McDowell MA, Chien S, Alaimo K.Dietary methods research in the third National Health and Nutrition Ex-amination Survey: underreporting of energy intake.Am J Clin Nutr.
1997;65:1203s–1209s.
31. Poslusna K, Ruprich J, de Vries JH, Jakubikova M, van’t Veer P.
Misreporting of energy and micronutrient intake estimated by food records and 24 hour recalls, control and adjustment methods in practice.Br J Nutr. 2009;101(suppl 2):S73–S85.
32. Olendzki BC, Ma Y, Hebert JR, et al.Underreporting of energy intake and associated factors in a Latino population at risk of de-veloping type 2 diabetes.J Am Diet Assoc. 2008;108:1003–1008.