THE ASSOCIATION BETWEEN MATERNAL THYROID FUNCTION AND PRESCHOOL ATTENTION DEFICIT HYPERACTIVITY DISORDER AND EXECUTIVE FUNCTION: EFFECT
MEASURE MODIFICATION BY DEIODINASE-ENCODING GENE VARIANTS, MATERNAL SELENIUM AND IODINE INTAKE, AND CHILD SEX
Samantha Sarah Marie Drover
A dissertation submitted to the faculty at the University of North Carolina at Chapel Hill in partial fulfillment of the requirements for the degree of Doctor of Philosophy in the Department
of Epidemiology in the Gillings School of Global Public Health.
Chapel Hill 2019
Approved by:
Stephanie M. Engel Amy H. Herring
Matthew P. Longnecker Joanna Maselko
© 2019
iii
ABSTRACT
Samantha Sarah Marie Drover: The association between maternal thyroid function and preschool attention deficit hyperactivity disorder and executive function: Effect measure modification by deiodinase-encoding gene variants, maternal selenium and iodine intake, and
child sex
(Under the direction of Stephanie M. Engel)
Background. Maternal thyroid hormone supply is crucial for fetal neurodevelopment, particularly during the first 20 weeks of gestation when the fetus cannot synthesize sufficient levels of thyroid hormones. Previous studies of maternal thyroid function and child ADHD or executive function have yielded inconsistent results. A number of factors that may modify the association between maternal thyroid function and fetal neurodevelopment have been
understudied. First, variants in deiodinase-encoding genes may impact the nature of the association between maternal thyroid function and ADHD because they may alter thyroid hormone concentrations in the placenta or in the fetal cerebral cortex. Second, maternal dietary and selenium intake are crucial for both thyroid hormone synthesis and conversion. Third, fetal sex may impact maternal thyroid function and fetal deiodinase activity.
Methods. We estimated the association of maternal thyroid function biomarkers at 17 weeks’ gestation with preschool ADHD and with measures of preschool executive function at 3.5
years. We also assessed effect measure modification by three sets of variables: (1) maternal SNPs in deiodinase-encoding genes DIO1 and DIO2 (rs2235544 and rs225014) and one child SNP in
function outcomes: N=342).
Results. A one-standard deviation increase in maternal free thyroxine index (fT4i) was associated with a 0.10 standard deviation unit increase in parent-rated inhibition (95%CI: 0.01, 0.19), a 0.13 standard deviation unit increase in teacher-rated inhibition (95%CI: 0.01, 0.24), and a 0.13 standard deviation unit increase in parent-rated working memory (95%CI: 0.04, 0.22). We did not detect any main effects of maternal thyroid function on preschool ADHD. Nor did we detect any clear patterns of effect measure modification by maternal or child deiodinase-encoding gene variants, maternal nutrient intake, or child sex.
Conclusions. Maternal thyroxine may be uniquely important for fetal
v
I dedicate this thesis to my partner, Max Beninger, and to our dear friend who brought us together,
ACKNOWLEDGEMENTS
In all sincerity, I could not have completed this dissertation without the support— whether professional, academic, or personal—of so many wonderful individuals. I would like to take this opportunity to acknowledge those individuals and express my gratitude.
First, many thanks to my dissertation committee: Drs. Stephanie Engel, Amy Herring, Matthew Longnecker, Asia Maselko, and Kari North. Thank you very much for your mentorship: your feedback on manuscripts and the time you have spent meeting with me has taught me so much. And, thank you for helping me to stay on track and on my dissertation timeline. I recognize that my timeline was tight at times, but each of you nonetheless made sure I could keep moving forward, and for that I am so grateful.
Thank you so very much, Stephanie, for really everything. During my PhD, I have consistently felt as though I can trust in your support and guidance. I am often taken aback by the amount of time, effort, and care you invest in my academic and professional success. From our regular meetings, to supporting my conference travels and presentations, to helping me to forge connections for the future: thank you. In addition, I feel like working with your
supervision has allowed me to grow as a researcher; with your guidance, I have learned things I did not even know that I did not know!
Thank you, Amy, for guiding me through some of the biostatistical challenges I faced during this project. Your patient guidance as I bumbled through things like power simulations and figuring out which R package to use for weighted regression really felt like a gift to me.
vii
your feedback on the systematic review. Your consistent commitment and care mean a lot, and has definitely enriched this dissertation project.
Thank you, Asia, for helping me to think critically about the underlying cognitive
constructs of executive function, and how all the measures in this dissertation fit together. And, more personally, your kind and enthusiastic attitude towards this project and my work
encouraged me when at times I felt discouraged.
Thank you, Kari, for getting me excited about genetic epidemiology and for taking time to discuss the genetic models used in this dissertation. Your kindness and willingness to help me learn genetic epidemiology—whether in your class or in discussions about this dissertation—is so appreciated.
Second, I would like to gratefully acknowledge a number of mentors and collaborators from the Norwegian Institute of Public Health: Drs. Gro Villanger and Heidi Aase.
Gro, you have been a long-distance mentor to me, and for that I am so grateful. Your scientific expertise combined with your kindness and warmth is something I really admire. Each time there has been a stumbling block with the work in this dissertation, or with related papers, speaking with you always brings things into perspective.
Heidi, thank you for all the time you have spent sharing your knowledge about the ADHD sub-study and your expertise in developmental research. Your commitment to and engagement in this project has most certainly elevated the dissertation papers included herein.
Third, I would like to acknowledge a number of faculty members and researchers at UNC who have really shaped me and contributed my development during this PhD. Drs. Andrew Olshan, Tania Desrosiers, Alison Woomert, Julie Daniels, as well as Kathy Wisniewski and Kim Ludwig: it is truly a great pleasure to learn from each of you (including learning how to be part of a band with Andy!). Thank you for fostering such a wonderful supportive environment that I feel quite lucky to be part of.
Epidemiology department who are my friends, my colleagues, and my role models. Everyone is seriously so supportive, hard-working, and kind. Whether it was sharing your thoughts on a paper or presentation, studying together, or getting together for drinks, you each enrich my academic and personal life. Special thanks to my fellow reproductive epidemiology ladies, Yasmin Barrios and Lauren Graybill, and to my fellow MoBa study researchers, Giehae Choi, Elizabeth Kamai, Amber Hall, and Jake Thistle. I am also especially grateful for Shahar Shmuel, who has been my buddy in all things—studying, writing, baking, walking, piercing, etc.
Fifth, I have no idea what would happen to the department if Valerie Hudock and Jennifer Moore were not a part of it! I honestly am floored by how much you both do, while always exuding such warmth and support for each and every person. Thank you so very much to you both for all your practical support, but also all of your emotional support.
Sixth, thank you to my dear friends and family—near and far—whose company fills me with love. Particular thanks to my friend, Angela Chen, for always being there for me and for reminding me of what is important. And to my fellow ‘cool cats’: our dinners, games, sports
days, and evenings out have made living in Durham a wonderful life. Thank you to my siblings Matthew and Hannah for always making me laugh, and to my sister-in-laws, Mari Hanson and Megan Drover, for filling me and our family with even more happiness. Thank you to my parents-in-law, Rick Beninger, Lynne Hanson, Judith Davidson, and Sunil Chaudry for all your advice, for all the meals you have made me, and for all the love and support you show me. And to my parents, Shirley and Craig Drover: a great deal of where I am today is attributed to you. It is hard to express how grateful I am for your constant support, love, encouragement, and confidence in me. Finally, to my partner, Max Beninger: I simply cannot imagine being where I am today without you.
ix
Funding:
The Norwegian Mother and Child Cohort Study (MoBa) is supported by the Norwegian Ministry of Health and Care Services and the Ministry of Education and Research, NIH/NIEHS (contract no N01-ES-75558), NIH/NINDS (grant no.1 UO1 NS 01 and grant no.2 UO1 NS 047537-06A1), and the Norwegian Research Council/FUGE (grant no. 151918/S10). The Preschool ADHD study, a sub-study to MoBa, is supported by funds and grants from the Norwegian Ministry of Health, The Norwegian Health Directorate, The South Eastern Health Region, G&PJ Sorensen Fund for Scientific Research, and from The Norwegian Resource Centre for ADHD, Tourette’s syndrome and Narcolepsy. The present study was supported in part by the National
Institute of Environmental Health Sciences (NIEHS) (R01-ES021777), the Intramural Research Program of the National Institute of Health (NIH), and The Norwegian Institute of Public Health
Approvals:
The establishment and data collection in MoBa was previously based on a license from the Norwegian Data protection agency and approval from The Regional Committee for Medical Research Ethics, and it is now based on regulations related to the Norwegian Health Registry Act.
TABLE OF CONTENTS
LIST OF TABLES ...xiii
LIST OF FIGURES ... xviii
LIST OF ABBREVIATIONS ... xx
CHAPTER 1. INTRODUCTION AND SPECIFIC AIMS ... 1
1.1 Attention Deficit Hyperactivity Disorder (ADHD) ... 1
1.2 Executive Function ... 4
1.3 Executive Function and ADHD ... 6
1.4 Etiology of ADHD and Causal Pathways Contributing to Executive Function ... 6
1.5 Thyroid function mechanisms ... 7
1.6 Factors Modifying the Biological Impact of Maternal Thyroid Function ... 14
1.7 Aims... 17
CHAPTER 2. CRITICAL LITERATURE REVIEW ... 18
2.1 Evidence for the effect of thyroid hormones on neurodevelopment ... 18
2.2 Evidence for the association between maternal thyroid function and ADHD and executive function ... 19
2.3 Evidence for potential modifying effects ... 29
CHAPTER 3. INNOVATION ... 34
CHAPTER 4. METHODS ... 36
4.1 Overview of Study ... 36
4.2 Study Population ... 37
4.3 Study Timeline ... 41
4.4 Measurement of maternal nutrient intake ... 42
4.5 Validation and reliability information about select variables ... 42
4.6 Potential Adjustment Set and the Directed Acyclic Graph ... 47
xi CHAPTER 5. PAPER 1: MATERNAL THYROID FUNCTION AND PRESCHOOL ADHD IN THE NORWEGIAN MOTHER AND CHILD COHORT STUDY: EFFECT MEASURE MODIFICATION BY
DEIODINASE-ENCODING GENE VARIANTS? ... 56
5.1 Chapter 5 Overview ... 56
5.2 Introduction ... 57
5.3 Methods ... 60
5.4 Results ... 64
5.5 Discussion ... 65
5.6 Tables for Paper 1 ... 69
5.7 Figure for Paper 1... 77
5.8 Supplement for Paper 1 ... 78
CHAPTER 6. ANALYSES SUPPORTING PAPER 1 ... 82
6.1 Allelic Correlation (Linkage Disequilibrium) between SNPs from DIO2 ... 82
6.2. Thyroid Function Biomarker Levels Stratified by Genotype ... 83
6.3. Effect Measure Modification by Maternal Dietary Selenium and Iodine Intake ... 87
6.4 Effect Measure Modification by Child Sex ... 90
6.5 Analyses Restricting the Case Group to Clinical ADHD ... 91
6.6 Select stratified plot ... 93
6.7 Bounds Sensitivity Analysis for Missing Covariate Data ... 94
CHAPTER 7. PAPER 2: MATERNAL THYROID FUNCTION AND CHILD EXECUTIVE FUNCTION: EFFECT MEASURE MODIFICATION BY VARIANTS IN DEIODINASE-ENCODING GENES ... 96
7.1 Chapter 7 Overview ... 96
7.2 Introduction ... 97
7.3 Methods ... 99
7.4 Results ... 103
7.5 Discussion ... 105
7.6 Tables for Paper 2 ... 109
7.8 Supplement for Paper 2 ... 117
CHAPTER 8. ADDITIONAL ANALYSES SUPPORTING PAPER 2 ... 120
8.1 Correlations and factor analyses of outcome variables ... 120
8.2 Teacher versus parent BRIEF-P ratings ... 123
8.3 Effect measure modification summary ... 123
8.4 Bounds Sensitivity Analysis for Missing Outcome Values ... 130
CHAPTER 9. DISCUSSION ... 134
9.1 Overview of Study ... 134
9.2 Discussion and Interpretation of Findings ... 135
9.3 Measurement of Executive Function ... 142
9.4 Clinical Implications ... 144
9.5 Methodological Considerations and Limitations ... 147
9.6 Strengths ... 150
9.7 Summary and Next Steps ... 151
xiii
LIST OF TABLES
Table 1. Risk factors for Attention-Deficit Hyperactivity Disorder ……… 2
Table 2. Thyroid Function Tests ……… 11
Table 3. Prevalence of thyroid disorders during pregnancy ……….. 12
Table 4. Studies of maternal thyroid hormones or dysfunction
and offspring ADHD or related behaviors ………... 23
Table 5. Estimated associations between maternal thyroid
disorders and offspring ADHD or related behaviors ………. 27
Table 6. Estimated associations between maternal thyroid
hormone biomarkers and offspring ADHD or related behaviors ……… 28
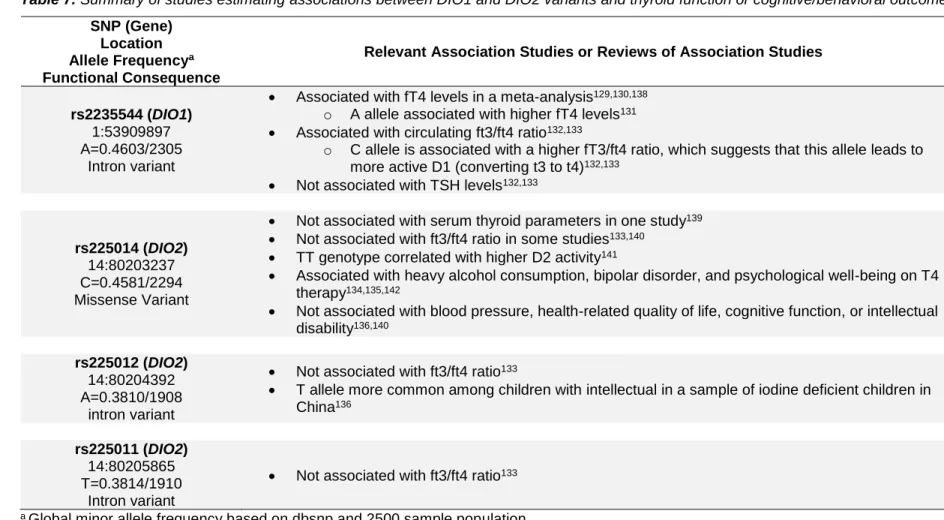
Table 7. Summary of studies estimating associations between DIO1 and DIO2 variants and thyroid function or
cognitive/behavioral outcomes ………..………. 31
Table 8. Summary of paper 1 and paper 2 ………. 37
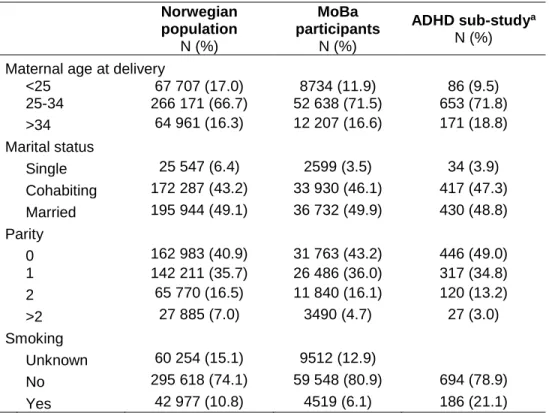
Table 9. Distribution of maternal characteristics in the Norwegian population, in the Norwegian Mother and Child Birth Cohort (MoBa), and among mothers of children clinically evaluated for the ADHD sub-study and those who were randomly selected (N = 914; the random sample
overlapped with the clinically evaluated sample) ……….. 41
Table 10. A partial reproduction of Villanger and colleagues’ (2017) Table 1: “Comparing Serum and Optimal Treated Plasma from 17 Pregnant Women (Only 14 Women Had Thyroxine Peroxidase Antibody Above Detection) Using
Spearman’s Rank Correlation and Wilcoxon Signed-rank test” ……… 44
Table 11. Validity and reliability of executive function measures ……….. 46
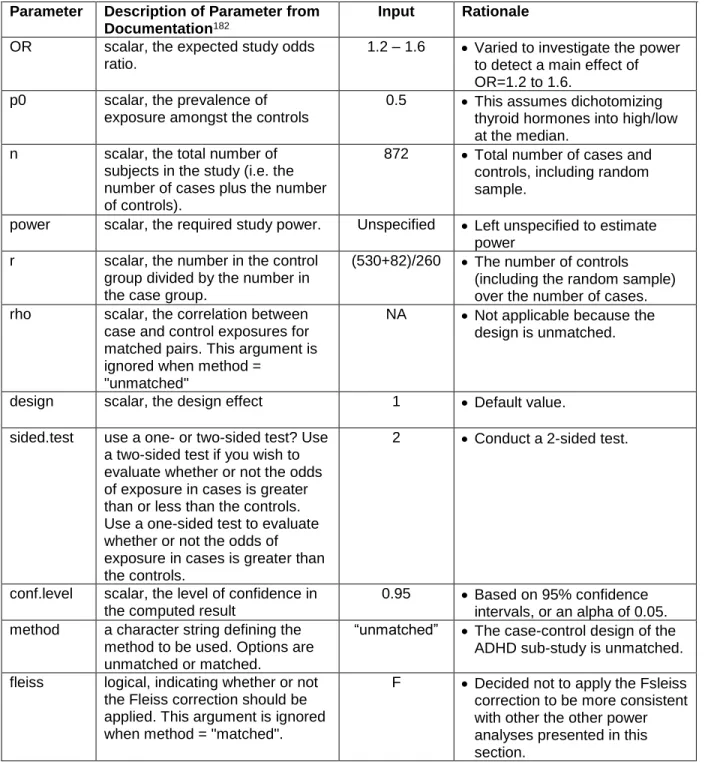
Table 12. Inputs to epi.ccsize function in the epiR R package for estimating the power to detect the effect on
clinical ADHD ……… 51
Table 13. Estimated power to detect the main effect of
thyroid hormones on ADHD ………. 52
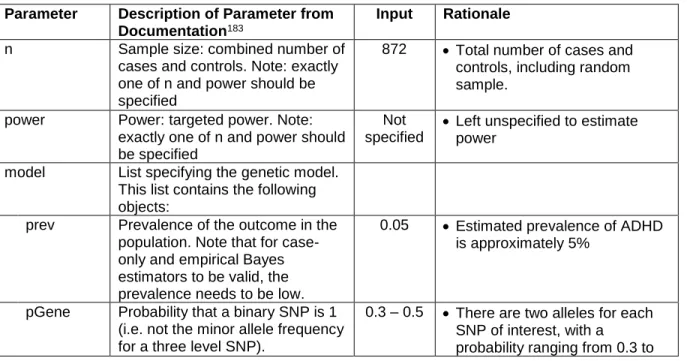
Table 14. Inputs to powerGE function in the
powerGWASinteraction R package for estimating the power to detect the Gene by Environment (thyroid hormone)
Table 15. Estimated power to detect the Gene by
Environment interaction effect using ……….. 54
Table 16. Inputs to pwr.f2.test function in the pwr R package for estimating the power to detect the effect on the
dimensional data ………. 55
Table 17. Estimated power to detect the main effect of thyroid hormones on dimensional data using the epi.ccsize
function in the epiR R package ………. 55
Table 18. Characteristics of women and children who participated in the ADHD case-cohort study nested within
the Norwegian Mother and Child Cohort (MoBa), 2003–2008 ……… 69
Table 19. Distribution of thyroid function biomarkers at 17-18 weeks' gestation among women who participated in the ADHD case-cohort study nested within the Norwegian Mother and Child Cohort (MoBa), 2003–2008, by child’s
ADHD status (ADHD case, control, and overall sample) ……….. 71
Table 20. Odds ratios for offspring ADHD according to category of thyroid function and SNPs in the ADHD case- cohort study nested within the Norwegian Mother and Child
Cohort (MoBa), 2003–2008 ………. 72
Table 21. Maternal and child SNP-stratified estimates of association between maternal thyroid function biomarkers and offspring ADHD in the case-cohort study nested within
the Norwegian Mother and Child Cohort (MoBa), 2003-2008 ………. 74
Table 22. Frequency of genotypes of select maternal and child SNPs among women and their children in the ADHD case-cohort study nested within the Norwegian Mother and Child Cohort (MoBa), 2003-2008, broken down by child
ADHD status (ADHD case and control) ……….. 78
Table 23. Tests of Hardy-Weinberg Equilibrium (HWE) for select maternal and child SNPs among women and their children in the ADHD case-cohort study nested within the Norwegian Mother and Child Cohort (MoBa), 2003-2008,
among controls only ……….. 78
Table 24. Tests of main effects of maternal thyroid function biomarkers on offspring ADHD in the ADHD case- cohort study nested within the Norwegian Mother and Child Cohort (MoBa), 2003–2008, additionally adjusting for
xv
Table 25. Tests of main effects of maternal thyroid function biomarkers and maternal and child SNPs on offspring ADHD in the ADHD case-cohort study nested within the Norwegian Mother and Child Cohort (MoBa), 2003–2008, restricting to
euthyroid women1 and their children ……… 80
Table 26. Allelic correlations (linkage disequilibrium) for maternal SNPs in DIO2 among women whose children were in the ADHD case-cohort study nested within the Norwegian Mother and Child Cohort (MoBa), 2003-2008. Linkage disequilibrium was tested among controls only (women of
children without ADHD) ………. 82
Table 27. Allelic correlations (linkage disequilibrium) for maternal SNPs in DIO2 among control children in the ADHD case-cohort study nested within the Norwegian
Mother and Child Cohort (MoBa), 2003-2008 ……….. 83
Table 28. Mean maternal thyroid function biomarker levels by maternal genotype of select SNPs, with tests to
assess whether means differed by genotype ………. 84
Table 29. Maternal iodine-stratified estimates of
association between maternal thyroid function biomarkers and offspring ADHD in the case-cohort study nested within
the Norwegian Mother and Child Cohort (MoBa), 2003-2008 ………. 88
Table 30. Maternal selenium-stratified estimates of association between maternal thyroid function biomarkers and offspring ADHD in the case-cohort study nested within
the Norwegian Mother and Child Cohort (MoBa), 2003-2008 ………. 89
Table 31. Child sex-stratified estimates of association between maternal thyroid function biomarkers and offspring ADHD in the case-cohort study nested within the Norwegian
Mother and Child Cohort (MoBa), 2003-2008 ……….. 90
Table 32. Tests of main effects of maternal thyroid function biomarkers and maternal and child SNPs on offspring ADHD in the ADHD case-cohort study nested within the Norwegian Mother and Child Cohort (MoBa), 2003–2008, excluding
subclinical cases of ADHD ……….. 92
Table 33. Bounds on odds ratios for offspring ADHD according to category of thyroid function, based on extreme scenarios of non-random missingness of maternal history of depression. Data were from the ADHD case-cohort study nested within the Norwegian Mother and Child Cohort
Table 34. Characteristics of the study sample who were clinically evaluated as part of the nested case-cohort preschool ADHD study within the Norwegian Mother and
Child Cohort (MoBa), 2003–2008 ……… 109
Table 35. Unweighted distribution of thyroid function biomarkers at 17-18 weeks' gestation among women who participated in the nested case-cohort preschool ADHD
study within the Norwegian Mother and Child Cohort (MoBa),
2003–2008 ………. 111
Table 36. Tests of main effects2 of maternal thyroid function biomarkers and maternal and child SNPs on offspring behavioral executive function measures in the preschool ADHD case-cohort study nested within the
Norwegian Mother and Child Cohort (MoBa), 2003–2008 ……… 112
Table 37. Tests of main effects2 of maternal thyroid function biomarkers and maternal and child SNPs on offspring executive function as rated by teachers and parents in the preschool ADHD case-cohort study nested within the Norwegian Mother and Child Cohort (MoBa),
2003–2008 ………. 114
Table 38. Frequency of genotypes of select maternal and child SNPs among women and their children who
participated in the clinical evaluation for the preschool ADHD case-cohort study nested within the Norwegian Mother and Child Cohort (MoBa), 2003-2008, broken down
by child ADHD status (ADHD case and control) ……… 117
Table 39. Tests of Hardy-Weinberg Equilibrium (HWE) for select maternal and child SNPs among women and their children who participated in the clinical evaluation for the preschool ADHD case-cohort study nested within the Norwegian Mother and Child Cohort (MoBa), 2003-2008,
among controls only ……….. 117
Table 40. Tests of Hardy-Weinberg Equilibrium (HWE) for select maternal and child SNPs among a representative
random sample of women and their children who were eligible for the preschool ADHD case-cohort study nested within the Norwegian Mother and Child Cohort (MoBa), 2003-2008
(N = 549 mother-child pairs) ……… 118
Table 41. Paired-samples t-tests comparing parent- and teacher-ratings on executive function on the BRIEF-P
xvii
Table 42. Summary of significant effect measure
modification of the association between maternal thyroid function biomarkers and offspring executive function in the preschool ADHD case-cohort study nested within the
Norwegian Mother and Child Cohort (MoBa), 2003–2008 ……… 125
Table 43. Summary of significant effect measure
modification of the association between maternal thyroid function biomarkers and offspring executive function in the preschool ADHD case-cohort study nested within the Norwegian Mother and Child Cohort (MoBa), 2003–2008,
among cases only ………. 128
Table 44. Summary of significant effect measure
modification of the association between maternal thyroid function biomarkers and offspring executive function in the preschool ADHD case-cohort study nested within the Norwegian Mother and Child Cohort (MoBa), 2003–2008,
among controls only ……….. 129
Table 45.Bounds on odds ratios for offspring ADHD according to category of thyroid function, based on extreme scenarios of non-random missingness of maternal history of depression. Data were from the ADHD case-cohort study nested within the Norwegian Mother and Child Cohort
(MoBa), 2004–2008 ………. 132
Table 46. Bounds on the main effects of maternal thyroid function biomarkers and maternal and child SNPs on teacher-completed BRIEF-P measures based on extreme scenarios of non-random missingness of the outcomes. Data are from the preschool ADHD case-cohort study nested within
LIST OF FIGURES
Figure 1. “Development of skills underlying executive
components. Darker areas reflect periods of increased growth." ……… 5
Figure 2. Overview of thyroid hormone action ……….. 9
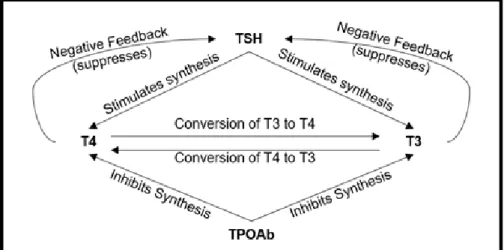
Figure 3. Negative feedback loops regulating the synthesis of thyroid hormones ………. 10
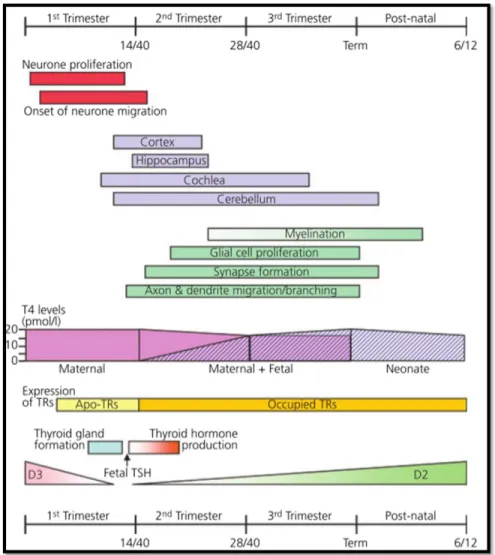
Figure 4. “Relationship between thyroid hormone action and development of the brain ………. 13
Figure 5. Overview of sampling frame ……… 39
Figure 6. Study timeline ………. 41
Figure 7. Directed acyclic graph ………. 49
Figure 8. Summary of selection into the study sample (for paper 1) ………. 77
Figure 9. Maternal SNP rs2235544 (DIO1)-stratified effect estimates of the association between maternal T4 biomarkers (TT4 and fT4i) and the odds of ADHD, using an additive model of genotype ……….. 93
Figure 10. Summary of selection into the study sample (for paper 2) ……….. 116
Figure 11. Unweighted (blue) and weighted (red) distributions of raw executive-function measure scores, assessed as part of the clinical evaluation in the preschool ADHD case-cohort study nested within the Norwegian Mother and Child Cohort (MoBa), 2003-2008 ………. 119
Figure 12. Correlations between executive function outcome variables assessed in 3.5-year-old children who were clinically evaluated as part of the nested case-cohort attention-deficit hyperactivity disorder study within the Norwegian Mother and Child Cohort (MoBa), 2003–2008 (N = 342) ……… 121
xix
Figure 14. Maternal selenium-stratified estimated
associations between maternal TSH the NEPSY statue task
LIST OF ABBREVIATIONS
ADHD Attention deficit hyperactivity disorder
BRIEF-P Behavior Rating Inventory of Executive Function-Preschool
BDNF Brain-Derived Neurotrophic Factor
CDT Cookie delay task
CI Confidence interval
fT3 Free triiodothyronine
fT3i Index of free triiodothyronine
fT4 Free thyroxine
fT4i Index of free thyroxine
hCG Human chorionic gonadotropin
NEPSY A Developmental NEuroPSYchological Assessment
NT-3 Neurotrophic Factor-3
OR Odds ratio
RDoC Research domain criteria
SB5 Stanford-Binet Intelligence Scales, Fifth Edition
T3 Triiodothyronine
T4 Thyroxine
TPOAb Thyroid peroxidase antibodies
TSH Thyroid stimulating hormone
TT3 Total triiodothyronine
1
CHAPTER 1. INTRODUCTION AND SPECIFIC AIMS
1.1 Attention Deficit Hyperactivity Disorder (ADHD)
Attention Deficit Hyperactivity Disorder (ADHD) is the most commonly diagnosed childhood neurodevelopmental disorder, affecting approximately 136 million children and adolescents worldwide (prevalence: 5.6%).1,2 The symptoms of ADHD may present during the preschool period, and may act as early indicators of the disorder. However, few studies have investigated preschool ADHD symptoms. ADHD is characterized by inattention, hyperactivity, and impulsivity,3 and is associated with significant distress and pervasive social and academic impairment.4 Although often perceived as a childhood disorder, ADHD can persist into
adulthood when it is associated with higher risks for incarceration, employment difficulties, and substance use disorders.5–7 At the societal level, ADHD creates a significant financial burden. In 2014, the estimated lifetime ADHD-related total costs per individual was approximately 13,000 to 19,000 US dollars.8 The significant personal and societal impact of this disorder underscores the importance of understanding its risk factors and etiology, with the goal of eventually
developing effective preventative measures.
of ADHD are high (70-90%),10,11 indicating a strong genetic contribution. Nonetheless, substantial variation in the disorder may be attributable to nongenetic (environmental) risk factors and their interplay with genetic risk factors.12 Characterizing causal pathways to ADHD is crucial because some pathways, in theory, may be preventable. The aim of this dissertation was to investigate one hypothesized nongenetic pathway to ADHD: the influence of maternal thyroid hormones during gestation on fetal brain development.
Table 1. Risk factors for Attention-Deficit Hyperactivity Disorder
Established risk
factors
Prenatal • Maternal smoking during pregnancy13–15
• Severe maternal psychosocial stress or depression13,16
Genetic / Social • Male sex13–15
• High genetic heritability17
Less
consistently
supported risk
factors
Prenatal
• Multiple pregnancy complications16
• Maternal thyroid dysfunction18,19
• Prenatal exposure to alcohol20
• Maternal illicit drug use during pregnancy13
Genetic • Variants in genes regulating dopamine and serotonin function21,22
Sociodemographic • Low maternal and paternal education14 • Low income13
Birth outcome • Preterm birth23 • Low birth weight24
Developmental /
Environmental
• Poor quality/quantity of stimulation and support in child’s
home environment13
• Child diet25
Stability of ADHD. Current diagnostic guidelines for ADHD recommend assessing the disorder between 4-18 years of age.2 This recommendation is partly due to the fact that before the age of 4, it is challenging to assess children’s behavior in multiple settings such as at home and at school (a key aspect of the ADHD diagnosis). A possible side-effect of this
3
There are both clinical and etiologic motivations for investigating ADHD in preschool. Clinically, earlier interventions for ADHD have been efficacious,26–28 and may reduce later symptom load and resulting impairments. Although the DSM guidelines are better suited for children who have begun school, rating scales for preschool ADHD have been validated.29 Etiologically, the extent to which preschool ADHD and later childhood ADHD share common causes is unclear.
Investigating the pathways contributing to both preschool and later ADHD might help uncover both shared and unique causes.
The prevalence of ADHD generally declines with age; however, the pattern of decline differs across symptoms. Specifically, hyperactivity and impulsivity show somewhat rapid drops in symptom severity with age, whereas symptoms of inattention persist—or decline more
gradually—with age.30 In a longitudinal study of ADHD diagnosis from preschool into
childhood, Lahey and colleagues found that although the ADHD diagnosis proportion declined, most children who were diagnosed with ADHD in preschool continued to have this diagnosis into childhood.31 However, among those who retained their diagnosis of ADHD, there was much variability in the specific subtype (predominantly inattentive, predominantly
1.2 Executive Function
Executive function refers to a set of cognitive capacities that enable goal-directed and self-regulatory behavior.35 Processes that make up executive function include planning, attentional flexibility, impulse control, and working memory.36,37 Impulse control (i.e.
inhibition) refers to the ability to override a prepotent response with a more appropriate one.35 Working memory is defined as the ability to hold and manipulate information in mind when it is no longer perceptually available.36,37 Impairments in executive function have been associated with an increased risk of addiction, conduct disorder, difficulties maintaining employment, and poor physical health (e.g. overeating and obesity).38–41
Developmental timeline and stability of executive function. The processes of executive function undergo substantial development during the preschool years,36,42 and the development of executive function continues into early adulthood (Figure 1). The developmental trajectories of executive function processes are heterogeneous (Figure 1). Simple working
memory (holding representations in mind in the absence of stimuli) emerges earlier than response inhibition.43 Whereas working memory shows a more linear development—with
gradual ameliorations with age—inhibition demonstrates a sudden increased capacity during the preschool years.43 The neural underpinnings of executive function processes also follow
5
Figure 1. “Development of skills underlying executive components. Darker areas reflect periods of increased growth. SHIFT = shifting; ATT = attention; R = response set; RI = response inhibition; WM = working memory.”
Reprinted from Psychological Bulletin, Volume 134(1), “Executive function
in preschoolers: A review using an integrative framework”, by Garon and
colleagues (2008);43 permission from the American Psychological
Association is not required for the reproduction of a maximum of three figures or tables from a journal article or book chapter.
of executive function include frontal brain activity as measured by EEG50 and white matter abnormalities.56 Maternal thyroid function, which affects fetal neurodevelopment may also predict executive function, though findings have been mixed.57–59 Finally, twin studies suggest that executive function is among the most heritable psychological traits; however, high
heritability does not negate the effect of the environment at the individual level.12
1.3 Executive Function and ADHD
Impaired executive function processes is a key feature of ADHD.60 Indeed, a meta-analysis of 83 studies found that children and adolescents with ADHD had significantly
impaired executive function relative to those without ADHD.61 Furthermore, training meant to improve working memory (a component of executive function) has been associated with reduced ADHD symptoms.62 Just as executive function is comprised of a set of heterogeneous processes with divergent developmental trajectories, so too is ADHD.63 For example, ADHD symptoms of hyperactivity and impulsivity decrease in severity with age, whereas ADHD symptoms of inattention are more persistent with age.30 That being said, evidence suggests that deficits in executive function do not fully account for the etiology of ADHD, and the executive function deficits that can be a part of ADHD vary greatly across children.61 This is all to say that, although ADHD and executive function measures may be related, they are far from redundant.
1.4 Etiology of ADHD and Causal Pathways Contributing to Executive
Function
7
underlying mechanisms, however, is poorly understood.
One proposed mechanism—which is the focus of this dissertation—is that disrupted neurodevelopment during early gestation contributes to ADHD and to impaired executive function. Indeed, those with ADHD are more likely to have neurodevelopmental anomalies, including smaller brain volumes and protracted brain development trajectories,65 suggesting that insults to brain development may at least in part underlie symptoms. Executive function has been associated with frontal brain activity as measured by EEG,50 and impairments of executive function has been associated with white matter abnormalities.56 Although the neural underpinnings of ADHD and of executive function are still unclear, these findings imply that early-emerging neural structures and functions may be important.
Early gestation, in particular the first half of gestation (during which neurons begin to proliferate, migrate, become myelinated, and form synapses), is a sensitive window for
neurodevelopment. Insults during this time can have lasting effects. Thyroid hormones, which I discuss in more detail in section 1.5, regulate the expression of genes that influence neural migration, differentiation, myelination, and synaptogenesis.66,67 An excess or a dearth of thyroid hormones during the prenatal period can thus have important effects on neurodevelopment, discussed further in section 2.1.
1.5 Thyroid function mechanisms
Thyroid hormone synthesis and conversion in euthyroid individuals. The
into the bloodstream. Most (~99%) of the circulating thyroid hormones are ‘bound’—that is, bound to binding proteins like thyroxin-binding globulin.68 The remaining thyroid hormones are referred to as free T3 (fT3) and free T4 (fT4). These thyroid hormones travel throughout the body in the bloodstream, affecting the development and function of many tissues and systems, including the brain. Of T3 and T4, T3 is the biologically more active thyroid hormone. TSH, T4, and T3 constitute a negative feedback loop whereby higher levels of T4 and T3 suppress TSH activity (Figure 3).
Circulating T3 and T4 can be taken up by cells, wherein they are converted to other thyroid hormones by deiodinases (Figures 2, 3). Specifically, T4 is converted within cells to the biologically active T3 by deiodinases types 1 and 2 (D1, D2, referred to as ‘activating
9
Figure 3. Negative feedback loops regulating the synthesis of thyroid hormones.
Thyroid function during pregnancy. Upon implantation, the conceptus releases human chorionic gonadotropin (hCG), which is structurally similar to TSH.69 Human chorionic gonadotropin binds to TSH receptors on the pituitary gland, leading to increased levels of T3 and T4, and decreased levels of TSH, particularly during the first trimester.69 As a result, maternal T4 production increases by approximately 50% relative to the general population.69 Because of changes in thyroid hormone levels during pregnancy, reference ranges for classifying thyroid hormone disorders are not as clear, though several large studies have computed
gestation time-specific reference ranges.70–73 Table 2 describes the reference-ranges among non-pregnant adults as well as trimester-specific reference ranges for a number of thyroid function biomarkers.
11
standard measure of free thyroid hormones, which uses equilibrium dialysis as the first step, can most accurately detect pregnancy-related changes in free thyroid hormone levels.77 However, this gold standard measure of free thyroid hormones is costly.75 An alternative validated method is to compute indices of fT3 and fT4 using TT3, TT4, and T3 uptake.76
Table 2. Thyroid Function Tests
Assay
Reference Range Among Adults78,79 a
Trimester-Specific Reference Range Among Pregnant Women
1st Trimester70,80 2
nd
Trimester70,80 3rd Trimester70,80
Serum TSH
Chemiluminometric Assay (mU/L)
0.4 – 2.5 0.1 - 2.5 mU/L 0.2 – 3.0 0.3 – 3.0
Serum TT4 Immunoassayb
(nmol/L)
64 – 154 72.27 – 171.18 94.77 – 182.51 94.88 – 193.35
Serum TT3 Immunoassayb
(nmol/L)
1.2 – 2.9 1.25 – 2.72 1.43 – 3.16 1.40 – 3.16
Serum fT4 Isotopic Equilbrium Dialysisc
(pmol/L)
13 – 39 10.53 – 18.28 9.53 – 15.68 8.63 – 13.61
Serum fT3 Isotopic Equilbrium Dialysisc
(pmol/L)
3.8 – 10 3.52 – 6.22 3.41 – 5.78 3.33 – 5.59
Serum TPOAb Immune Absorption Assay (mU/L)
<1.0 Unclear if reference range is different among pregnant women; more research is needed.
a Depends on population and laboratory, but approximate values are listed here.
b Radioimmunoassay, chemiluminometric assay, or another immunoassay.
c Gold standard measure of free thyroid hormones, not frequently used due to cost and availability.
Table 3. Prevalence of thyroid disorders during pregnancy
Thyroid Disorder Description Prevalence Among
Pregnant Women
Overt Hypothyroidism Elevated TSH and suppressed fT4 0.5% 80,81
Subclinical Hypothyroidism Elevated TSH with normal fT4 2.0-3.0% 80,81
Hypothyroxinemia Normal TSH and low fT4 1.3% 82
Hyperthyroidism Suppressed TSH and elevated fT4 and/or fT3 0.1-0.4% 80,81
Maternal-fetal thyroid hormone transference. During early prenatal
development, the fetus cannot synthesize its own thyroid hormones.83 Until approximately the 20th week of gestation, the fetus must rely on the mother’s thyroid hormone supply, which can cross to the fetus (Figure 4).84 Of T3 and T4, mostly maternal T4 crosses to the fetus.85 In the fetus, maternally-supplied T4 can be converted to T3 by fetal deiodinase type 2, which is active in the fetal cerebral cortex as early as 7 weeks’ gestation.86 In addition to deiodinase type 2, deiodinase type 3 (the ‘deactivating’ deiodinase) is reliably detected in fetal tissues.86,87
Prenatal neural development and maternal thyroid hormones. In the fetal
cerebral cortex, T3 (converted from maternally-supplied T4) can bind to receptors in the nuclei of cells to affect the expression of genes that regulate neurodevelopmental processes, including neural proliferation, migration, synaptogenesis, myelination, and dendrification (Figure 4).88,89 The first 20 weeks of gestation is an important window for fetal neurodevelopment because most neural migration and proliferation takes place during this period (Figure 4).90 At 5 weeks’ gestation, synapses begin to form, continuing into term.89 Thus, during the first half of
gestation, sufficient levels of maternal thyroid hormones are crucial for healthy fetal
13
Figure 4. “Relationship between thyroid hormone action and development of the brain. In the first trimester of pregnancy early neuronal proliferation and migration is dependent on maternal thyroxine (T4). In foetal tissues, inactivating type 3 deiodinase (D3) enzyme expression falls and development of the thyroid gland commences. By the end of the first trimester, development of the hypothalamic-pituitary axis has occurred and a surge in thyroid-stimulating hormone (TSH) secretion results in the onset of foetal thyroid hormone production, expression of the activating type 2 iodothyronine deiodinase enzyme (D2) and increasing occupation of thyroid hormone receptors (TRs) by 3,5,3¢-L-triiodothyronine (T3). Continuing development of the brain in the second and third trimesters relies increasingly on T4 produced by both the foetus and mother. Continued post-natal development is entirely dependent on neonatal thyroid hormone production. Apo-TR, unliganded unoccupied thyroid hormone receptor.” Reprinted from the Journal of Neuroendocrinology, Volume 20(6), “Neurodevelopmental and Neurophysiological Actions of
Thyroid Hormone”, by Williams and colleagues (2008),89 reprinted under
1.6 Factors Modifying the Biological Impact of Maternal Thyroid Function
Maternal and fetal deiodinases. Deiodinase type 1 (located in cell plasma
membranes) and deiodinase type 2 (located in the endoplasmic reticulum of cells) both mainly convert T4 to the more biologically active thyroid hormone T3. Deiodinase type 1 is expressed in the liver, kidney, gut, lungs, thyroid, pituitary,78,91 and possibly the placenta.88 There is minimal evidence that deiodinase type 1 is expressed in the fetus sufficiently early in gestation to
influence the effect of maternal thyroid function on fetal neurodevelopment. Deiodinase type 2 is expressed in the pituitary, brain, brown adipose tissue, adrenal, liver, thyroid, heart, skeletal muscle,78,91 as well as in maternal uterine decidual cells92 and in the fetal cerebral cortex.86,87
Deiodinases modify the local intracellular levels of thyroid hormones, affecting the concentration of T3 that is available to influence gene expression within cells.83,93,94 In this way, deiodinases modify the association between circulating levels of thyroid hormones and their biological impact: intracellular T3 availability can vary somewhat independently from T3 levels circulating in the bloodstream. That being said, T3 produced by deiodinases can be released back into circulation.93 In fact, the main source of circulating T3 comes from local conversion of T4 to T3 by deiodinases, and not synthesis in the thyroid hormone gland.94
Therefore, deiodinase activity in the maternal liver, for example, would not be expected to modify the association between circulating maternal thyroid function biomarkers and fetal neurodevelopment because deiodinases in the liver would directly affect maternal circulating thyroid function biomarkers. In other words, maternal thyroid function biomarker levels would be an intermediate variable on the path from maternal deiodinase activity and fetal
15 debated.95
Deiodinase type 2 and deiodinase type 3 (the deactivating deiodinase) are expressed in the fetus, with deiodinase type 2 expression occurring in the fetal cerebral cortex as early as 7 weeks’ gestation.86,87 Mostly maternal T4 is transferred to the fetus, where it can be converted to the more biologically active T3 by fetal deiodinase type 2.85 Thus, fetal deiodinase type 2 may modify the association between circulating maternal thyroid function biomarkers and fetal neurodevelopment.
Maternal Iodine and Selenium Intake. Nutritional elements iodine and selenium influence the synthesis of thyroid hormones in the thyroid gland as well as the conversion of thyroid hormones by deiodinases. Iodine can be found in small amounts in natural sources such as seafood, water, and some vegetables, whereas selenium can be found in fish, eggs, meat, mushroom, and cereals.96 The selenium level in crops is partly dependent on soil content, which varies geographically and seasonally.97
Iodine deficiency is the most common preventable cause of neurocognitive deficits worldwide.98 To combat the adverse outcomes associated with iodine deficiency, many countries (including Norway) fortify table salt.99 Yet, even in countries with universal salt iodization, iodine insufficiency persists, and iodine deficiency remains the most common cause of endocrine disorders.100 Women who are pregnant are at a higher risk of iodine deficiency for three main reasons.69 First, there is an increased synthesis of T3 and T4 during pregnancy (particularly during the first trimester), and iodine is required for this synthesis. Second, the renal clearance of iodine is greater in pregnant women compared to those who are not pregnant. Third, some of the maternal iodine supply is transferred to the fetus.69 Because of these reasons, pregnant women require approximately 50% more iodine than those who are not pregnant.69
Iodine deficiency alters thyroid hormone synthesis and conversion. When iodine levels are insufficient, the thyroid gland synthesizes relatively more T3 and less T4, leading to
up-regulated (and deiodinase type 3 is downregulated) in the central nervous sytem.102 This altered regulation would have the effect of converting more T4 to the more biologically active T3.
Selenium is a constituent of deiodinase enzymes, making it essential for the local conversion of thyroid hormones.98 Like iodine, selenium requirements increase during pregnancy, with 60 µg/day intake recommended for women who are pregnant.103 Selenium supplementation is associated with reduced thyroid peroxidase antibodies, allowing for more thyroid hormone synthesis.104–106 Selenium supplementation is also associated with increased deiodinase activity leading to higher levels of T3,107 while selenium deficiency is associated with increased T4 and decreased T3 levels. Whereas iodine deficiency has been recognized as an important preventable threat to fetal and child development, selenium deficiency is relatively understudied.
Fetal/Child Sex. There are a number of mechanisms that might lead to sex-related differences in maternal thyroid function’s effect on neurodevelopment. First, as early as 3 weeks
post-fertilization, maternal serum human chorionic gonadotropin (hCG) levels are higher in pregnant women carrying female than male fetuses.108 Because hCG is structurally similar to TSH and thus also stimulates thyroid hormone synthesis, the sexually dimorphic levels of hCG may differentially alter the balance of maternal TSH, T4, and T3 by fetal sex. Second, animal research has demonstrated that sex hormones can affect deiodinase activity.109 Different deiodinase activity in male versus female fetuses could lead to different local T3 availability to male versus female fetuses, modifying the association between maternal thyroid function and fetal neurodevelopment.
17
cultural norms and expectations regarding the behavior of male and female children. However, part of this difference may also reflect biological mechanisms such as the interaction of hCG, sex hormones, and thyroid hormones during gestation.
1.7 Aims
Specific Aims. To contribute to the growing body of research probing the etiologic role of maternal thyroid hormones in the development of ADHD, this dissertation had two
overarching aims:
Aim 1. Estimate the association between maternal thyroid function biomarkers at 17 weeks’ gestation and clinically diagnosed ADHD at 3.5 years.
Aim 2. Estimate the association between maternal thyroid function biomarkers at 17 weeks’ gestation and measures of executive function at 3.5 years.
To further characterize the nature of the associations described in Aims 1 and 2, this dissertation had the following effect-measure modification sub-aims:
Sub-aims 1a & 2a. Assess whether maternal dietary intake of iodine and selenium are effect measure modifiers of the associations described in Aims 1 and 2.
Sub-aims 1b & 2b. Assess whether maternal and child genotypes on select SNPs related to thyroid hormone synthesis and conversion are effect measure modifiers of the associations described in Aims 1 and 2.
CHAPTER 2. CRITICAL LITERATURE REVIEW
2.1 Evidence for the effect of thyroid hormones on neurodevelopment
In a recent systematic review, Moog and colleagues (2017) reviewed both human and animal literature to explore the effect of maternal thyroid hormones on neurodevelopment from a functional (cognitive) and morphological perspective.68 Based on animal research–which permits more experimental control as well as direct observation of brain development–Moog and colleagues concluded that thyroid hormone levels have widespread effects on neural proliferation, neural migration, neural differentiation, myelination, and synaptogenesis.68 Although the ability to directly assess brain development and structure in human participants is ethically limited, the authors also concluded that human maternal thyroid function is associated with child neurodevelopment (based on cognitive and psychomotor assessments, as well as clinical diagnoses of disorders like Autism Spectrum Disorder and ADHD).68
Thyroid hormones exert their effect on neurodevelopment via the regulation of relevant genes. For example, T3 regulates the expression of reelin during brain development, which is a glycoprotein that is important for neural migration.110 Similarly, developmental hypothyroidism is associated with decreased expression of two neurotrophic factors that regulate neural
differentiation: Brain-Derived Neurotrophic Factor (BDNF) and Neurotrophic Factor-3 (NT-3).111 Morphologically, hypothyroidism is associated with poorer developed dendrites (less arborization and fewer synapses).68
19
until approximately mid-gestation. Their systematic review suggested that even mild disruptions in maternal thyroid hormones can have significant effects on prenatal brain development.68 These results imply that the first half of gestation is an important window for healthy maternal thyroid function, and that even small (e.g., sub-clinical) variation in thyroid hormones may affect prenatal neurodevelopment.
2.2 Evidence for the association between maternal thyroid function and
ADHD and executive function
Along with collaborators (Gro D. Villanger, Heidi Aase, Thea S. Skogheim, Matthew P. Longnecker, R. Thomas Zoeller, Ted Reichborn-Kjennerud, Gun P. Knudsen, Pål Zeiner, and Stephanie M. Engel), I have written a systematic review of studies investigating the association between maternal or neonatal thyroid function and ADHD or related behaviors (which includes some executive function outcomes).57 We reviewed a number of databases (Embase, Pubmed, Cinahl, PsycInfo, ERIC, Medline, Scopus, and Web of Science) for English language articles published or available online ahead of print as of April 2018. We combined search terms for maternal or child thyroid hormones and related clinical conditions with search terms for ADHD and related outcomes. In the original search, we identified 730 non-duplicated articles to review, 669 of which were excluded after title/abstract review. After full-text review of the remaining 61, 38 additional articles were excluded, leaving 23 eligible studies. After two updates, 5 additional studies were added, for a total of 28 eligible studies. Of the 28 studies reviewed, 16 dealt
specifically with maternal thyroid function and ADHD or related outcomes in their children. Overall, the 16 studies suggest an association between maternal thyroid function and ADHD and related behaviors; however, there are a number of limitations in the extant literature, which are discussed below. The results of the systematic review are summarized in Tables 4-6.
reported estimates of association between maternal hypothyroxinemia and ADHD or related outcomes. However, each of these 6 studies used a different outcome measure, including ADHD prescription, ADHD diagnosis, and different parent- or teacher-completed inventories (Tables 4, 5). Nonetheless, we conducted a meta-analysis of 4 of the 6 studies (two were excluded due to insufficient information), and found that across the 4 studies, maternal hypothyroxinemia was associated with increased odds of ADHD or related symptoms (OR=1.54, 95%CI: 1.02, 20.33). No other maternal thyroid classifications included a sufficient number of similar estimates to analyze.
Like maternal hypothyroxinemia, there was some evidence of an association between maternal hypothyroidism and ADHD and related outcomes: three of five studies reported that the disorder was associated with inattention, distractibility, impaired working memory, or ADHD prescriptions (Table 5). Even fewer studies estimated the effects of other maternal thyroid dysfunctions, including hyperthyroidism, making it not possible to draw conclusions across the studies.
Evidence of an association between maternal thyroid function biomarkers and ADHD or related symptoms was either mixed or minimal. Thyroid stimulating hormone (TSH) was the most commonly studied biomarker, but all five studies reported different effects of TSH (though all effects were relatively small or null). No studies investigated the association between
maternal TT3 or fT3 and ADHD or related outcomes. In summary, given the large number of maternal thyroid exposure by child outcome combinations in the extant literature, it is difficult to draw conclusions about the association between maternal thyroid function and child ADHD or related symptoms.
21
which involves equilibrium dialysis as the first step, better detects pregnancy-related changes in fT4, but is costly.75 The fT4 index, based on T3-uptake and TT4, is a more accurate alternative than immunoassay fT4 (see section 4.5 for more description).76
Third, only half (8 of 16) of the reviewed studies adjusted for maternal smoking. Based on the literature, maternal smoking is both a well-established risk factor for ADHD and is consistently associated with thyroid hormone function,13–15,112 and thus should be at least considered as a potential confounder in analyses. Although recent evidence has demonstrated that smoking is not a direct confounder in this context,77 it is nonetheless on an important confounding path between maternal thyroid function and ADHD.
Fourth, only two studies investigated ADHD-related outcomes in preschool, both of which found that maternal thyroid hormone biomarkers (specifically, TPOAb and TSH) were significantly associated with offspring ADHD outcomes.113,114 Most studies investigated ADHD-related outcomes in childhood, which is consistent with the current recommendation that ADHD be diagnosed between 4 and 18 years.2 The phenotype of early ADHD has been understudied, and as a result, children younger than 4 with ADHD may go undiagnosed. It is important for more research to focus on the preschool ADHD phenotype, both from an etiologic standpoint (it is unclear whether preschool and later ADHD reflect the same underlying
disorder) and from an intervention standpoint (earlier interventions might be more effective than later inventions for reducing symptom severity).
Fifth, despite the importance of iodine intake for thyroid synthesis and function and for brain development, only one study in this systematic review evaluated the role of iodine in thyroid function (and no studies investigated the role of selenium). Vermiglio and colleagues assessed children born to mothers from moderately iodine deficient versus sufficient regions, and found that ADHD was more common in the moderately iodine deficient region.115 However, this study included only 27 participants. Two other studies did assess iodine, but did not
Sixth, only 3 of the 16 studies presented separate estimates for male and female children. However, not only does ADHD present different in boys than in girls, trajectories of brain development and executive function development differ by sex, and fetal sex may also influence maternal thyroid function (see sections 1.6 and 2.3 for more details).
23
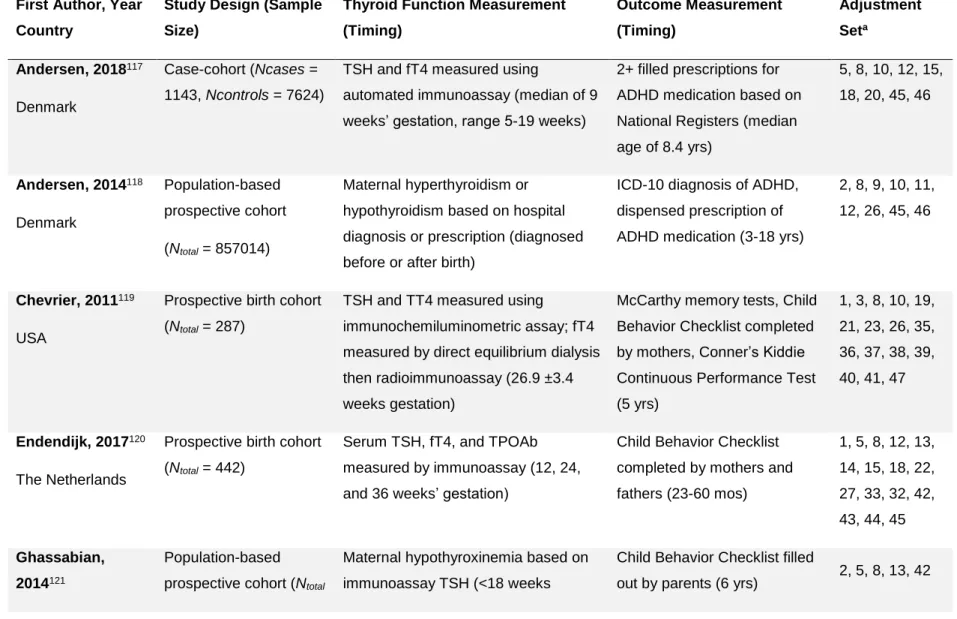
Table 4. Studies of maternal thyroid hormones or dysfunction and offspring ADHD or related behaviors
(pre-publication version of tables in Drover and colleagues57)
First Author, Year
Country
Study Design (Sample
Size)
Thyroid Function Measurement
(Timing)
Outcome Measurement
(Timing)
Adjustment
Seta
Andersen, 2018117
Denmark
Case-cohort (Ncases =
1143, Ncontrols = 7624)
TSH and fT4 measured using
automated immunoassay (median of 9 weeks’ gestation, range 5-19 weeks)
2+ filled prescriptions for
ADHD medication based on
National Registers (median
age of 8.4 yrs)
5, 8, 10, 12, 15,
18, 20, 45, 46
Andersen, 2014118
Denmark
Population-based
prospective cohort
(Ntotal = 857014)
Maternal hyperthyroidism or
hypothyroidism based on hospital
diagnosis or prescription (diagnosed
before or after birth)
ICD-10 diagnosis of ADHD,
dispensed prescription of
ADHD medication (3-18 yrs)
2, 8, 9, 10, 11,
12, 26, 45, 46
Chevrier, 2011119
USA
Prospective birth cohort
(Ntotal = 287)
TSH and TT4 measured using
immunochemiluminometric assay; fT4
measured by direct equilibrium dialysis
then radioimmunoassay (26.9 ±3.4
weeks gestation)
McCarthy memory tests, Child
Behavior Checklist completed by mothers, Conner’s Kiddie
Continuous Performance Test
(5 yrs)
1, 3, 8, 10, 19,
21, 23, 26, 35,
36, 37, 38, 39,
40, 41, 47
Endendijk, 2017120
The Netherlands
Prospective birth cohort
(Ntotal = 442)
Serum TSH, fT4, and TPOAb
measured by immunoassay (12, 24, and 36 weeks’ gestation)
Child Behavior Checklist
completed by mothers and
fathers (23-60 mos)
1, 5, 8, 12, 13,
14, 15, 18, 22,
27, 33, 32, 42,
43, 44, 45
Ghassabian,
2014121
Population-based
prospective cohort (Ntotal
Maternal hypothyroxinemia based on
immunoassay TSH (<18 weeks
Child Behavior Checklist filled
out by parents (6 yrs) 2, 5, 8, 13, 42
The Netherlands = 3903) gestation)
Ghassabian,
2012114
The Netherlands
Population-based
prospective cohort (Ntotal
= 3139)
Maternal TPOAb based on
immunoassay (7.9 - 17.9 weeks
gestation)
Child Behavior Checklist filled
out by parents (3 yrs)
2, 8, 14, 15, 16,
33
Ghassabian,
2011113
The Netherlands
Population-based
prospective cohort (Ntotal
= 3736)
Maternal TSH based on immunoassay
(13.5±1.7 weeks gestation)
Child Behavior Checklist filled
out by parents (1.5, 3 yrs)
1, 2, 5, 8, 13,
14, 15, 16, 17,
18, 19, 33, 42
Haddow, 1999122
USA
Prospective cohort (Ntotal
= 186)
Maternal hypothyroidism based on
TSH and fT4 immunoassay (second
trimester gestation)
Conners’ Continuous
Performance Test, WISC-III
freedom from distractibility (7-9
yrs)
None
Instanes 2016123
Norway
Population-based
case-control (Ncases = 47 944,
Ncontrols = 2 274 713)
Maternal hyperthyroidism or
hypothyroidism based on medical
registry diagnoses (Before or during
pregnancy)
ADHD medication prescription
(3+ yrs)
1, 5, 8, 11, 12,
13, 46
Komendova,
2018124
Czech Republic
Cohort selected based
on maternal thyroid
hormone status (Ntotal =
192)
Maternal thyroid dysfunction based on
serum TSH and TPOAb immunoassay
(first trimester)
WISC-III freedom from
distractibility (6-9 yrs).
None
25 Modesto, 201519
The Netherlands
Population-based
prospective cohort (Ntotal
= 3873)
Maternal hypothyroxinemia or
subclinical hypothyroidism based on
TSH and fT4 immunoassay (13.6 1.9
weeks gestation)
Conners’ Parent Rating Scale– Revised Short Form (8 yrs)
2, 5, 8, 11, 12,
14, 15, 16, 18,
20, 26, 42, 45
Oostenbroek,
2017125
The Netherlands
Population-based
prospective cohort (Ntotal
= 2000)
Maternal hypothyroxinemia based on
TSH and fT4 immunoassay (Median:
12.9 weeks gestation)
Strengths and Difficulties
Questionnaire (5.1 0.2 years)
5, 14, 15, 18,
20, 32, 33, 34,
45
Päkkilä, 2015126
Finland
Population-based
prospective cohort (Ntotal
= 4357 to 4370
depending on analysis)
Maternal thyroid dysfunction based on
TSH, fT4, and TPOAb immunoassay
(10.7 2.8 weeks gestation)
The Strengths and
Weaknesses of ADHD
Symptoms and Normal
Behavior filled out by parents
(16 yrs)
1, 2, 3, 4, 8, 15,
21, 45
Päkkilä, 2014127
Finland
Population-based
prospective cohort (Ntotal
= 5131)
Maternal hypothyroxinemia based on
TSH and fT4 immunoassay, and TSH
levels using immunoassay
(10.7 2.8 weeks gestation)
Rutter B2 Scale –Finnish
version filled out by parents (8
yrs)
2, 4, 5, 8, 15,
21, 45
Samadi, 2015128
Canada
Cohort selected based
on maternal thyroid
hormone status (Ntotal =
44)
Maternal hypothyroidism based on
medical records of diagnoses (during
pregnancy)
Behavioral Rating Inventory of
Executive Function filled out
by parents (9-14 yrs)
None
Vermiglio, 2004115
Italy
Cohort selected based
on geographic region
(Ntotal = 27)
Maternal hypothyroxinemia based on
TSH and fT4 immunoassay (5-10,
11-14, 18-20 weeks gestation)
Clinical observation and
diagnosis for ADHD,
questionnaires based on DSM-4
IV-TR items (8-10 yrs)
Key for adjustment set: 1 = gestational age at birth; 2 = child sex; 3 = SES indices; 4 = child intellectual disability; 5 = parental education; 6 =
school term; 7 = evaluator psychologist; 8 = maternal age; 9 = maternal origin; 10 = maternal residence; 11 = maternal marital status; 12 =
maternal parity; 13 = birth weight; 14 = ethnicity; 15 = maternal smoking; 16 = time of thyroid sampling during pregnancy; 17 = mode of birth
delivery; 18 = maternal psychopathology; 19 = child apgar score; 20 = maternal weight/BMI; 21 = number of children in family; 22 = maternal
breastfeeding; 23 = comorbid diagnoses; 24 = concomitant medication treatments; 25 = maternal bipolar subtype; 26 = income; 27 = alcohol use;
28 = protein intake; 29 = prenatal corticosteroids; 30 = bilirubin; 31 = sepsis; 32 = congenital anomalies; 33 = maternal use of thyroid medications;
34 = maternal hypertension; 35 = country of birth; 36 = diet quality index; 37 = home density and/or family structure; 38 = season of assessment;
39 = delivery complications; 40 = maternal vocabulary; 41 = child hospitalization; 42 = child age at testing; 43 = maternal diabetes I; 44 = assisted
reproductive technology (e.g. hormone stimulation); 45 = multiple births; 46 = year of birth/birthday; 47 = maternal language.
Abbreviations: ADHD = Attention Deficit Hyperactivity Disorder, DSM = Diagnostic and Statistical Manual of Mental Disorders, fT4 = Free
thyroxine, ICD = International Classification of Diseases, mos = months, TPOAb = Thyroid peroxidase antibodies, TSH = Thyroid stimulating
hormone, WISC = Wechsler Intelligence Scale for Children, yrs = years.
a The adjustment set includes variables that were statistically controlled for in analyses included in this review, or were assessed as potential
covariates for analyses included in this review, as well as exclusion or restriction factors that were relevant for this review.
27
Table 5. Estimated associations between maternal thyroid disorders and offspring ADHD or related behaviors
(pre-publication version of tables in Drover and colleagues57)
Exposure Outcome (Time) Estimate
Hypothyroxinemia
Andersen 2018117 ADHD prescription (8.4 yrs median) HRoverall = 1.46 (1.04, 2.06)
HRboys = 1.16 (0.76, 1.77)
HRgirls = 2.28 (1.21, 4.29)
Oostenbroek, 2017125Teacher SDQ hyperactivity/inattention (5 yrs) ORft4<10th %tile = 1.47 (0.99, 2.20)
ORft4<5th %tile = 1.70 (1.01, 2.86)
Parent SDQ hyperactivity/inattention (5 yrs) ORft4<10th %tile = 0.85 (0.50, 1.46)
ORft4<5th %tile = 0.78 (0.36, 1.66)
Modesto 201519 CPRS ADHD symptoms (8 yrs) β = 0.07 (0.003, 0.14)
Vermiglio 2004115 DSM-IV ADHD diagnosis (8-10 yrs) χ2 = 2.34, p = .001
Ghassabian 2014121 CBCL ADHD symptoms (6 yrs) β = 0.12 (-0.04, 0.27), p = 0.14
Päkkilä 2014127
RB2 inattention & hyperactivity (8 yrs) ORboys = 0.61 (0.18, 2.03)
RB2 inattention & hyperactivity (8 yrs) No exposed girls with combined symptoms estimate Hypothyroidism
Andersen 2018117 ADHD prescription (8.4 yrs median) HR = 1.05 (0.77, 1.43)
Instanes 2016123 ADHD prescription (3+ yrs) OR = 1.2 (1, 1.4)
Samadi 2015128 BRIEF impaired working memory (9-14 yrs) MD = 6.84, p = 0.067a
Haddow 1999122 CPT distractibility (7-9 yrs) MD = -3, p = 0.08
CPT impaired sustained attention (7-9 yrs) OR = 3 (1, 5) Overt Hypothyroidism
Andersen 2018117 ADHD prescription (8.4 yrs median) HR = 0.98 (0.44, 2.20)
Subclinical Hypothyroidism
Andersen 2018117 ADHD prescription (8.4 yrs median) HR = 1.06 (0.76, 1.48)
Modesto 201519
CPRS ADHD symptoms (8 yrs) β = -0.01 (-0.07, 0.05) Thyroid dysfunction
Komendova, 2018124WISC-III freedom from distractibility (6-9 yrs) MD = 0.38 (-4.76, 5.52)
Päkkilä 2015126
SWAN ADHD symptoms (16 yrs) NS Hyperthyroidism
Andersen 2018117 ADHD prescription (8.4 yrs median) HR = 1.11 (0.79, 1.57)
Instanes 2016123
ADHD prescription (3+ years) OR = 1.2 (0.9, 1.5) Andersen 2014118 ICD-10 ADHD prescription/diagnosis (3-18 yrs) NS based on figure 3
Overt Hyperthyroidism
Andersen 2018117 ADHD prescription (8.4 yrs median) HR = 0.93 (0.53, 1.62)
Subclinical Hyperthyroidism
Andersen 2018117 ADHD prescription (8.4 yrs median) HR = 1.24 (0.81, 1.90)