PROLONGED SITTING WITH OR WITHOUT HIGH GLYCEMIC INDEX MEAL AND THE ACUTE EFFECTS ON CEREBROVASCULAR FUNCTION IN HEALTHY ADULTS
Kathryn Burnet
A thesis submitted to the faculty at the University of North Carolina at Chapel Hill in partial fulfillment of the requirements for the degree of Masters of Arts in the Department of Exercise
and Sports Science (Exercise Physiology).
Chapel Hill 2019
Approved by: Lee Stoner
Erik Hanson
ABSTRACT
Kathryn Burnet: Prolonged Sitting With or Without High Glycemic Index Meal and the Acute Effects on Cerebrovascular Function in Healthy Adults
(Under the direction of Lee Stoner)
The study purpose was to determine if prolonged (3-hr) sitting (a) resulted in a
decreased total brain blood flow (QBF) and executive function, and (b) whether this decrease is exacerbated by a high glycemic index meal (HGI). Subjects (n=18) participated in a HGI and low glycemic index (LGI) condition. Doppler Ultrasound was used to measure QBF using the equation: [(ICA blood flow + VA blood flow) x 2 (ml min-1)]. Executive function was assessed using the Stroop Task and Trail Making using the Trail Making Test – Part B. QBF decreased during sitting, as shown through the LGI condition, but increased in HGI, with a condition effect (P=0.04). No differences were observed in the Stroop and Trail Making tests. Future studies are needed that measure total brain blood flow, cerebral blood flow velocity, perfusion and
ACKNOWLEDGEMENTS
TABLE OF CONTENTS
LIST OF TABLES ... viii
LIST OF FIGURES ... ix
LIST OF ABBREVIATIONS ... x
CHAPTER I: INTRODUCTION ... 1
CHAPTER II - REVIEW OF LITERATURE ... 3
INTRODUCTION TO TOPIC ... 3
CONSIDERATION 1: ACUTE RESPONSES TO PROLONGED SITTING ... 4
CONSIDERATION 2: EFFECTS OF ACUTE BOUTS OF PHYSICAL ACTIVITY ON COGNITIVE FUNCTION ... 6
CONSIDERATION 3: INTERACTIONS BETWEEN ACUTE SEDENTARY BEHAVIOR AND LIFESTYLE CHOICES ... 7
CONSIDERATION 4: ACUTE EFFECTS OF PROLONGED SITTING AND A HIGH GLYCEMIC INDEX MEAL ...12
IMPLICATIONS/WHY IS THIS STUDY NEEDED? ...12
METHODOLOGICAL CONSIDERATIONS ...12
OTHER CONSIDERATIONS ...17
SUMMARY ...18
CHAPTER III: METHODOLOGY ... 19
PARTICIPANTS ...19
PRE-ASSESSMENT ...20
FAMILIARIZATION ...20
EXPERIMENTAL VISITS...21
EXPERIMENTAL MEASURES ...23
RANDOMIZATION ...26
SAMPLE SIZE ...27
QUALITY CONTROL ...27
DATA MANAGEMENT AND STATISTICAL ANALYSIS ...27
CHAPTER IV: RESULTS ... 29
PARTICIPANTS ...29
CONTROL DATA ...30
BASELINE DATA ...30
CONTINUOUS BLOOD GLUCOSE MONITORING ...31
PRIMARY OUTCOME ...32
SECONDARY OUTCOME ...33
MECHANISTIC OUTCOME 1 ...35
MECHANISTIC OUTCOME 2 ...35
CHAPTER V: DISCUSSION ... 36
LIMITATIONS AND STRENGTHS ...36
COMPARISON TO LITERATURE ...37
CONCLUSIONS ...40
APPENDIX A: MEDICAL HISTORY FORM ... 41
APPENDIX B: CONSENT FORM ... 43
APPENDIX C: COGNITIVE INSTRUCTIONS ... 47
APPENDIX D: REMINDERS SHEET ... 48
APPENDIX E: SLEEP DIARY ... 49
APPENDIX F: BRAIN FOG SCALE ... 50
APPENDIX G: EXTRA DATA ... 53
LIST OF TABLES
Table 1. Subject Characteristics ...29
Table 2. Total brain blood flow baseline data ...31
Table 3. Prefrontal cortex cerebral perfusion baseline data ...31
Table 4. Stroop, Trail, and Fog baseline data ...31
Table 5. Supine: Brain Blood Flow ...33
Table 6. Supine: Stroop, Trail, Memory ...34
Table 7. Supine: Oscillatory Blood Flow and Arterial Stiffness ...35
LIST OF FIGURES
Figure 1. Acute Effect of Prolonged Sitting and a High Glycemic Index
Meal on Cognitive Function ...11
Figure 2. Experimental Day Timeline for Cerebrovascular/Cognitive Measurements ...23
Figure 3. CONSORT diagram ... 30
Figure 4. Average Glucose Across 3 hours of sitting ... 32
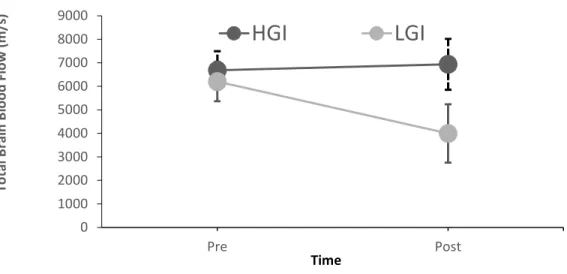
Figure 5. Total Brain Blood Flow; Pre to Post ... 34
LIST OF ABBREVIATIONS
AUC Area Under the Curve
BF Blood Flow
CBF Cerebral Blood Flow
CCA Common Carotid Artery
CGM Continuous Glucose Monitor(ing)
CONSORT Consolidated Standards of Reporting Trials
CVD Cardiovascular Disease
DeoxyHb Deoxygenated hemoglobin
FMD Flow Mediated Dilation
GI Glycemic Index
Hb Hemoglobin
HGI High Glycemic Index
ICA Internal Carotid Artery
LGI Low Glycemic Index
MVPA Moderate to Vigorous Physical Activity NIRS Near-infrared spectroscopy
PWV Pulse Wave Velocity
QBF Total Brain Blood Flow
RPE Borg Rate of Perceived Exertion T2DM Type II Diabetes Mellitus
TCD Transcranial Doppler
tHb Total hemoglobin
CHAPTER 1: INTRODUCTION
High amounts of sedentary behavior (SB) is associated with poor cerebrovascular health [1,2], including reductions in brain volume [1] and a decline in cognitive function [3,4]. However, less is known regarding the mechanism(s) linking repeated exposure to acute sedentary
behavior on chronic cerebrovascular complications. A potential pathway, and one which has been suggested to link repeated prolonged sitting exposure to peripheral and central
cardiovascular complications, is brain blood flow (BF). Studies exploring this potential pathway have found that within acute bouts of prolonged sitting BF to the brain, total BF, and middle cerebral artery BF declines [Credeur – unpublished data, [5]]. Interestingly, cerebral perfusion is maintained throughout three hours of sitting [Stoner – unpublished]. However, it is important to consider the conditions at which an individual sits, such as during eating. Poor dietary choices such as foods high in refined sugar and subsequently with a high glycemic index (HGI), are associated with chronic effects such as cognitive dysfunction [6–10]. Acutely, less is known about the effects of HGI foods on cerebrovascular function. Together, HGI foods and prolonged sitting may have detrimental acute effects on cerebrovascular function. Thus, there is a critical need to examine the effects of prolonged sitting and HGI meals on measures of cerebrovascular function.
session of 3 hours of sitting and explored the acute changes from pre to post sitting on BF to the brain in young, healthy adults. This population was selected for this preliminary study to
CHAPTER 2: LITERATURE REVIEW Introduction: Risks of Sedentary Behavior
In today’s American society, adults typically spend 50-70% of their waking hours sitting [11]. This can be attributed to the way westernized societies interact with the world around them. Communication, transportation, and entertainment technologies, as well as work place and educational environments favor sedentary behavior. This increase in sedentary behavior has been shown to have detrimental cardiometabolic effects, and these effects may impact
cerebrovascular and cognitive function. Beginning with the London Bus Study in 1966, Morris’ data demonstrated that active conductors were less prone to having a greater incidence of fatal myocardial infarction as compared to the more sedentary drivers [12]. More recently, this has been verified with objective data, and Borgundvaag et al. found that moderate to vigorous physical activity (MVPA) may be associated with a substantially lower mortality risk [13]. However, as previously stated, adults typically spend majority of waking hours sitting, and recent evidence supports that prolonged sitting time is associated with CVD risk, independent of leisure-time physical activity [14]. Many studies continually support this finding, in fact, there is enough evidence to conduct meta-analyses exploring the association between sedentary time and disease incidence, concluding that prolonged sedentary time is independently associated with deleterious health outcomes regardless of physical activity levels [15]. More specifically, these deleterious health outcomes include impaired physical function [16], CVD [17,18], T2DM [19], reductions in brain volume [1,20], and cognitive decline [3,4,16,21].
prevalent in society, it is important to examine the acute effects of sedentary behavior to further understand how its repeated exposure leads to chronic complications. Examining the effects of prolonged sitting has become a recent area of research interest. The following will outline what is known about the acute vascular, metabolic, and cerebrovascular effects of sedentary
behavior.
Consideration 1: Acute Responses to Prolonged Sitting
Vascular
Repeated exposure to prolonged sitting, defined as an acute bout of sedentary behavior (>30 minutes), may directly compromise whole body CV health. In 2015, Thosar et al. found that 3 hours of sitting was associated with a significant impairment in shear rate and superficial femoral artery flow mediated dilation (FMD) [22]. FMD is widely believed to reflect nitric oxide-mediated endothelium-dependent vascular function [23]. Blunted FMD is suggestive of impaired macrovascular endothelial function, but could also be the result of an attenuated reactive
Further support that sitting-induced leg endothelial dysfunction is mediated by a reduction in shear stress was observed in Hitos et al.; they observed reduced BF reduced by 40% in the legs after just 1.5 hours of sitting [29]. A proposed mechanism for this large decrease in BF is a decrease in muscle “pump” activity [30]. If the muscles in the legs are inactive while in a seated position for a long period of time, blood will pool in the lower
extremities. When blood pools in the lower limbs, there is less venous return, which will impair cardiac output. Subsequently, the vessels will constrict to maintain blood pressure. When the vessels constrict, there is an increased resistance to local BF. The local resistance is increased by clotting factors [29] accumulating in these regions due to slow moving blood. Increased resistance will reduce BF and thus BF decreases in the lower extremities during prolonged sitting.
Metabolic
Prolonged uninterrupted sitting is also adversely related to postprandial hyperglycemia [31], due to a lack of muscular contraction stimulated glucose uptake. Postprandial hyperglycemia refers to an exaggerated elevation in blood glucose following consumption of a meal [32]. This postprandial hyperglycemia increases cardiometabolic risk, and has been shown to contribute to pancreatic beta cell failure and progression to late-stage diabetes [19]. Furthermore,
postprandial glucose elevation is a key predictor of acute microvascular and macrovascular complications [31]. Additionally, recent studies suggest prolonged sedentary time impairs glucose metabolism [33], due to a lack of skeletal muscle contraction-stimulated glucose uptake.
Cerebrovascular
autoregulation to maintain perfusion pressures [34], and microcirculatory recruitment to maintain perfusion [34,35]. As previously mentioned, excessive sitting time, especially with a lack of skeletal muscle activity, can lead to venous pooling and decreased total brain BF and impaired glycemic control [36,37]. Glycemic control is dependent on adequate delivery and uptake, especially by skeletal muscle. This is accomplished by pairing a glucose transporter (GLUT4), which can be stimulated by insulin, or skeletal muscle contractions [38,39]. Within the brain, insulin-sensitive glucose transporters (GLUT1 and GLUT3) are required to transport glucose across the blood brain barrier [40]. However, exposure to hyperglycemia, which may occur post-prandially and/or with prolonged sitting, results in decreased brain glucose transport [41]. The down-regulation of brain glucose transport, which may initially serve to protect the brain, may exaggerate the effects of subsequent hypoglycemia and ultimately damage the brain [42]. Finally, prolonged exposure to hyperglycemia and repeated exposure to hypoglycemia can damage the microvasculature, impair brain structure and function, and impair cognitive function [43,44].
Summary
Prolonged sitting has been linked to vascular, metabolic, cerebrovascular, and cognitive dysfunction. While the literature on the effects of prolonged sitting on acute cerebrovascular functioning are nascent, a large body of evidence exists for the association between physical activity and improved cerebral perfusion and cognitive function [45]. It is important to explore this literature in order to better understand the effects on prolonged sitting. This evidence will be demonstrated in the next section.
Consideration 2: Effects of Acute Bouts of Physical Activity on Cognitive Function
function, executive function, is an umbrella term for the neurologically-based skills involving processes that all have to do with managing oneself and one’s resources in order to achieve a goal [51]. The prefrontal cortex region in the brain correlates to executive functioning, as shown by perfusion changes via MRI scanning during a test of executive function [52].
Although this has yet to be fully explored, breaking up prolonged sitting may lead to cognitive improvements due to improved cerebral blood flow. This is speculated due to the following evidence. The effects of breaking up sitting with standing and/or walking on
postprandial hyperglycemia have been observed [32,53–55]. Bailey et al. found that interrupting prolonged sitting with brief light-intensity walking, but not standing, has a beneficial effect on postprandial response [53]. Benatti et al. found breaking up sitting with standing across a 9-hour period acutely reduced the postprandial glycemic response [36].
Collectively, in light of the evidence discussed above, it can be speculated that reduced cerebral blood flow and impaired glucose metabolism may be associated with acute cognitive dysfunction. However, it is important to remember that humans are typically engaged in many behavioral choices while sitting. There may be a concomitant effect of behavioral choices on the effects of prolonged sitting. The impact of acute behavioral choices (i.e. dietary intake, such as consumption of high GI meals) within each lifestyle paradigm could augment or attenuate the previously observed outcomes of sedentary behavior. These effects will be explored in the following section.
simple carbohydrates, are affecting our bodies, specifically cardiovascular and cerebrovascular outcomes.
Glycemic index (GI) and glycemic response
It is not uncommon to consume a meal high in refined sugar, or high glycemic index, while sitting at a desk. The health effects of dietary carbohydrate are of great interest to health professionals, the general public, and policy makers [56]. Carbohydrate rich foods differ in their effect of increasing blood glucose. This property of carbohydrate-rich foods is called “glycemic index” (GI), a relative ranking of carbohydrate in foods according to how they affect blood glucose levels [57]. The postprandial period is the time after consumption of a meal. Postprandial hyperglycemia refers to an exaggerated elevation in blood glucose following consumption of a meal [32]. However, the response differs between a low GI meal and a high GI meal. Consumption of a low GI meal leads to a more constant postprandial blood glucose concentration, while a high GI meal leads to a rapid increase in plasma glucose concentration followed by a concomitant high insulin secretion by the pancreas [6]. This high insulin response results in a rapid blood glucose disposal, which may cause the blood glucose concentration to decrease below the fasting concentration in the later postprandial period [58]. This unstable blood glucose profile is associated with CVD, T2DM, and impaired cognitive functioning. These associations will be discussed in the following sections.
Glycemic Index and Vascular Function
As mentioned previously, a high GI meal contributes to an unstable postprandial, or after meal, blood glucose concentration. Specifically, a high GI meal results in postprandial
understood, the key event associated with this dysfunction is oxidative stress-mediated disruptions in nitric oxide homeostasis (44). In addition to CVD, dietary GI alters risk for T2DM [6]. This risk and the mechanisms leading to it will be discussed in the next section.
Glycemic Index and Metabolic Function
As outlined in section 2.2, the literature supports strong and consistent evidence linking prolonged sitting to hyperglycemia (17). Insulin resistance and impaired beta cell function may occur with a high GI meal through the direct effects of hyperglycemia (45). Hyperglycemia is known to cause beta cell dysfunction, or glucotoxicity [61]. GI has been demonstrated to lead to chronic events such as CVD and T2DM and acute effects such as oxidative stress, insulin resistance, and impaired beta cell function. Next, the effect of GI on cognitive function will be discussed.
Glycemic Index and Cognitive Function
The brain is entirely dependent on glucose as its main source of energy [58]. It is
undoubtedly true that a failure of blood glucose supply to the brain produces a significant loss of brain function [62]. A high GI meal would result is an acute rise in blood glucose levels, followed by a decrease in blood glucose levels following the insulin response. This unstable blood
Additionally, as mentioned in the previous section, insulin resistance may occur with consumption of a high GI meal. Insulin resistance is a state of decreased responsiveness of target tissues to normal circulating levels of insulin [66]. The brain contains insulin receptors with important roles in cognitive function that are affected by insulin resistance [66]. In fact, insulin resistance is closely related to occurrence and development of cognitive dysfunction [67]. Additionally, impaired insulin signaling is relevant to the pathophysiologic mechanisms of
cognitive impairment (61).
Through GI’ effect on both blood glucose levels and insulin sensitivity and blood flow, it is suggested a high GI may have acute effects on cognition. However, a question that remains is what may be the combined effect of prolonged sitting and a high GI meal on cerebrovascular and cognitive function. The next section will outline what may occur, and the potential
mechanisms related to the outcome.
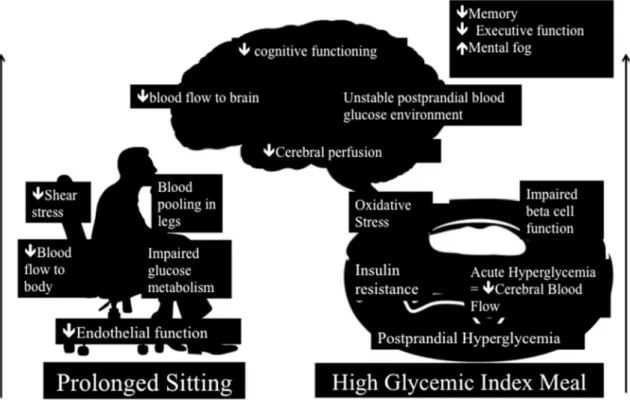
Figure 1. Acute Effect of Prolonged Sitting and a High Glycemic Index Meal on Cognitive Function
The figure represents the effects from both stimuli, and the combined effect in the brain. We know that prolonged sitting is associated with impaired vasculature. More specifically, the mechanism behind this impaired vascular function is decreased endothelial function. This decrease in endothelial function is explained by decreased shear stress. A lack of muscle pump activity leads to blood pooling in the legs and impaired glucose metabolism. This in turn
Implications/Why is this study needed?
Very few studies exist exploring the effects of acute periods of prolonged sitting on cerebrovascular function, yet, chronic sedentary behavior has been associated with long term cerebrovascular impairments [42]. Several experimental studies have demonstrated that prolonged sitting results in unfavorable vascular effects such as increases in diastolic blood pressure [68,69], impairments in vascular function [24], and impairments in endothelial function [22]. It is not currently known if these detrimental vascular effects of prolonged sitting also occur in the cerebrovasculature. Related to this, the brain relies on blood flow to deliver oxygen and glucose, so decreases in total brain blood flow could affect it’s functioning. Thus, it is imperative to explore the effects of prolonged sitting on total brain blood flow. Additionally, it is important to consider how lifestyle behaviors, in this case – consumption of a high GI meal, may affect total brain blood flow.
Methodological Considerations
In order to test these combined stimuli on cerebrovascular and cognitive functioning, several methodological considerations were examined. Two major considerations were external and internal validity. External validity represents the generalizability of the study, and
appropriate subjects and study design will be discussed considering this. Internal validity refers to whether the effects observed in the study were due to manipulation of the independent variable, and instrumentation will be discussed considering this. These considerations, among others, will be outlined in the following sections.
Study Design Considerations
which include cohort studies and case-control study designs, have several advantages such as an ability to look at multiple risk factors and multiple outcomes, greater timeliness, and a broader range of patients, however, we would not be able to manipulate anything [71]. Next study design considered was a randomized controlled trial, the gold standard for clinical research. However, this would require participants to be divided into two groups and may require more participants, and thus would not be feasible for a Master’s Thesis project. The study design selected was a double-blind randomized cross over design with two experimental group conditions (low glycemic index [LGI] and high glycemic index meal [HGI]) preceded by a familiarization session. The study design was double blinded since the subjects did not know which condition they were receiving and the researchers were blinded as an undergraduate lab assistant randomly assigned the conditions.
Following selection of the study design, it was important to define the bout of prolonged sitting. Three hours of prolonged sitting has been shown to cause a reduction in shear rate, popliteal FMD, reduced hyperemic blood flow, and increased calf circumference [25]. A three-hour bout of sitting was also previously used in unpublished studies from our laboratory with designs similar to our protocol.
Measurement Considerations
Blood Flow to the Brain
calculated as the sum of the blood flow in the ICA and VA [(ICA blood flow + VA blood flow) × 2 (ml min−1)] to be able to compare to previous literature [(Credeur – unpublished data),
[72]]. Additionally, the use of ICA+VA*2 accounted for blood flow solely the brain, and not scalp and face. The ICA and VA both directly perfuse the Circle of Willis.
Cognitive Tests
In determining the best cognitive test to utilize, it is important to examine past literature and the measures of cognitive function used. In a systematic review by Falck et al [73], thirteen different measures of cognitive function were used to assess the association between sedentary behavior and cognitive function. The following domains were examined: memory, executive function, processing speed, and perceptual organizing and planning. This thesis will focus on executive function, since the NIRS probe will be placed over the prefrontal cortex. Previous unpublished research in our lab used the Stroop Test to assess executive function. However, Falck et al. [74] recommended use of the Trail Making Test - Part B for executive function to allow for comparisons across future studies. Additionally, this thesis aimed to use quick tests to avoid interference with vascular measurements (i.e. avoid increasing blood pressure). An additional consideration is the timing of the administration of cognitive tests. In order to not affect vascular measurements throughout the protocol, tests were given pre and post the 3-hour sitting protocol. The Stroop Test and Trail Making Test, Part B, are both simply and quick to administer, thus, this study used both the Stroop Test and the Trail Making Test, Part B, to assess executive function.
time of 10 minutes [75]. Therefore, we created a modified version - incorporated word lists from the HVLT and administered a 12 word recall pre- and post- test.
Brain Fog
We were interested in measuring brain fog as subjective feelings of brain fog have been experienced with sitting. There is no known reliable and valid objective measure of brain fog, so we subjectively measured brain fog using a modified Borg Rate of Perceived Exertion (RPE) scale.
Cerebral Perfusion
Cerebral perfusion could have been measured using MRI but this would have been difficult and costly. Therefore, cerebral perfusion was measured using a continuous-wave near-infrared spectroscopy (NIRS) device (Portalite, Artinis, Netherlands). The NIRS probe measured perfusion and relative changes in total hemoglobin [76]. To do this, the probe emits an infrared light, which passes through skin, adipose tissue, muscle, and bone. A receiver registers the absorbance of light waves passed through the adjacent tissues continuously in real-time. The probe is programmed to determine the light wavelength absorbance spectra for oxygenated hemoglobin (Hb), deoxygenated hemoglobin (deoxyHb), and total hemoglobin (tHb). For the experimental protocol, the NIRS probe was positioned on the forehead, approximately 3 cm to the right of center, directly over the eyebrow. The rationale for this placement was based off the international Electroencephalography 10-20 system for brain mapping and placement of
electrodes for measuring the pre-frontal cortex [76]. Importantly, perfusion changes within this region have been shown to correlate to executive functioning, as denoted by perfusion changes via MRI scanning during tests of executive function [52].
Glucose Monitoring
glucose monitors were used since they are reasonably unobtrusive, small, comfortable, and provide information unattainable by intermittent capillary blood glucose including “24/7” coverage and the ability to characterize glycemic variability [77].
Meal Intervention
In order to induce the greatest response, we selected a solution-based meal. We provided a glucose solution for the HGI meal and a fructose solution for the LGI meal. The literature was searched extensively to determine the most appropriate high and low meal choices. Most studies matched for macronutrient content and the average low GI used was 36, and the average high GI used was 80. With use of a meal solution, the experiment was double-blinded as both solutions looked the same. The meals were matched g/kg of the participant’s weight. A standardized dinner was given the night before testing.
Population/Sampling
Young healthy adults (18-35 years) were recruited for the study to ensure complete brain development and avoid the potential for age-related cognitive decline. Using young subjects avoided potential confounding variables, since younger people are typically healthier. Then, it was easier to draw direct conclusions on the effects of prolonged sitting. Additionally, the
subjects were active (>90 minutes a week of moderate exercise), to induce a greater effect from prolonged sitting since the subjects were adapted to physical activity. This was considered due to a previous study from our laboratory (unpublished), and lack of major findings from sedentary subjects. Although a more generalizable sample was preferred, we recruited a homogenous group at this early stage to reduce confounding by participant characteristics.
Statistical Considerations
missing one time point, they would be dropped from the entire analysis through listwise deletion. Therefore, we used a Mixed Linear Model. A Mixed Linear Model handles repeated measures and missing data (by dropping that one missing time point). Additionally, we recognized that by doing a mixed linear model we are allowing subjects to vary depending on the baselines of the outcomes of interest. The independent variables for the study are time (10, 90, 170) and condition (HGI, LGI).
Other Considerations
Sex as a Biological Factor
We cannot rule out that sex differences exist in cerebrovascular function. However, this study is not adequately powered to determine whether there are sex differences in
cerebrovascular impairment and risk interactions. However, it is known that men and women have different trajectories for acquisition of CVD risk factors over the course of a lifetime.
Ethnicity/Race
While this study attempted to recruit a racially diverse sample, this study was not adequately powered to determine whether there are race/ethnic differences in cerebrovascular impairment and risk interactions.
Generalizability
Our results may only be generalizable to young, healthy, and active individuals.
Therefore, the generalizability of our results is low due to our selection of a homogenous study population in order to reduce the potential for confounding.
Pre-assessment control
day, at least 12 hours before the start of testing, and texts were sent to ensure participants ate the meal at the same time before each experimental day. Finally, we required an overnight fast. Continuous glucose monitors were inserted at least 12 hours prior to the experimental day to ensure stable glucose levels in our participants. These pre-assessment controls helped to minimize confounding variables. Additionally, we reported on pre-assessment physical activity levels, sleep, glucose levels, and mode of transport to ensure a relatively homogenous sample. In our results, if we were to experience any outliers, we would be able to see if any of these variables may have affected the participant’s results.
Summary
CHAPTER 3: METHODOLOGY
This study is reported in accordance with CONSORT (Consolidated Standards of Reporting Trials) guidelines[78]. Ethical approval was obtained from the University of North Carolina at Chapel Hill institutional review board, and all participants were provided written informed consent prior to participating in the study.
Participants
Twenty males and females, ages 18-35 were recruited for the study from the University of North Carolina Chapel Hill campus and surrounded Chapel Hill area. Participants were recruited between November 2018 to February 2019, and all experimental visits occurred between November 2018 and March 2019. All participants were block randomly assigned to condition A or B (HGI or LGI) using a random number generator (randomizer.org).
Exclusion criteria included: less than 90 minutes of self-reported structured exercise per week, any known cardio-metabolic disorders, pregnant women, smokers, and currently taking any medication known to affect cardiovascular function.Because this is the first study of its kind and because elderly and diseased populations have different vascular sensitivity, a young, healthy, homogenous population was recruited to reduce the potential for confounding
variables.In women, because fluctuations in estrogen can affect cardiovascular measures, the first testing session was performed within the first 1-7 d of the onset of their menstrual cycle, and the second condition was performed within 7 d of the previous visit. Women reporting contraceptive use were tested during the placebo week.
Experimental Design
by a familiarization session. Both conditions were matched with a three hour sitting period. Three hours was chosen based on prior studies [26,32,79]. Additionally, the peak postprandial glucose concentration time is estimated to be two hours post-meal consumption [80]. Testing began between 6:00-10:00AM in the Cardiometabolic Lab in the Applied Physiology Laboratory within Fetzer Hall at the University of North Carolina – Chapel Hill (APL).
Prior to participation, subjects took part in an overnight fast while abstaining from alcohol and exercise 24 hours prior to experiment. Accelerometers were used to confirm participants abstained from moderate-to-vigorous physical activity (MVPA) the day before. Additionally, the night before, a standardized dinner was given based on the subjects’ individual food
preferences and food allergies. This standardized dinner was repeated the night before each testing day, at least 12 hours before the start of testing, and texts were sent to ensure
participants ate the meal at the same time before each experimental day. Pre-assessment
Prior to subject participation, ethical approval was obtained through the IRB and the Office of Human Research Ethics at the University of North Carolina – Chapel Hill (#17-2532). All subjects filled out a medical history questionnaire (Appendix A) and informed consent (Appendix B). If female, a pregnancy test was provided as well as confirmation subject is in day 1-7 of cycle for experimental visits. Then, using online randomization software
(www.randomizer.org) subjects were randomized into either LGI or HGI intervention for first visit.
Familiarization
and height was taken (in cm)) .and then positioned on a on a three-section table (Armedica AM353 Hi-Lo, Tiger Medical, Irvington, NJ). In the supine position, the continuous glucose monitor (CGM)(iPro2, Medtronic, Northridge, CA) was inserted into the subject’s abdomen, approximately 5 cm lateral to the umbilicus. The CGM was inserted at least 12 hours before the start of the experimental testing visit for each visit. Following insertion of the CGM, subjects were instructed how to use a glucometer (Contour Next One). A finger prick was needed at least 1 hour after insertion of the CGM (per Medtronic instructions) and before bed. If a subject wore the CGM for multiple days, they were instructed (and reminded through text message) to prick every 12 hours. The glucose levels measured through the glucometer was recorded with the time of prick. An accelerometer (ActiSleep +; ActiGraph LLC, Fort Walton Beach, FL) was also placed on the ankle to covary for spontaneous movement as well as to ensure subjects
refrained from exercise 24 hours prior to the experimental day. A 24-hour food log was given to each subject to record their foods the day before each experimental day. The day before experimental day 2, subjects were asked to eat similar meals as the day before experimental day 1. Finally, subjects were familiarized with the cognitive assessments using the standardized directions (Appendix C). Upon leaving the lab, subjects were given a reminders sheet (Appendix D) and their standardized dinner.
Experimental Visits
Subjects arrived to the APL (22.36 ±2°C, 26.09 ± 8.94% humidity) between 6:00 and 10:00 AM fasted (for Visit 2: 2-8 days following the first experimental visit). Subjects were fasted and refrained from caffeine intake for at least 12 hours, and alcohol and MVPA for at least 24 hours prior to arrival. Upon arrival, fasting blood glucose levels were measured using a
glucometer and participants filled out a sleep diary (Appendix E). Following 20 minutes of quiet rest, the subjects were read the standardized cognitive assessment instructions (Appendix C) and asked to assess their brain fog, then performed three 20 second Stroop test
aloud memory words from the Hopkins Verbal Learning Task (at the rate of 1 word every 2 seconds). Following the cognitive assessments, three 10 second ultrasound measurements at the Common Carotid artery and a video was recorded. Subjects were asked to hold their breath for each 10 second measurements, and 1 minute was given between each 10 second
measurement. Then, a 30 second video was taken at both the Internal Carotid and Vertebral arteries. After the ultrasound measurements, pulse wave velocity and pulse wave analysis measurements were taken.
Subjects were then brought to an upright, seated position using an Armedica AM353 Hi-lo Treatment Table (Tiger Medical, TIGER#TM83695) with their feet flat on the ground with approximately 90 degrees of knee flexion. If their feet could not touch the ground, a platform was used. Angle of chair recline was measured, as well as the distance from the bottom of the chair to the ground to ensure equivalent chair placement for the second visit. The HGI (glucose; GI: 100) or low GI (fructose; GI: 19) beverage (solution in g/kg of subject weight mixed with 300 mL of water, lemon juice given as option to add to make solution palatable) was then
Blood volume may change throughout the course of the sitting protocol due to filtration of the blood in the kidneys and insensible water loss through perspiration and respiration. This can cause between 100-250 ml of water loss in a period of 3 hours. For this purpose, water intake was monitored during both testing sessions. In addition, subjects were instructed to refrain from using the restroom during the study because standing and walking to the restroom would alter CV mechanisms. There were no instances of subjects getting up to use the restroom at any point during the study.
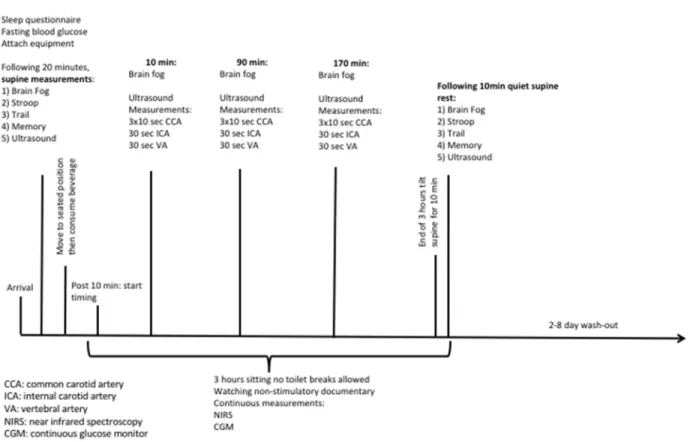
Figure 2. Experimental Day Timeline for Cerebrovascular/Cognitive Measurements Experimental Measures
Primary Outcome: Total Brain Blood Flow
170, and 180 to explore the effects of sitting and glycemic index on cerebrovascular function. At time points 0 and 180, the subject was in a supine position, and while at time points 10, 90, and 170, the subject was seated. At the common carotid, three 10 second videos were taken to determine cerebrovascular hemodynamics. During these 10 seconds, subjects were asked to hold their breath to avoid noise from respiration on the pulsed wave mode. At the internal and vertebral arteries, 30 second videos were recorded and further broken into 10 second videos during analysis. Total blood flow to the brain was calculated as the sum of the blood flow in the ICA and VA [(ICA blood flow + VA blood flow) x 2 (ml min-1)]. This equation is used to account for blood flow sorely to the brain, not face and scalp. The ICA and VA both directly perfuse the Circle of Willis.
Secondary Outcome: Cognition
Stroop
To assess if executive function was affected by prolonged sitting and glycemic index and perhaps declines in cerebral perfusion, the Stroop Word-Color Task (Stroop) was administered on an iPad [81]. The Stroop interference test involves 4 words (blue, yellow, green, and red) being randomly presented, consecutively. The color that each word is presented in is either congruent (Word) or incongruent (Color) with the relevant semantic information. For this task, 20 seconds was allotted for each trial, and subjects needed to complete as many iterations as quickly and correctly as possible. Response time, total number of iterations, and percentage correct were recorded. Stroop has been done previously within our lab group [Stoner –
unpublished, Fryer – unpublished] which allows for comparison of results. Acceptable reliability has been reported for both Word (ICC: 0.71) and Color (IC: 0.79) Tests in young adults [82]. Trail-Making Test – Part B
healthy populations [Stoner – unpublished, [73]], thus may be more appropriate than the Stroop Test. The Trail-Making Test – Part B presents numbers and letters placed in a semi-random fixed order, in such a manner to avoid overlapping lines being drawn. The subject connected 25 encircled numbers and letters in numerical and alphabetical order, alternating between the numbers and letters. For example, the first number ‘‘1’’ is followed by the first letter ‘‘A,’’ followed by the second number ‘‘2’’ then second letter ‘‘B’’ and so on [83]. Time to completion was recorded, and the test was repeated 3 times in a row.
Memory
To explore the effects of prolonged sitting and glycemic index on memory, a simple memory test was given. We created our own memory test to fit our time needs. Participants were read word lists from the Hopkins Verbal Learning Test at the rate of 1 word every 2 seconds during the pre-test, supine position cognitive testing period. The Hopkins Verbal Learning test word lists contain 12 words, 4 words from 3 semantic categories. After 3 hours of sitting, subjects were asked if they can recall any of the words during the post-test. It is
important to clarify we did not use the Hopkins Verbal Learning Test, we only used word lists from it. While this is not a validated and reliable measurement, it was a simple and quick way to explore the effects of sitting and glycemic index on memory.
Secondary Outcome: Brain Fog
As an exploratory measurement to assess brain fog, a rate of perceived exertion scale was used and adapted to fit brain fog. This measurement was used in unpublished studies (Piepmeier). This is not a standard assessment, nor is it reliable or valid, but its purpose was exploratory. This scale can be found in Appendix F.
Mechanistic Outcome: Cerebral Perfusion
measures perfusion and relative changes in total hemoglobin [84]. For the experimental protocol, the NIRS probe was positioned on the forehead, approximately 3 cm to the right of center, directly over the eyebrow. The rationale for this placement was based off the
international Electroencephalography 10-20 system for brain mapping and placement of electrodes for measuring the pre-frontal cortex [76]. Most importantly, perfusion within the prefrontal cortex has been shown to correlate to executive functioning [52]. The NIRS device was fixed to the skin with bio adhesive tape and the location was marked (and a picture was taken) to ensure identical placement on the second day. The optode was covered with a dark opaque cloth to prevent signal contamination by ambient light, as per the manufacturer recommendations. For each time point, data were averaged over 30 seconds.
Continuous Blood Glucose Monitoring
A continuous glucose monitor (iPro2, Medtronic, Northridge, CA) was used throughout the experimental procedure. It was placed on the participant 24 hours prior to Day 1 and taken out upon completion of Day 1 or Day 2, depending on the number of days between each testing session. Continuous blood glucose monitors give “24/7” coverage and the ability to characterize glycemic variability [77].
Randomization
The randomization was performed by chance, where 2 sets of 10 unique numbers were generated from a number range of 1-20 (www.randomizer.org). The randomization procedure was performed by a research assistant.
Sample Size
Calculations to determine minimum sample size was based on Elizabeth Kelsch’s primary central vascular health outcome, aortic pulse wave velocity (PWV). Previous research has reported that prolonged sitting reduces lower limb vascular health and endothelial function between 57-80 [25]. Based on a PWV of 6.2 m/s, which was predicted for healthy participants <30 y [85], a 57% decrease in PWV would be 3.5 m/s. For the current study, we opted to sample based on a conservative change score of 1 m/s, which is approximately 17 participants. 20 participants were recruited to account for drop-outs.
Quality Control
For brain blood flow, all ultrasound measurements were conducted by EK and all Cardiovascular Suite analyses (a relatively subjective analysis) were conducted by KB. Brain blood flow analysis took at least 10 hours per subject, so KB and two research assistants worked together on analysis in Microsoft Excel. At the conclusion of the study, a random selection of 10% of the data sets (e.g. from 3 participants) were re-scored by an independent observer.
Data Management and Statistical Analysis
All statistical analyses were performed using jamovi (2018, Version 0.9). The α level was
set a priori for all statistical procedures at α=0.05. Supine (Pre vs. Post) and sitting (min 10, 70
CHAPTER 4: RESULTS Participants
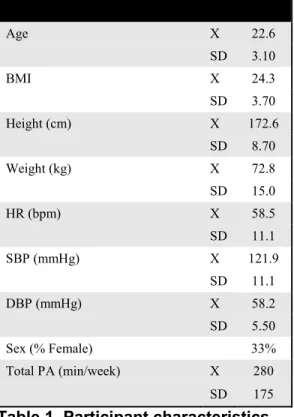
Twenty participants (22.6 [3.1] y, 33% F, 24.3 [3.7] kg/m2) were recruited. Participants self-identified as non-Hispanic White (n=14), African American (n=2), and Middle-eastern (n=4). Subject demographics are shown in Table 1. All female participants were on some type of birth control method.
Age X 22.6
SD 3.10
BMI X 24.3
SD 3.70
Height (cm) X 172.6
SD 8.70
Weight (kg) X 72.8
SD 15.0
HR (bpm) X 58.5
SD 11.1
SBP (mmHg) X 121.9
SD 11.1
DBP (mmHg) X 58.2
SD 5.50
Sex (% Female) 33%
Total PA (min/week) X 280
SD 175
Table 1. Participant characteristics.
Figure 3. CONSORT diagram. CCA Common Carotid Artery, ICA Internal Carotid Artery, VA Vertebral Artery.
Control Data
For the night before data collection, the total minutes in bed averaged 304.7 ± 25.1 minutes for the HGI condition and 433.3 ± 53.5 for the LGI condition. There was no significant difference between total MVPA (moderate-vigorous physical activity) during the 12-24 hours prior to experimental visits (HGI: 42.2 ± 33.5, LGI: 52.4 ± 40.8 minutes, p=0.079). Additionally, the AUC for blood glucose data 12 hours prior to experimental visits was similar between LGI and HGI (64,330 ± 19.9 and 65,936 ± 14.3, respectively, p<0.05).
Baseline data
CCA ICA VA
Bfmean Bfmean Bfmean
m/s m/s m/s
Baseline HGI X 4527 3603 1636
SD 1157 1510 1162
Baseline LGI X 4801 2968 1545
SD 1367 1682 1074
P 0.510 0.260 0.434
ES 0.22 -0.40 -0.08
Table 2. Total brain blood flow baseline data. HGI High glycemic index, LGI Low glycemic index, Bfmean Blood Flow Mean, CCA Common Carotid Artery, ICA Internal Carotid Artery, VA Vertebral Artery.
NIRS
SRS HbO2 SRS HHb SRS tHb TSI
%
Baseline HGI X 37.454 27.949 65.403 57.179
SD 12.162 8.942 17.955 7.568
Baseline LGI X 42.777 26.701 69.478 60.937
SD 14.356 7.283 19.690 7.262
P 0.211 0.610 0.474 0.117
ES 0.40 -0.15 0.22 0.51
Table 3. Prefrontal cortex cerebral perfusion baseline data. HGI High glycemic index, LGI Low glycemic index, SRS HbO2 Oxy hemoglobin, SRS HHb Deoxy hemoglobin, SRS tHb Total hemoglobin, TSI Total Saturation Index.
Stroop Trail Fog
RT Correct Accuracy Time Score
ms # % ms %
Baseline HGI X 0.9 16.7 99.7 25.9 2.4
SD 0.2 4.3 1.0 8.6 1.5
Baseline LGI X 0.9 18.2 99.7 23.4 2.2
SD 0.0 3.7 1.1 7.7 1.2
P 0.170 0.107 0.860 0.263 0.466
ES 0.32 0.37 0.06 -0.30 -0.16
Table 4. Stroop, Trail, and Fog baseline data. HGI High glycemic index, LGI Low glycemic index, RT Reaction Time.
Continuous Blood Glucose Monitoring
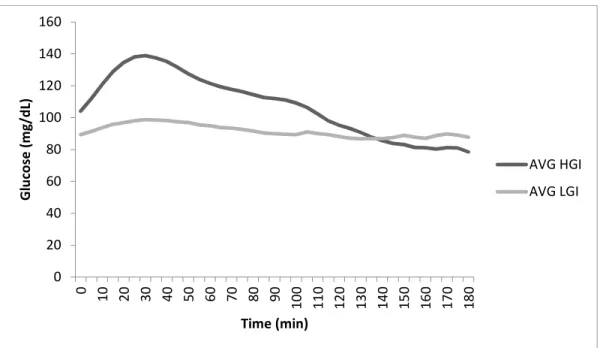
area under the curve (AUC) (19429±98) than LGI (16498±19). For average values, there was a significant, large effect (P=0.00, ES:-1.2). Additionally, for AUC, there was a significant large effect (P=0.00, ES:-1.15).
Figure 4. Average Glucose Across 3 hours of sitting. HGI High glycemic index, LGI Low glycemic index.
Primary Outcome: Total Brain Blood Flow
Our primary outcome was QBF. There was no interaction effect and no effect of time, however, there was a significant, small condition effect (P=0.04, ES: -0.06) (Table 5). For LGI, QBF decreased by 2203.2 ml/min (95% CI: -5136 to 2719), and for HGI, QBF increased by 73.8 ml/min (95% CI: -2719 to 73)(Figure 4).
Table 5 also reports BF values for each artery supplying the head. QBF is comprised of BF from VABF and ICABF. Changes were not significant for VABF, but for the ICABF, the changes mirror QBF, in that there was a significant, small condition effect (P=0.043, ES: -0.11). For CCABF there was a time effect across conditions (P=0.002, ES: -0.38). Across condition, BF decreased. Brain blood flow in the supine position is shown in Table 5, while blood flow to the brain data in the seated position is in Appendix G.
CCA ICA VA Q(mean)
Bfmean Bfmean Bfmean Bfmean
(ml/min) (ml/min) (ml/min) (ml/min)
Pre HGI X 4527 3603 1636 6889
SD 1157 1510 1162 2906
LGI X 4801 2968 1545 6237
SD 1367 1510 1162 2906
Post HGI X 3778 3110 1944 6949
SD 975 2065 1972 5808
LGI X 4162 2259 1141 4490
SD 1022 1178 786 2320
Interaction P 0.798 0.709 0.165 0.189
Time P 0.002 0.102 0.786 0.340
ES -0.38 -0.20 -0.04 -0.13
Condition P 0.129 0.043 0.076 0.040
ES 0.11 -0.11 -0.09 -0.06
Table 5. Supine: Brain Blood Flow. HGI High glycemic index, LGI Low glycemic index, Bfmean Blood Flow Mean, CCA Common Carotid Artery, ICA Internal Carotid Artery, VA Vertebral Artery.
Figure 5. Total Brain Blood Flow; Pre to Post
Secondary Outcome: Cognition
Table 6 shows supine results from the Stroop Test, Trail Making Test, and Memory Test. There were no interaction effects for these assessments. There was a significant time effect
(P=0.023, ES: -0.39), as well as significant condition effect (P=0.046, ES: 0.046) for the Trail Making Test.
Stroop Trail Memory
RT Correct Accuracy Time Correct
ms # % ms #
Pre HGI X 0.88 16.69 99.67 25.86
SD 0.20 4.30 1.00 8.62
LGI X 0.90 18.20 99.70 23.41
SD 0.20 3.70 1.10 7.66
Post HGI X 0.90 18.40 100.00 23.00 0.50
SD 0.20 4.10 0.00 6.91 0.20
LGI X 1.00 18.80 99.80 21.00 0.50
SD 0.20 3.20 1.00 5.57 0.18
Interaction P 0.439 0.273 0.443 0.836 0.375
Time P 0.125 0.032 0.401 0.023
ES 0.26 0.37 0.14 -0.39
Condition P 1.368 0.273 0.665 0.046
ES 0.28 0.40 -0.10 -0.48
Table 6. Supine: Stroop, Trail, Memory.
Figure 5 shows seated results from the Brain Fog scale. There was no interaction effect and no significant differences between conditions HGI and LGI (P=0.612), but there was a significant, moderate (P=0.025, ES: 0.37) time effect, suggesting in both conditions subjects became foggier.
Figure 6. Brain Fog; Seated. 0.0 1.0 2.0 3.0 4.0 5.0 6.0
0 30 60 90 120 150 180
B ra in F o g ( S co re # ) Time (min)
HGI
LGI
Interaction: P=0.327Time: P=0.025, ES: 0.35
Mechanistic Outcomes: Oscillatory Blood Flow and Arterial Stiffness
Table 7 shows oscillatory blood flow and arterial stiffness in the supine position. There were no interaction effects and no significant differences between conditions HGI and LGI.
CCA ICA VA
Stiff PWV (β) Osc. Stiff PWV (β) Osc. Stiff PWV (β) Osc.
AU m/s ratio AU m/s ratio AU m/s ratio
Pre HGI X 9.93 5.22 0.53 12.00 5.64 1.77 12.79 6.25 3.85
SD 2.90 0.91 1.01 4.11 1.01 3.57 11.01 1.66 4.92
LGI X 9.80 5.13 0.43 12.19 5.62 2.22 15.03 6.22 4.95
SD 2.77 0.85 0.47 4.11 1.01 3.57 11.01 1.66 4.92
Post HGI X 9.25 4.97 1.16 12.55 5.76 3.13 16.53 6.52 8.28
SD 3.28 0.86 1.91 5.58 1.44 4.24 13.91 2.23 18.09
LGI X 10.00 5.16 0.37 11.33 5.42 1.46 13.47 5.90 12.93 SD 3.72 0.88 0.37 6.47 1.47 1.95 6.85 1.43 23.32 Interaction P 0.359 0.197 0.143 0.493 0.510 0.244 0.255 0.478 0.844 Time P 0.631 0.359 0.288 0.876 0.880 0.756 0.723 0.966 0.302 ES -0.06 -0.11 0.13 -0.02 -0.02 0.04 0.05 0.01 0.14 Condition P 0.512 0.561 0.051 0.610 0.372 0.488 0.818 0.547 0.498
ES 0.95 1.78 -3.91 -0.50 -1.84 -0.73 -0.14 -0.91 0.32
Table 7. Supine: Oscillatory Blood Flow and Arterial Stiffness. HGI High glycemic index, LGI Low glycemic index, Bfmean Blood Flow Mean, CCA Common Carotid Artery, ICA Internal Carotid Artery, VA Vertebral Artery, Stiff Stiffness, PWV Pulse Wave Velocity, Osc. Oscillatory.
Mechanistic Outcome: Cerebral Perfusion
Table 8 shows prefrontal cortex cerebral perfusion in the supine position. There were no interaction effects and no significant differences between conditions HGI and LGI.
SRS HbO2 SRS HHb SRS tHb TSI(%)
Pre HGI X 37.45 27.95 65.40 57.18
SD 12.16 8.94 17.96 7.57
LGI X 42.78 26.70 69.48 60.94
SD 12.16 8.94 17.96 7.57
Post HGI X 41.11 27.62 68.73 59.74
SD 15.24 10.58 24.74 5.88
LGI X 41.16 25.57 66.73 60.91
SD 14.35 6.65 19.01 7.76
Interaction P 0.209 0.738 0.302 0.272
Time P 0.584 0.642 0.840 0.282
ES 0.10 -0.08 0.04 0.19
Condition P 0.324 0.226 0.854 0.064
ES 0.25 -0.31 0.05 0.47
CHAPTER 5: DISCUSSION
The aim of the current study was to evaluate the combined effects of prolonged sitting and glycemic index (HGI vs. LGI) on total brain blood flow and cognitive function (executive function, memory, and brain fog). It was hypothesized that (1) prolonged sitting will (a) result in decreased total brain blood flow, and (b) this decrease will be exacerbated by HGI. The major findings of this study are that total brain blood flow decreased with prolonged sitting in the LGI condition, total brain blood flow increased in the HGI condition, and that sitting resulted in an increase in brain fog irrespective of condition. Prefrontal cortex cerebral perfusion and Stroop test scores did not change with condition or time, and contrary to expected, executive function improved across time in both conditions.
Limitations and Strengths
females would not affect our results. Although this study has a few limitations, it also has several strengths including the first look into how consumption of a HGI meal affects total brain blood flow during prolonged sitting, which helps to expand knowledge on the effects of
prolonged sitting. Third, trial conditions were standardized for potential confounders such as diet, physical activity, and baseline values. Finally, this study is an adequately powered double blind crossover design, which limits most bias in our results.
Comparison to Literature: Brain Blood Flow
Our first hypothesis was that sitting results in decreased QBF, and this was shown through our control condition, LGI. The LGI impact on QBF is consistent with previous literature in that prolonged sitting reduces cerebral blood flow [86]. Contrary to our second hypothesis that a HGI meal would further decrease QBF, a HGI meal resulted in an increase in QBF. The
hypothesis was predicted as prolonged exposure to hyperglycemia and repeated exposure to hypoglycemia can induce microvascular damage and impair endothelial function leading to cerebral hypoperfusion [42–44], and thus cerebral blood flow may decrease during acute hyperglycemia [64,65]. Our study, however, looked at young healthy adults and an acute serving of a high glycemic index meal, and thus our subjects may have been able to protect themselves against damage.
This placement is also known as FP2 and the rationale was based off the international Electroencephalography 10-20 system for brain mapping and placement of electrodes for measuring the pre-frontal cortex [76]. A limitation of using this placement (the 10-20 system) is assumption of the placement over the prefrontal cortex. Other placements have been used, such as AF4 (unpublished data – Faulkner). However, we pursued our location based upon previous studies completed in our laboratory (unpublished), but comparing positioning should be considered in future studies.
Comparison to Literature: Cognition
Executive function (assessed by both the Stroop and Trail Making Test, Part B), did not get worse with prolonged sitting and the HGI condition. In fact, the Trail Making Test, Part B, results improved over time across both conditions. Although both sitting and HGI meals tend to independently decrease cognitive function chronically [42,73], these findings align with a
previous study in our group [Stoner – unpublished] that found executive function (Stroop) did not get worse with prolonged sitting. We selected to administer both the Stroop and Trail as they are widely recognized assessments of executive function and are relatively short tests, which will minimize mental stimulation and interference with vascular measurements. Our subjects’ age, level of education, and the lack of time between the tests (3 hours) may have prevented changes in executive function. In fact, these tests may not have been challenging enough for our subjects, and there may been a learning effect. We did not allow for practice sessions and instead allowed our participants to take the test three times in a row. We also read aloud standardized instructions prior to administering the test.
Perdomo et al. assessed measures of sleepiness, mental effort, and fatigue and found these measures did not significantly differ by condition, but did significantly differ by time. It is clear that with prolonged sitting, there is an increase in perceived brain fog, sleepiness, mental effort, and fatigue; and these subjective measurements may be a better estimate of the effects on the brain. Therefore, future studies looking at prolonged sitting should continue to use these measures and see if they differ by any conditions.
Implications
While previous studies have associated chronic sedentary behavior with reductions in brain volume[1] and a decline in cognitive function [3,4], less is known about the mechanism(s) linking repeated acute sedentary behavior exposure to chronic cerebrovascular complications and how lifestyle factors, such as poor dietary choices like HGI meals, may impact these complications. A potential pathway, and one which has been suggested to link repeated
prolonged sitting exposure to peripheral and central cardiovascular complications, is blood flow. Two recent studies reported that prolonged sitting decreases middle cerebral artery blood flow [5] and cerebral blood flow velocity [5,88]. In this study, we found that total brain blood flow did decrease across 3 hours, but an HGI meal increases total brain blood flow. However, it is important to state that this study was conducted on young, healthy, active participants, and the findings may not be generalizable. Next, future studies are needed that measure total brain blood flow, cerebral blood flow velocity, perfusion and autoregulation simultaneously to help further understand the effects of prolonged sitting on cerebrovascular function. It is also recommended that future studies utilize executive function tests which are appropriate for the population of interest and minimize prolonged mental stimulation. Finally, this study should also be repeated in older populations and those with chronic disease, so findings are more
Conclusions
The purpose of this study was to determine, in young healthy active adults, the effects of prolonged sitting (3 hours), with or without a HGI meal, on total brain blood flow, cognition (executive function, memory, and brain fog), and prefrontal cortex cerebral perfusion. We found that prolonged sitting does decrease total brain blood flow, but contrary to expected, a HGI meal results in an increase in total brain blood flow. While we found that total brain blood flow
APPENDIX A: MEDICAL HISTORY FORM
Department of Exercise and Sport Science
Medical History Questionnaire Screening
Subject:__________________________ Cell Phone #:______________