230
Iranian (Iranica) Journal of Energy & Environment
Journal Homepage: www.ijee.net
IJEE an official peer review journal of Babol Noshirvani University of Technology, ISSN:2079-2115
Gas Sensing and Structural Properties of a Nano-structure MoO3-based Hydrogen
Sensor
S. Farzi Kahkesh1, A. Fattah1*, M. B. Rahmani2
1 Department of Electrical Engineering and Robotic, Shahrood University of Technology, shahrood, Iran 2 Department of Physics, Shahrood University of Technology, shahrood, Iran
P A P E R I N F O
Paper history:
Received 16 August 2019
Accepted in revised form 14 November 2019
Keywords:
Blade H2 Sensor
Metal Oxide Semiconductor MoO3
A B S T R A C T
In this research, thin films of molybdenum trioxide were deposited on a glass substrate using Doctor Blade method. Ammonium Heptamolbudate tetrahydrate (NH4)6Mo7O24 powder is considered as a precursor to this
study. Growth of the samples in three main directions of (020), (040) and (060) showed the formation of a
layered structure and also the formation of α-phase of molybdenum oxide. In addition, scanning electron microscope imaging of the samples showed flat micro-capsule like structure. Furthermore, gas sensing properties of the fabricated structure were studied in expose to different concentrations of hydrogen gas. The highest and lowest sensitivities were reported about 16 and 91%, for 100 and 1000 ppm of hydrogen gas, respectively, which shows more sensitivity compare to previous studies. Moreover, the fabricated sensor exhibits good stability as well as repeatability for H2 gas detection.
doi: 10.5829/ijee.2019.10.04.01
INTRODUCTION1
The human nose is recognized as a natural sensing device for the identification and separation of many gases. But the important point is that the nose (human olfactory system) is not only incapable of detecting odorless gases, but also not be able to estimate and determine the concentration of the gases in the environment. Therefore, detection of these type of gases is vital.
In past two decades, the construction and development of small-sized gas sensors have attracted a large part of the attention and efforts of scientists. These sensors cover a wide range of industrial applications, from the identification of toxic gases to the detection of gas in the of production process [1].
Chemical gas sensor is a device that, upon exposure to the gas molecules, one or more of it’s physical, structural or electrical properties changes. These changes convert to an electrical signal, with a magnitude proportional to the concentration of the gas ambient. Most of the studies over the sensor manufacturing, because of the challenges of the sensor fabrication process in small dimensions, has not reached the stage of commercialization yet. Moreover, inaccuracy and inherent characteristics of the sensor itself have made it difficult to be reliable [2].
Many other micro-sensors are used widespread. Different structures such as Metal-Oxide Semiconductors, Catalytic-oxides, and Structures involving the combination of these two
*Corresponding Author Email: [email protected] (A. Fattah)
structures, demonstrate different physical properties in exposure to different gases. Also, metal-oxide sensors are widely used because of their low price, easy fabrication process, and simple measurement methods. Metal-oxide based sensors have become more prominent since the second half of the 20th century, and are also known by other names such as chemo-resistive (semiconductor) or catalytic/thermal conductivity (hot wire) sensors [3]. Over the past few years, these kind of sensors which commonly considered as chemical resistance sensors are used in various fields, such as home environmental monitoring, public security, medical and health monitoring, military, food control units, etc. [4, 5].
Among these sensors, molybdenum trioxide (MoO3) acts
as an n-type semiconductor with a wide band-gap of about 2.8 to 3.8 eV. MoO3 has three crystalline phases of stable
thermodynamic phase (α-MoO3), semi-stable phase (β-MoO3)
and hexagonal phase (γ-MoO3). The α-phase is used in a wide
range of applications such as gas sensors, lithium-ion and biochemical batteries [6, 7]. This material is synthesized by various methods including thermal evaporation [8], chemical vapor deposition [9], pyrolysis spray [10], and Sputtering [11]. The metal oxide is used to detect many gaseous molecules such as NO2, NO, H2, CO, ethanol, and acetone.
Hydrogen (H2), is a colorless, odorless, and tasteless gas,
MATERIALS AND METHODS
MoO3 powder synthesis
As the first step of the MoO3 powder preparation, 4 g of
ammonium heptatemolydate tetra hydrate ((NH4) 6Mo7O24) (Merck) was dissolved in 75 ml of a solution, including ethanol, ammonia and deionized water (2:2:1) for 2 h under magnetic stirrer to reach a transparent solution. The final solution is dried at room temperature to obtain MoO3 white
powder.
Deposition of MoO3 using blade technique
To deposit a thin film of molybdenum oxide, 2g of the as-synthesized powder is dissolved in 3.3 ml of a solution, including water and ethanol (1:1). Then 0.043 ml of acetic acid (17 M) was added to the solution while it was on the magnetic stirrer for 20 minutes. (It’s also possible to put the final solution in ultrasonic for 6 minutes in this step). Next, we added 0.34 ml of ethylene glycol and 0.34 ml of propylene glycol in to the solution. Finally, the solution was heated on the magnetic stirrer at 60 °C to obtain a white and dense mold-like structure. As is shown in Figure 1, the mold-mold-like MoO3
was paste on the glass substrate using the blade method and after that annealing process was performed at 120 °C for 30 minutes.
Gas sensor fabrication
For the fabrication of the sensor, two interdigital Au electrode was deposited on MoO3 structure, with a thickness of about
100 nm, using DC-Magnetron Sputtering. Then, two thin copper wires (to make an ohmic contact) was attached on the electrodes. In this work, the surface morphology of prepared MoO3 films were studied using a field emission scanning
electron microscope (FESEM Model: Sigma VP\\Zeiss). XRD patterns were recorded by a D8-Advance Bruker AXS diffractometer in the scanning range of 10–70˚, using Cu Kα1 radiation having a wavelength of 1.5406 Å. Micro Raman spectroscopy was performed using Avantes uRaman-532-M with the excitation wavelength of 532 nm (with a laser power of 50 mW) in the spectral range of 150- 3400 cm -1 and
spectral resolution of 7 cm-1. Figure 2 shows the fabricated
sample of the sensor.
RESULTS AND DISCUSSION
Structural and morphological analysis
The X-ray diffraction pattern (XRD) of the sample is shown in Figure 3. All of the characteristic peaks are adapted with the orthorhombic α-MoO3 crystal structure with lattice
Figure 1. Schematic illustration of Blade deposition method
Figure 2. Image of the fabricated sensor
constants of a=3.963 A˚, b=13.586 A˚, c=3.6966 A˚ (according to the standard card of JCPDS No. 05-0508). MoO3 growth in three directions of (020), (040) and (060)
shows the layer formation and also high crystalinity of the sample. Furthermore, sharp peaks at (020), (040) and (060) compare to (110) and (021), indicate two-dimensional growth of the sample.
More intense peaks at (0k0) demonstrate the vacancy of molecules and ions between the layers; therefore, causing the rapid transfer of electrons via these vacancies onto the sensor surface. Other smaller peaks which are observed in the XRD pattern, may be related to the presence of another type of molybdenum oxide. However, as is obvious, the peaks in the phase of α-MoO3 are more intense [13].
The Raman spectroscopy of the sample at room temperature is shown in Figure 4. The sharpness of the peaks indicates that the corresponding vibrational modes are due to a highly ordered structure. The peak at 995 cm-1 would be
attributed to the stretching mode of the oxygen atoms located on the octagonal apex of MoO6 (Mo6 + = O) along the b axis
(in fact, it belongs to the oxygen that is not shared between MoO6 octagons) and the peak which corresponds to the
few-layer of MoO3 is relatively weak. The peak at 818 cm-1 is
assigned to the stretching mode of oxygen located between two neighbor Mo atoms (Mo2-O) along the a-axis, which
results from the corner shared of oxygen between two octahedral. But this peak of the few-layer MoO3 sample is
relatively strong. O-Mo-O asymmetric stretching /bending mode, O-Mo-O sheared mode, O-Mo-O bending mode and kinetic mode O = Mo = O accrues at 475 cm-1, 372 cm-1, 335
cm-1 and 285cm-1, respectively. Also, the O = Mo = O
torsional mode, RC mode, O=Mo=O twisting mode, and Tb mode occurs at 242cm-1, 217 cm−1, 197 cm−1 and 155 cm−1,
Figure 4. Raman spectra of MoO3 thin film
respectively. The peak positions are compatible with those reported in literature reviews of (α-MoO3) crystalline phase.
There are minor displacements in the peaks position in the Raman spectrum, which are related to the changes in the constant of the strength bonds of the nucleus. The larger constant force leads to positive displacement in the peaks and the smaller constant force leads to a negative displacement in the peaks [14, 15].
Figure 5 shows the surface morphology of MoO3 thin film
which is studied using FESEM observations in different scales. Due to Figure 5(a), the surface is covered with capsule-like micro-plates. The Inset of this figure shows the thickness of the deposited MoO3 structure which is approximately 9
µm. Figure 5(b) shows the cross-section view of the structure in which the plates stretched in different directions and overlap on each other and confirms the lamellar growth. Inset of this figure expresses the plate’s thickness distribution of the surface and gives us a mean size of about 0.3 µm. Moreover, the mean value of the nanoplates length and width are approximately 1.9 µm and 0.8 µm, respectively.
(a)
(b)
Figure 5. SEM image of MoO3 thin film deposited by Blade
method
Gas sensing properties
Gas sensing properties of the fabricated structure are measured toward various concentrations of hydrogen on different temperatures from 210 ˚C to 300 ˚C using conductometric measurement. In Equation (1), the sensitivity (S) of MoO3 based sensor is defined [7].
𝑆% = 𝑅𝑎−𝑅𝑔
𝑅𝑎 × 100 (1)
where 𝑅𝑎 and 𝑅𝑔 represents the resistance of the MoO3 layer
in exposing to air and gas, respectively. The gas sensing mechanism of metal oxides is based on the changes in electrical conductance of the semiconducting oxide film, at high temperatures. MoO3 is an n-type semiconductor in which
the majority carrier is electron. Thus, the resistance of the sensitive material is defined by the concentration of electrons. As MoO3 is exposed to the air ambient, oxygen molecules are
absorbed on the sensor surface and trap the electrons from the conduction band which results in the band -bending of the energy diagram and subsequently, an electron-depleted region would be created beneath the surface. As a result, the potential barrier increases and then the sensor resistance increases [16, 17]. The area which is devoid of electrons is also called the space charge layer that its thickness is equal to the length of the bending zone. However, as the gas exposure reduces, the gas molecules oxidize with the absorbed oxygen, results in the release of electrons and return to the conduction band. As a result, the potential barrier and the length of the space charge layer will be reduced, so the resistance will decrease. Figure 6 shows a schematic illustration of the sensing mechanism of the sensor after the absorption of oxygen and target gas. In Figure 7, the time response of the resistance of the sensor is shown due to the 200 ppm insertion and exhaust of H2.
Figure 8 shows the time response of the fabricated gas sensor based on the exposure of different concentrations of H2
at 260 ˚C. Moreover, as another result of this figure, the sensor’s sensitivity shows good recursion to the initial value after each time the gas is cut off, which let us have a stable and repeatable H2 detector. It’s apparent that the sensitivity of
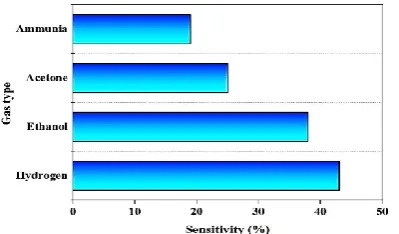
the sensor increases as the gas concentration increases because of the increment of the surface reactions with the hydrogen molecules. Figure 9 shows the gas sensing response of MoO3 thin films toward three different gases for a fixed
concentration (400 ppm) at 260˚C. Obviously, the sensor sensitivity to hydrogen is much higher than acetone, ethanol and ammonia.
Figure7. Changes in the resistance of the thin film structure due to the insertion and exhaust to 200 ppm of H2
Figure 8. Time response of the gas sensor to the exposure of 100-1000 ppm of H2 at 260 ˚C
It’s apparent that the sensitivity of the sensor increases as the gas concentration increases because of the increment of the surface reactions with the hydrogen molecules. Figure 9 shows the gas sensing response of MoO3 thin films toward
three different gases for a fixed concentration (400 ppm) at 260˚C. Obviously, the sensor sensitivity to hydrogen is much higher than acetone, ethanol and ammonia.
Table 1 shows a summary of gas sensing properties of the fabricated MoO3-based sensor at different concentration of H2
at 260 ˚C. With the gas concentration increment, while the sensitivity of the sensor increases, the response and recovery times of the sensor decreases and increases respectively, at a fixed temperature.
Figure 9. Gas sensing response of MoO3 thin films toward three
different gases (400 ppm) at the temperature of 260˚C
A comparison of our sensor performance with other similar fabricated structures is presented in Table 2, which shows that our sensor is a more sensitive to hydrogen gas compare to the others.
TABLE 1. Summary of gas sensing properties of the MoO3 structure
for different concentration of H2 at 260 ˚C
Gas concentration (ppm)
Sensitivity (%)
Response time (s)
Recovery time (s)
100 16 337 60
200 28 143 82
300 38 83 85
400 49 41 200
1000 91 30 280
TABLE 2. A comparison between the sensitivity of MoO3-based H2
sensors of other researches and present study
Gas concentration (ppm) Sensitivity (%) Reference
1000 33 [19]
1000 89.3 [20]
1000 91 This study
CONCLUSION
Present study, molybdenum oxide thin films were deposited on a glass substrate using Dr. Blade's method with a thickness of about 9.3 μm and the mean value of about 300nm. The morphology of the deposited structure indicates the presence of flat micro-capsules overlap on each other and the results of X-ray diffraction pattern analysis confirmed the stable thermodynamic phase formation of molybdenum oxide. The H2 gas sensor is fabricated of the as-deposited structure which
exposed to various concentrations (100-1000 ppm) of hydrogen at 260 ˚C. The highest and lowest sensitivities were reported of about 16 and 91 % for the concentrations of 100 ppm and 1000 ppm, respectively. As an important observation, the time responses of a particular gas ambient were both stable and repeatable.
REFERENCES
1. Eranna, G., 2016. Metal oxide nanostructures as gas sensing devices. CRC press.
2. Eranna, G., Joshi, B.C., Runthala, D.P. and Gupta, R.P., 2004. Oxide materials for development of integrated gas sensors—a comprehensive review. Critical Reviews in Solid State and Materials Sciences, 29 (3-4), pp.111-188.
3. Tricoli, A., Righettoni, M. and Teleki, A., 2010. Semiconductor gas sensors: dry synthesis and application. Angewandte Chemie International Edition, 49(42), pp.7632-7659.
5. Rahmani, M.B., Keshmiri, S.H., Yu, J., Sadek, A.Z., Al-Mashat, L., Moafi, A., Latham, K., Li, Y.X., Wlodarski, W. and Kalantar-Zadeh, K., 2010. Gas sensing properties of thermally evaporated lamellar MoO3. Sensors and Actuators B: Chemical, 145(1), pp.13-19.
6. Kröger, M., Hamwi, S., Meyer, J., Riedl, T., Kowalsky, W. and Kahn, A., 2009. P-type doping of organic wide band gap materials by transition metal oxides: A case-study on Molybdenum trioxide. Organic Electronics, 10(5), pp.932-938.
7. Mousavi-Zadeh, S.H. and Rahmani, M.B., 2018. Synthesis and ethanol sensing characteristics of nanostructured MoO3: Zn thin
films. Surface Review and Letters, 25(01), pp.1-10.
8. Dhara, A., Hodes, G. and Sarkar, S.K., 2014. Two stage chemical bath deposition of MoO3 nanorod films. RSC Advances, 4(96),
pp.53694-53700.
9. Davtyan, D., Manukyan, K., Mnatsakanyan, R. and Kharatyan, S., 2010. Reduction of MoO3 by Zn: Reducer migration
phenomena. International Journal of Refractory Metals and Hard Materials, 28(5), pp.601-604.
10. Rahmani, M.B., Keshmiri, S.H., Shafiei, M., Latham, K., Wlodarski, W., Du Plessis, J. and Kalantar-Zadeh, K., 2009. Transition from n-to p-type of spray pyrolysis deposited Cu doped ZnO thin films for NO2
sensing. Sensor Letters, 7(4), pp.621-628.
11. Breedon, M., Rahmani, M.B., Keshmiri, S.H., Wlodarski, W. and Kalantar-zadeh, K., 2010. Aqueous synthesis of interconnected ZnO nanowires using spray pyrolysis deposited seed layers. Materials Letters, 64(3), pp.291-294.
12. Hübert, T., Boon-Brett, L., Black, G. and Banach, U., 2011. Hydrogen sensors–a review. Sensors and Actuators B: Chemical, 157(2), pp.329-352.
13. Cai, L., McClellan, C.J., Koh, A.L., Li, H., Yalon, E., Pop, E. and Zheng, X., 2017. Rapid flame synthesis of atomically thin MoO3 down
to monolayer thickness for effective hole doping of WSe2. Nano
letters, 17(6), pp.3854-3861.
14. Jadkar, V., Pawbake, A., Waykar, R., Jadhavar, A., Mayabadi, A., Date, A., Late, D., Pathan, H., Gosavi, S. and Jadkar, S., 2017. Synthesis of orthorhombic-molybdenum trioxide (α-MoO3) thin films by hot
wire-CVD and investigations of its humidity sensing properties. Journal of Materials Science: Materials in Electronics, 28(21), pp.15790-15796.
15. Li, T., Zeng, W., Zhang, Y. and Hussain, S., 2015. Nanobelt-assembled nest-like MoO3 hierarchical structure: Hydrothermal synthesis and
gas-sensing properties. Materials Letters, 160, pp.476-479.
16. Sun, Y.F., Liu, S.B., Meng, F.L., Liu, J.Y., Jin, Z., Kong, L.T. and Liu, J.H., 2012. Metal oxide nanostructures and their gas sensing properties: a review. Sensors, 12(3), pp.2610-2631.
17. Wang, C., Yin, L., Zhang, L., Xiang, D. and Gao, R., 2010. Metal oxide gas sensors: sensitivity and influencing factors. Sensors, 10(3), pp.2088-2106.
18. Vinoth, E., Gowrishankar, S. and Gopalakrishnan, N., 2018. Effect of Mg doping in the gas-sensing performance of RF-sputtered ZnO thin films. Applied Physics A: Materials Science & Processing, 124(433), pp.1-8.
19. Kwon, H., Lee, Y., Hwang, S. and Kim, J.K., 2017. Highly-sensitive H2 sensor operating at room temperature using Pt/TiO2 nanoscale
Schottky contacts. Sensors and Actuators B: Chemical, 241, pp.985-992.
20. Alsaif, M.M., Balendhran, S., Field, M.R., Latham, K., Wlodarski, W., Ou, J.Z. and Kalantar-Zadeh, K., 2014. Two dimensional α-MoO3
nanoflakes obtained using solvent-assisted grinding and sonication method: application for H2 gas sensing. Sensors and Actuators B:
Chemical, 192, pp.196-204.
![Figure 6. Gas sensing mechanism of an n-type semiconducting gas sensors [18]](https://thumb-us.123doks.com/thumbv2/123dok_us/8810064.1776849/3.595.83.244.503.734/figure-gas-sensing-mechanism-type-semiconducting-gas-sensors.webp)