Copyright © 2013 IJECCE, All right reserved
BEMD with Clustering Algorithm for Segmentation of
Microarray Image
Lakshmana Phaneendra Maguluri
PG Students of Department of IT, GIT, GITAM University E-mail : [email protected]
Sandeepraja Batchu
PG Students of Department of IT, GIT, GITAM University
Eswar Patnala
PG Students of Department of IT, GIT, GITAM University
Abstract –Image segmentation is one of core challenging areas in image analysis. However, many segmentation algorithms have been developed for several applications. In some cases they encountered unsatisfactory results. For segmentation of microarray images clustering algorithms have been applied. Considering micro array image as analysis, micro array image contain noise and noise could affect the image segmentation results. In order to overcome this drawback, this we propose to combine the clustering
algorithms’ with BI-Dimensional Empirical mode
decomposition for segmentation of micro array images in order to reduce effect of noise. We call this method as Weighted Fuzzy C-means with Bi-Dimensional Empirical Mode Decomposition (WFCBEMD) for image segmentation. We use an adaptive local weighted averaging filter in the BEMD method for removing the noise in the image. Then the filtered image is finally with conventional K-means algorithm.
Keywords–Bi-Dimensional Empirical Mode Decomposition, Clustering Algorithms, DNA Micro Array Processing.
I. I
NTRODUCTIONClustering methods have become a revolution step in microarray data analysis because they can identify groups of genes or samples displaying a similar expression profile. Clustering is an unsupervised classification (grouping).attach label to each data points in a set, so that object in each set can share some common trait. i.e. maintaining students (name, Roll-id, Branch, collage name).
Microarray technology has been recently introduced and provides solutions to a wide range of problems in medicine, health and environment, drug development, etc. Microarrays, widely recognized as the next revolution in molecular biology, enable scientists to analyze genes, proteins and other biological molecules on a genomic scale [1]. A microarray is a collection of spots containing DNA deposited on the solid surface of glass slide. Each of the spot contains multiple copies of single DNA sequence [2].Microarray expression technology helps in the monitoring of gene expression for tens and thousands of genes in parallel.
A Deoxyribonucleic Acid (DNA) microarray is a collection of microscopic DNA spots attached to a solid surface, such as glass, plastic or silicon chip forming an array. The analysis of DNA microarray images allows the identification of gene expressions to draw biological conclusions for applications ranging from genetic profiling to diagnosis of cancer. The processing DNA microarray image analysis includes three tasks: gridding, segmentation and intensity extraction.
Fig.1. processing of DNA Microarray Image
Gridding: is a crucial process in microarray image processing, in order to locate and identify where exactly the pixel is present. However, this preprocessing ensures addressing spots more efficiently. Gridding method for microarray image is mainly classified into three categories manual, semi-automated and automated. Moreover gridding is the process of segmenting the microarray image into compartments, each compartment having only one spot and background Segmentation: Based on segmentation, the accuracy of microarray data is significantly affected. From fast few years, much number of methods has been adopted for segmentation of microarray images. Fixed and adaptive circle segmentation methods are the early approaches. I.e. (segmenting each compartment into one spot and its background area).Intensity Extraction: The core component extraction in microarray processing is the intensity extraction step. Expressions of gene values can be calculated based on red and green foreground intensity pairs and background intensities.
In this paper we are going to propose a new method by combining any of the clustering algorithms with Bi-Dimensional Empirical Mode Decomposition (BEMD) for segmentation of microarray images. Based on capability and simplicity of clustering algorithms we propose the Adaptive fuzzy moving k-means for de noising the microarray image and we combined adaptive fuzzy k-means with BEMD. The paper is organized as follows: Section II presents Bi-dimensional Empirical Mode Decomposition, Section III presents, Clustering Algorithm, Section IV presents Experimental results, and finally Section V reports conclusion.
II. B
I-D
IMENSIONALE
MPIRICALM
ODED
ECOMPOSITIONCopyright © 2013 IJECCE, All right reserved mode decomposition.Usually EMD method to decompose
a signal into so-called intrinsic mode function (IMF). In this method, we decompose images, rather than signals, from different imaging modalities into their IMFs. Most of image IMFs are considered as noise. If we remove noisy IMFs from the image data, the trend component can be obtained. Then we can use the trend as the de noised data to perform clustering analysis. In this paper we de-noise the microarray image using BEMD and segment the image with Adaptive Fuzzy moving K-Means clustering algorithm.
The IMF Function hence has the following properties: 1. The whole length of a single IMF, the number of
maximum and minimum values and the number of zero-crossings must either be equal or differ at most by one (although these numbers could be differing significantly for the original data set);
2. At any data location, the mean value of the envelope defined by the local maxima and the envelope defined by the local minima is zero.
The term "decomposition" formally means the breaking down of a compound process into individual constituent components the decomposition method in EMD is called Shifting Process. The shifting is an iterative process of the two- dimensional signal such as image can be adapted from the one dimensional signal which can be summarized as follows:
1. Fix I (image to be decomposed) j=1(index of IMF) 2. For the image I find out the extreme values.
3. Create upper envelope EUp of local maxima and the
lower envelope Elw of local minimum, by using
interpolation technique. 4. Compute the envelope means;
Mean= [eup+elw]/2
5. Calculate Image Intrinsic Mode functions: Iimf= I- Mean.
6. Repeat steps 2-5 until Image Intrinsic mode functions can be considered
As an Intrinsic Mode Function IMF=Iimf
7. Recomputed Image Intrinsic values until jthIMF IMF (j) = Iimf, j=j+1, I = I- Iimf,
8. Repeat steps 2-7 until the entire standard deviation of two consecutive IMFs is less than a predefined threshold.
The few IMFs obtained from BEMD contain the noisy image. The original image can be recovered by inverse:
( )
j
IRES
IMF j (1)An alternative algorithm for EMD process proposed by Lin et al is iterative filtering. In this new algorithm, instead of using envelopes Lin uses a Moving average to replace the mean of the envelopes, But Shifting algorithm remains constant. We use low pass filter to generate moving average. We then use the adaptive local weighted average filter.
Given by ( , ) ( , ) ( , )
a b
i a j b
L x y w i j I x i y j
Where w(i,j) is called the mask of filter coefficient at (i,j).we select the mask
Where i=-
a……..a and j=
-
b……..b
The shifting is an iterative process of the two-dimensional signal such as image can be adapted from the one dimensional signal which can be summarized as follows:
1. Fix I (image to be decomposed) j=1(index of IMF) 2. L (I) represents the moving average of I where L be the
low pass filter
3. Now calculate Image Intrinsic Mode functions: Iimf= I–L(I) .
4. Repeat steps 2-3until Image Intrinsic mode functions can be considered as an Intrinsic Mode Function
IMF=Iimf
5. Recomputed Image Intrinsic values until jthIMF IMF (j) = Iimf, j=j+1, I = I- Iimf,
6. Repeat steps 2-5 until IMF has at most one local maximum or local minimum.
The original image can be recovered by inverse as follows:
( ) j
IRES
IMF j (2)III. C
LUSTERINGA
LGORITHMSClustering based algorithms, k-means, fuzzy c-means and weighted fuzzy c-means was implemented as follows;
1. K-Means Clustering Algorithm:
K-means is one of the efficient method in clustering introduced by Hartigan in 1979 [6]. This method is applied to segment the microarray image in recent years. The main idea behind the k-means clustering algorithm is to group the pixels into clusters. Data which belongs to a definite cluster could not be included in another cluster. The objective is to minimize the sum of squares of the distances between the clusters. However, for segmenting the microarray image using k-means clustering algorithm is described as follows:
Algorithm K-means(x,n,c)
Experimental Input:
N: number of pixels to be clustered;
x={x1,x2,x3,……,xN}: pixels of microarray image
c ={c1,c2,c3,….,cj} : clusters respectively. Here we group
the pixels into two clusters, foreground and background, j=2.
Simulated Output: cl: cluster of pixels Begin
Step 1: cluster centroids are initialized.
Step 2: compute the closest cluster for each pixel and classify it to that cluster.
∆ij= || xi-cj||. arg min
1 1
N C
i j
∆ij2 (3)Step 3: New centroids of a cluster is calculated by the following
cj=
xiwhere xibelongs to cj. (4)Copyright © 2013 IJECCE, All right reserved End.
Fig.2. Flow Chart for K-means clustering Algorithm
The K-means clustering algorithm has some of the weaknesses which are as follows:
1) Before the execution of the algorithm. We have to define the number of clusters K.
2) The K-means algorithm is sensitive to initial conditions.
3) The K-means algorithm may be trapped in the local optimum.
4) The K-means algorithm may put the centers may pull the centers away from the optimum location, leading to poor representation of data.
2. Fuzzy C-Means Clustering Algorithm:
In dealing with data containing uncertainty, the Fuzzy theory as been recently used. However for analysis of DNA microarrays fuzzy clustering approaches as been taken. Fuzzy c-means is a basic Fuzzy clustering method originally introduced by Bezdek in 1981 c-means means method aims each pixel may belong to more than one cluster. So the goal is to find the membership values of pixels belonging to each cluster. The fuzzy c-means algorithm is an iterative optimization that minimizes the cost function. However, for segmenting the microarray image using Fuzzy C-means clustering algorithm is described as follows:
Algorithm Fuzzy C-Means(x,n,c,m)
Experimental Input:
N=number of pixels to be clustered;
x = {x1, x2,..., xN}: pixels of microarray image;
c=2: foreground and background clusters; m=2: the fuzziness parameter;
Simulated Output:
u: membership values of pixels and segmented Image Begin
Step_1: Initialize the membership matrix uijis a value in
(0,1) and the fuzziness parameter m (m=2).
c
j 1
uij=1 (5) for all i= 1,2,…….N, where c is the number of clusters and N is the number of pixels in microarray image.
Step_2: Compute the Centroid values for each cluster cj.
F=
c
i N
j 1 1 uij
m
|| xj-ci|| 2
(6)
where uijrepresents the membership of pixel xjin the ith
cluster and m is the fuzziness parameter.
Step_3: Compute the updated membership values uij
belonging to clusters for each pixel and cluster centroids according to the given formula.
1 2
1
1
1
1
, and N
m ij j j
ij i N
m m
c ij
j i
j
k j k
u x
u v
u
x v
x v
(7)
Step_4: Repeat steps 2-3 until the cost function is minimized.
End.
The Fuzzy C-means clustering algorithm has some of the weaknesses which are as follows:
1) Assign randomly to each point coefficients for being in the clusters.
2) However, Fuzzy C-means algorithm is unsuitable for the images corrupted by impulse noises such as salt and pepper noise.
Fig.3. Flow Chart for Fuzzy c-means clustering Algorithm
3. Weighted Fuzzy C-means Clustering Algorithm
Even though the FCM algorithm yields good results for segmenting noise free images, it fails to segment images corrupted by noise, outliers and other imaging artifact. We call this method as Weighted Fuzzy C-means Algorithm (WFCM) which is based on adding the weight components to the centroid value. In the proposed method before the clustering process we aim to identify the less important data point by using the potential measurement, not during the convergence process of clustering. However for segmenting the microarray image using the Weighted Fuzzy C-means Algorithm is summarized as follows;
Algorithm Weighted Fuzzy C-Means(x,n,c,m)
Experimental Input:
N=number of pixels to be clustered;
Copyright © 2013 IJECCE, All right reserved c=2: foreground and background clusters;
m=2: the fuzziness parameter;
Simulated Output:
u: membership values of pixels and segmented Image Begin
Step_1: Initialize the membership matrix uijis a value in
(0,1) and the fuzziness parameter m (m=2).
c
j 1
uij=1 (8) for all i= 1,2,…….N, where c is the number of clusters and N is the number of pixels in microarray image. Step_2: Compute the Centroid values for each cluster cj.
21 1
1
,
exp c n
m
m k ik k i
i k
n
k y k
y
J U V W u x v x x
W
STD
(9) Where Wk is the weight measurement for which STD is standard deviation of input data.
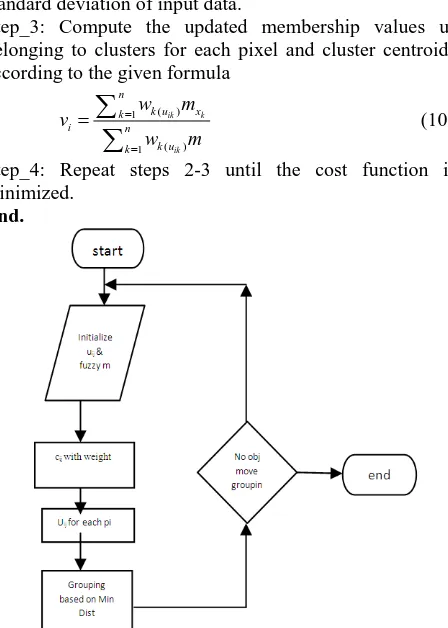
Step_3: Compute the updated membership values uij
belonging to clusters for each pixel and cluster centroids according to the given formula
( ) 1
( ) 1
ik k
ik n
k u x k
i n
k u k
w m v
w m
(10)Step_4: Repeat steps 2-3 until the cost function is minimized.
End.
Fig.4. Flow Chart for Weighted FCM clustering Algorithm
IV. E
XPERIMENTALR
ESULTSIn this article we proposed WFCMBEMD method of the microarray image processing are performed on a sample microarray slide that has 48 blocks, each block consisting of 110 spots. A sample block has been chosen and 36 spots of the block have been cropped for simplicity. The sample image is a 198*196 pixel gray scale image that consists of a total of 38808pixels to check the efficiency of
the Gaussian noise is added into the microarray image to check the efficiency of the micro array image. By using iterative filtering algorithm with EMD we can filter the noisy microarray images. After de noising, in the 7th IMF, we obtain the smooth image, which we used as a de noised microarray image for analysis purpose .For segmentation of filtered and noisy microarray image we use WFCM Algorithm. The entire process of Weighted Fuzzy C-Means Algorithm with Bi-Dimensional Empirical Mode Decomposition (WFCMBEMDA) is described in following figure:
Fig-5: process of Weighted Fuzzy C-Means Algorithm with Bi-Dimensional Empirical Mode Decomposition.
Table 1: The number of pixels clustered as spots and background
Method Spots Background
Original Image segmented by Weighted Fuzzy
C-means
13986 24822
Noisy Image segmented by Proposed method
12774 25034
V. C
ONCLUSIONSCopyright © 2013 IJECCE, All right reserved
A
CKNOWLEDGMENTThe research work has been done under the guidance of J.HARI KIRAN member of IEEE and assist professor of Gitam University Vishakhapatnam our vote of thanks to him and Dr.P.V.Lakshmi HOD of theDepartmentIT.GIT, GU, Vishakhapatanam, INDIA.
R
EFERENCES[1] M.Schena, D.Shalon, Ronald W.davis and PatrickO.Brown,“Quantitative Monitoring of geneexpression patterns with a complementary DNAmicroarray”, Science, 270,199,pp:467-470.
[2] Wei-Bang Chen, Chengcui Zhang and WenLinLiu, “An Automated Gridding and Segmentationmethod for cDNA Microarray Image Analysis”,19th IEEE Symposium on Computer-Based Medical Systems.
[3] Tsung-Han Tsai Chein-Po Yang, WeiChiTsai, PinHuaChen,“ErrorReductiononAutomaticSegmentation in Microarray Image”, IEEE 2007.
[4] Eleni Zacharia and Dimitirs Maroulis,“Microarray Image Analysis based on anEvolutionary Approach” 2008 IEEE. [5] N.E.Huang, Z.Shen, S.R.Long, “The empiricalmode
decomposition and the Hilbert Spectrumfor linear and non-stationary time seriesanalysis”. Proc. Roy. Soc, London.A, Vol.454,pp.903-995, 1998.
[6] Volkan Uslan, Omur Bucak, “ clustering basedspot segmentation of microarray cDNAMicroarray Images “, International Conferenceof the IEE EMBS , 2010.
[7] Jin Hyuk Kim, Hye Youns Kim and Yong SungLee, “ A novel method using edge detection forsignal extraction from cDNA microarray imageanalysis”, Experimental and Molecular Medicine, Vol 33, No.2, 83-88, June 2001.
[8] L. Lin, Y.Wang and H.Zhou, Iterative filtering asan alternative for empirical mode decomposition.Advances in Adaptive Data Analysis. 1(4): 543-560, 2009.
[9] R.Hirata, J.Barrera, R.F.Hashinoto andD.o.Dantas, “ Microarray gridding bymathematical morphology”, in Proceedings of14th Brazilian Symposium on ComputerGraphics and Image Processing, 2001, pp: 112-119.
[10] International Journal of Electronics Communication and Computer EngineeringVolume 3, Issue 6,- “Denoising Based Clustering Algorithm for Segmentationof Microarray Image” [11] IJCSI International Journal of Computer Science Issues, Vol. 9,
Issue 5, No 3, September 2012.“Fuzzy C-means with Bi-dimensionalEmpirical ModeDecomposition for Segmentation of Microarray Image”.
[12] 32nd Annual International Conference of the IEEE EMBS Buenos Aires, Argentina, August 31 September 4, 2010. Clustering-based Spot Segmentation of cDNA Microarray Images”
[13] 2010 IEEE International Conference on Bioinformatics and BiomedicineFuzzy C-means method with empirical mode decomposition for clustering microarray data
[14] Journal of Computing, Volume 4, Issue 11, November 2012, ISSN (Online) 2151-9617 https://sites.google.com/site/ journalof computing. www.journalofcomputing.org” Denoising based Clustering Algorithm for Classification of Remote Sensing Image.
A
UTHOR’
SP
ROFILELakshmana Phaneendra Maguluri
has obtained his bachelor’s degree from Gudlavalleru Engineering Collage Under JNTU-K in Computer Science and Technology in 2011 and Currently doing his M.Tech(Information Technology) In GITAM Institute Of Technology, GU, AP, INDIA.
Sandeepraja Batchu
has obtained his bachelor’s degree from Adithya Engineering Collage Under JNTU-K in ECE 2011 and Currently doing his M.Tech-IT GIT in, GU, AP, INDIA.
Eswar Patnala
has obtained his bachelor’s degree from Kaushik Engineering Collage under JNTU-K in Information Technology in 2011 and Currently doing his M.Tech-IT in GIT, GU, AP, INDIA.
Original Noisy Microarray image
IMF 1
IMF5 IMF 7
Segmented Using Weighted Fuzzy C-means
Algorithm (for IMF7)
Segmentation using Weighted Fuzzy C-means
on Noisy image