Doctor of Education (EdD) Theses and Dissertations
1-1-2015
Perception of Educational Equity and School
Climate: A Case Study
Elisabeth Ferreira D'Azevedo George Fox University
This research is a product of the Doctor of Education (EdD) program at George Fox University.Find out moreabout the program.
This Dissertation is brought to you for free and open access by the Theses and Dissertations at Digital Commons @ George Fox University. It has been accepted for inclusion in Doctor of Education (EdD) by an authorized administrator of Digital Commons @ George Fox University. For more information, please [email protected].
Recommended Citation
Ferreira D'Azevedo, Elisabeth, "Perception of Educational Equity and School Climate: A Case Study" (2015).Doctor of Education (EdD).Paper 60.
by
ELISABETH FERREIRA D’ AZEVEDO
FACULTY RESEARCH COMMITTEE:
Committee Chair: Gary Tiffin, Ph.D. Associate Professor of Education Committee Member: Suzanne Harrison, Ph.D. Assistant Professor of Education
Committee Member: Kathleen Gathercoal, Ph.D. Professor of Psychology
Presented to
Educational Foundations and Leaderships Graduate Department School of Education, George Fox University
In partial fulfillment of the requirements for the degree of Doctor of Education
"PERCEPTION OF EDU CA TI ON AL EQUITY AND SCHOOL CLIMATE: A CASE STUDY," a Doctoral research project prepared by ELISABETH FERREIRA D'AZEVEDO in partial fulfillment of the requirements for the Doctor of Education degree in the Educational Foundations and Leadership Depm1ment.
This dissertation has been approved and accepted by:
Date
I /
Date
T l
Date
Sue Harrison, PhD
Kathleen Gathercoal, PhD
Committee Chair
Associate Professor of Education
Assistant Professor of Education
ABSTRACT
Although educational equity and school climate are considered critical factors to ensuring the success of every student in the 21st century (Darling-Hammond, 2010; Mitchell, Bradshaw, & Leaf, 2010; Skrla, McKenzie, & Scheurich, 2009), limited research has explored the relationship and strength of association between indicators of educational equity and school climate.
This work is dedicated to our children - Neuza, Luke, Tatiana, Sonia, Joao, Samantha,
ACKNOWLEDGMENTS
TABLE OF CONTENTS TABLE OF CONTENTS
ABSTRACT ... II
ACKNOWLEDGMENTS ... IV
CHAPTER 1 ... 1
INTRODUCTION ... 1
Statement of the Problem ... 3
Research Questions ... 4
Limitations and Delimitations ... 5
Background ... 6
Definition of Terms ... 10
CHAPTER 2 ... 12
REVIEWOFTHELITERATURE ... 12
Introduction ... 12
Race and Ethnicity in Education ... 14
Racial/Ethnic Pedagogy ... 17
Policy Mandates ... 19
Educational Equity and Equality ... 22
School Climate and Equity ... 26
Data-Driven Strategic School Improvement ... 28
CHAPTER 3 ... 31
METHODOLOGY ... 31
Setting and Participants ... 31
Research Design and Nature of Data Set ... 32
Operationalization of Variables ... 33
Procedures ... 35
Research Ethics ... 35
Role of the Researcher ... 36
Potential Contributions of the Research ... 36
CHAPTER 4 ... 37
RESULTS ... 37
Introduction ... 37
Fisher’s Procedure ... 38
Cleaning the Data ... 38
Findings ... 41
MANOVA: Initial Exploration and Results ... 41
ANOVA: Additional Exploration and Results ... 44
ANOVA: Additional Exploration and Results ... 46
Correlations: Additional Exploration and Results ... 50
Summary ... 52
CHAPTER 5 ... 53
DISCUSSIONANDCONCLUSIONS ... 53
Introduction ... 53
Discussion ... 53
Recommendations for Future Research ... 59
REFERENCES ... 60
APPENDICES ... 70
Appendix A ... 70
Appendix B ... 71
Appendix C ... 74
Appendix D ... 78
Appendix E ... 80
Appendix F ... 82
Appendix G ... 85
TABLES
Table 1. School 5-Item Equity Index (DEI)………..34
Table 2. School 25-Item Equity Index (SEI)………...……….34
Table 3. School and Race Identifier Cross Tabulation for Students……….38
Table 4. Final Analysis – Posthoc ANOVA Demographics……….39
Table 5. Missing Data for each District Equity Index and School Equity Index Scale Item..…. 40
Table 6. Posthoc ANOVA: Equity as a Function of Race/Ethnicity……….…………..42
Table 7. MANOVA Summary Table………..………..43
Table 8. Dependent Variable Test Effects Between Subjects on 25-Item SEI……….44
Table 9. Dependent Variable Test Effects Between Subjects on 5-Item DEI…………..………45
Table 10. ANOVA - Effect of Race on 5-Item Equity Scores for each of the Six Schools….….48 Table 11. ANOVA - Effect of Year on 5-Item Equity Scores for Each of the Six Schools……..49
Table 12. ANOVA - Effect of Year on 25-Item Equity Scores for Each of the Six Schools……49
FIGURES
CHAPTER 1
INTRODUCTION
In today’s global world, which places the rate of change and global interconnectedness at the center of culturally relevant teaching and learning, multicultural competence is identified as the ‘defining’ element in education, research, training, and professional development (Lim & Renshaw, 2001). The rapidly changing demographics of the U.S. population has obliged change throughout institutions nationwide as reflected in the population changes in the educational system (U.S. Census Bureau, 2000). It is estimated that by the year 2020, over half of the U.S. K-12 student population will be students of color (Gollnick & Chinn, 2012). Access to globally stored information has steadily increased at a rate of 23% yearly over the past twenty years (Hilbert & Lopez, 2011). Furthermore, the past decade has seen the world make a fundamental transition from an industrial to knowledge-based society. The implications of such rapid change impact every aspect of society, at the core of which lies our educational system. In the new global economy, the phenomenon of change and diversity faced by educational institutions demands an international perspective and intercultural competencies as the foundation needed to allow individuals to function effectively in ever increasing pluralistic societies be it on the national or international level (Ford & Whiting, 2008; Gurin, Hurtado, & Gurin, 2002). Within the U.S. alone, demographic change is occurring at a pace that demands the transformation of the current educational system. As a result, one of the most controversial public policy issues for school districts and educators is the issue of educational equity.
data indicating that culturally diverse students attending the public school systems in the U.S. are rapidly nearing 50% of existing populations, guaranteeing that every educator will encounter a culturally and linguistically diverse student in his or her individual classroom experience. In order to ensure equitable school climates it is both a demographic and a moral imperative to address these changes (Ford et al., 2008; Menken & Antunez, 2001; Ross, 2013). Public schools, in particular, are being pressured to both close the education gap and ensure that minority children and those in poverty are served equitably and provided an education which will ensure their success as contributing citizens of a growing global society. Schools failing in this mission are at risk of losing funding and being closed. Ensuring equity is now recognized as one of the most significant challenges for educational leaders, classroom educators, and policy makers (Darling-Hammond, 2010; Duncan, 2010; Ford .al, 2008; Menken et al., 2001; Nelson, Bridges, Morelon-Quanioo, & Williams, 2007; Ross, 2013).
to opportunity—it is a prerequisite to success…economic progress and educational achievement
are inextricably linked, educating every American student to graduate from high school prepared
for college and for a career is a national imperative” (The White House, 2013). The U.S.
commitment to equity is the major determinant of the country’s future (Darling-Hammond, 2010; Ford et al., 2008; Tatum, 2007; The White House, 2013).
Statement of the Problem
Educational equity is a systemic effort that encourages teachers, schools, and communities to work together to simultaneously improve student achievement, teacher
development, community partnerships, and the future success of all students. Despite persistent educational reform movements, the inequalities, social justice issues, and inconsistent access to resources continue to affect educational institutions worldwide (Martinez & Kirkwood-Tucker, 2011; Sue et al., 2007). In this light, educational literature has documented four key areas that impact students’ perception of their school experience to include historical legacy, structural diversity, behavioral climate, and the psychological climate. However, policies and
accountability that address all these dimensions in the prevailing paradigm do not support systemic change. Systems that manage the learning mission within schools are almost non-existent (Darling-Hammond, 2010; Ford et al., 2012; Lezotte, 1996; NSCC, 2012).
Although the literature in the areas of school climate and educational equity has grown extensively, studies focusing on student and staff perception of equity practices within schools are lacking (Mitchell, Bradshaw, & Leaf, 2010). To our knowledge, there has been little documentation about school level factors that directly affect systemic change in purposeful and sustained efforts to move towards a fully equitable system (Armstrong & Anthes, 2001;
Therefore, the purpose of this study was to examine perceptions of equity in the school climate of a large urban public school district. A district was identified that actively collected perception data looking at the attitudes of students and staff over a 10-year span in a proactive stance
towards continuous school improvement. This study used archived data to compare students and staff perceptions at the middle school level over five of those years. The use of data for
decision-making is a best practice in continuous school improvement (Todd, Lewis-Palmer, Horner, Sugai, Sampson, & Phillips, 2003). Although research has been increasingly carried out on the relationships between race, educational equality, equity, student achievement, and school climate, no single study exists which adequately covers the perceptions of equity within the school experience (Bernhardt, 2004; Darling-Hammond, 2010; Gangi, 2009; Lezotte, 1996). Research Questions
This research examined the emerging role of equity in the K-12 school context. Taking into consideration the purpose of this quantitative study the central question examined was: Do middle school students and teachers of different races in the district perceive equity in school climate differently? The comparison of district schools was completed through the
disaggregation of demographic subgroups in an attempt to determine the influence of race/ethnicity, school, and year on perception of equity and school climate.
Based on the background of the District, evidence supported in literature, and premises of recent equity scholarship, the following hypotheses are tested:
H1: Results for students self-identifying as Black/African American and Hispanic
Race/Ethnicity will show significantly lower results than students of White or Asian races.
H3: Teacher perception results will show higher scores than student perception results.
H4: Results for the District Equity Index and School Equity Index will be consistent
across independent variables. Limitations and Delimitations
The reader should bear in mind that case studies are limited in scope and thus
generalizations to larger populations cannot be made. However, as the researcher it was my hope to present theoretical supposition(s) identified in this case study in order to further
encourage investigative studies on the topic at hand. The study was delimited to the collection of data in one urban school district in California over a five school-year period from the spring of 2009 to the spring of 2013. The researcher took into consideration the delimitations inherent to the use of existing data as a research design including the absence of control in types of data collected which may have directly or indirectly affected this study and the type of data collection model used.
One of the main limitations encountered was the nature of the survey instrument itself including self-reported data and response rate. In addition, research states that effective questionnaires, although using items and questions to assess the same content, can become invalid when posing questions that seek second-hand information (Bernhardt, 2004). The
Background
In 1995, the District, a large, K-12 urban school district began working in a collaborative educational partnership with Education for the Future (EFF), a non-profit organization specializing in systemic change and comprehensive data-driven continuous school improvement. The
identified school district partnered with EFF over the past nine years, having utilized EFF perception surveys as part of their continuous school improvement efforts.
The original student and staff perception surveys that gathered the data used in this research were designed in 1991 by EFF. EFF is dedicated to helping schools stay focused on systemic improvement through the use of strategic data analysis including multiple measures (demographic, perception, student learning, and school processes) of data and predictive analysis. The response set included a five-point Likert-scale: 1-Strongly Disagree, 2-Disagree, 3- Neutral, 4-Agree, 5-Strongly Agree. Validity content was ensured during the development process and all items are based in best practice research literature and interviews with students and teachers nationally. For the first three years running, over 10,000 students were surveyed using questionnaires for grades K – 12 twice a year, in October and April in order to identify systemic change through changes in student perception. The reliability for each scale reflects the degree to which the items in a scale are internally consistent and the degree to which they tend to correlate with each other better than with other items on the survey. The reliability quotients are estimated at .93 for the student elementary questionnaires, and .86 for the staff questionnaires (AIRS, 2007; Bernhardt, 2004; Bernhardt et al., 2009).
District Background
eight high schools serving over 33,000 pre K-12th grade students (Education Data Partnership, 2013). Two of the elementary schools serve students through the eighth grade.
The District has a student population made up of 52% Hispanic, 28% White, and 13% Asian and 7% Other. In accordance with state trends, female students out number male students 60% and 40%. 44.8% of students’ district-wide qualify for Free/Reduced lunch. 23.6% are English Language Learner (ELL) of which 20.2% speak Spanish as their primary language (District, 2008).
In 1992, the District engaged in a successful five-year national equity initiative demonstrating that all students in their district could successfully complete algebra and
geometry, eliminating this barrier to college entrance (Murray, 2012). In 1998, the District made public their first Strategic Plan that directly addressed their commitment to two crucial topics: the use of predictive analytics to guide strategic institutional change and quality management; and the implementation of a district-wide equity policy. From 1999 to 2009 the achievement gap between the two dominant demographic populations, White and Hispanic, decreased by 36%. According to the Landsberg and Blume (2008), Hispanic students in the District are more than twice as likely to graduate high school compared to all other California districts. In addition, their dropout rate, at 14% is more than 10 points lower than the statewide figure and 15 points lower than L.A. Unified numbers. The District maintained the second highest graduation rate as an urban district in the U.S. several years running and has continued to make huge strides (District, 2012).
recognize the importance of social justice in education and include this in their Strategic Plan that focuses on equity and the highlights the challenges faced within their communities. This district acknowledges equity as critical to serving students and achieving their mission to prepare all students for the opportunities and reality of the 21st century (District, 2010; District, 2012). Their Board Equity Policy demonstrates the districts understanding of and commitment to educational equity,
…certain groups in our society have not demonstrated academic success equitably. Systemic inequities…are essential causes of low academic achievement…such inequities leads to educational, social, and career outcomes that do not accurately reflect the
abilities…of students...Such inequitable treatment limits future success and prevents individuals from making a full contribution to society. (District, 2010)
The Board is, therefore, committed to ensuring that equity and inclusion are essential principles of this school system and are integrated into all policies, programs, operations, and practices. District Data Profile
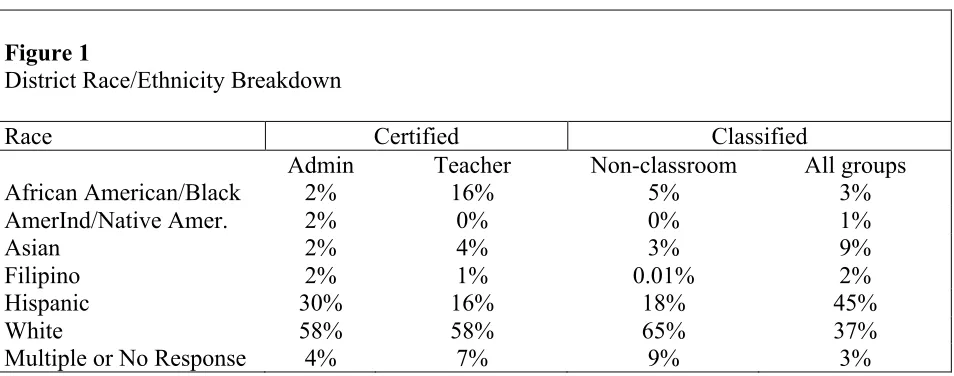
disadvantaged).” Per Figure 1 (Eureka Award Application, 2008. p. xx), the District employs over 2000 staff including 1500 teachers with the following ethnic breakdown:
Figure 1
District Race/Ethnicity Breakdown
Race Certified Classified
African American/Black
Admin 2%
Teacher 16%
Non-classroom 5%
All groups 3%
AmerInd/Native Amer. 2% 0% 0% 1%
Asian 2% 4% 3% 9%
Filipino 2% 1% 0.01% 2%
Hispanic 30% 16% 18% 45%
White 58% 58% 65% 37%
Multiple or No Response 4% 7% 9% 3%
With a history of innovation and leadership, the District was the first district in California to raise graduation requirements and to publically recognize and combat systemic inequities that could prevent students from attaining the ability to be fully participating members of the
communities in which they live. In California, in addition to many other states, legislation is continuing to be passed requiring the inclusion of cultural competence within the educational context (O’Hara & Pritchard, 2008). The purpose of the District partnership with EFF, and the district-wide implementation of the program based in predictive analytics was aimed at ensuring the eradication and prevention of all forms of discrimination, consistent policy and practice of embracing the broad range of culturally diverse backgrounds in order to maximize educational opportunities for all district students, and the pursuit of best practices in the effort to improve overall student achievement (District, 2010).
Future, modified the original EFF perception questionnaires as part of their continuous school improvement efforts.
Definition of Terms
Equal Access. Equal access ensures that all children, no matter their socio-economic group, have accessto the school system (Education Northwest, 2013).
Equal Education Opportunity. Equal educational opportunity as a term is synonymous to educational equality, seeking to ensure the equality of provision of the same resources and treatment for each student (Bitters, 1997; Education Northwest, 2013).
Educational Equity. Educational equity includes both fair and inclusive education as defining elements. Fairness ensures that neither personal nor social circumstances will inhibit the attainment of a student’s academic potential. Inclusion guarantees a minimum standard of education for each and every student (Bitters, 1997; Field, Kuczera, & Pont, 2007).
Equity Consciousness. Across varying fields of scholarship equity consciousness refers to an individual’s awareness of levels of equity and inequity existent in all aspects of an
organization (Skrla, McKenzie, & Scheurich, 2009).
Ethnicity. Ethnicity refers to social groups of people who define themselves as culturally different based on a common history and ancestry. They identify themselves by cultural heritage, shared history, shared identity, and cultural roots (Baumann, 2004; Wallman, Evinger, & Schechter, 2000).
Inclusion. Inclusion in school climate rests on values and best practice that both expects and ensures that all students reach their full potential (Coulston & Smith, 2013).
Race. Race is an arbitrary concept with biological and social definitions used to describe and differentiate groups of people (Bitters, 1997).
Racial Stratification/Racism. Racism is beliefs and practices seen in actions, attitudes or institutional structures that place one group as inferior and/or subordinate to another based on skin color. In the United States, black Americans are socially stratified at birth based on their skin color. This classification lasts their lifetime. Racial stratification serves to separate, rank, and justify dominance of a certain social group (Bitters, 1997; Ogbu, 1994).
School Climate. For the purpose of this study we will adhere to the definition provided recently by the National School Climate Center (2012) who focus on the interpersonal
relationships, organizational structures, and teaching and learning practices within a school that directly affect people’s experiences of school life.
Systemic Equity. Systemic equity refers to the transformation of systems to ensure all students the best environments and opportunities for learning. Such systems provide the
CHAPTER 2
REVIEW OF THE LITERATURE
Introduction
The legacy of racism and how it has shaped the educational system are complex. Between 1972 and 2004 the number of immigrant and non-immigrant minorities present in the U.S. educational system doubled. In 2004, two in every five students were Black, Hispanic, Asian, or American Indian (Awokoya & Clark, 2008). The divide in diversity between educators and student populations is widening as the current teacher workforce and teacher educator
programs continue predominantly white, middleclass, monolingual, and female.
The current state of racial equality in education continues to be controversial. Although there exist honest attempts at system reform, the issues of integrated education, funding, and equitable education seem an ever-present paradox that the U.S. has yet to resolve. This cumulative effect can take generations to turn around in terms of socioeconomic inequalities alone. While researchers work to identify factors inherent in a positive climate of racial diversity, racism continues to be one of the most divisive forces in U.S. society.
A number of authors (Ford et al., 2012; Gurin et al., 2002; Irons, 2002; Race Advisory Board, 1998; Warren, 2005) have reported that societal and racial inequities are deeply ingrained and nearly invisible, current policies and practices continue to create disparities between
equity, and student academic performance (Armstrong et al., 2001; Bennet, 1998; Darling-Hammond, 2010; Ford et al., 2009; Gordon, 1990; Klem et al., 2004).
The large body of research emphasizes a clear relationship between teacher expectations for students, and student race and ethnicity. Teacher expectations have been consistently found to be higher for White and Asian students than for African American or Hispanic students (Rubie-Davies, 2008). A more recent survey completed by MetLife (MetLife, 2009, p.3) supported literature in outlining the importance of high expectations on the part of teachers. According to this study, 86% of teachers and 89% of principals agreed that setting high
expectations directly impacted student achievement. However, the same study also found that a mere 36% of teachers and 51% of principals actually believe students had the ability for
academic success. Furthermore, research has shown that teachers believe students of Hispanic and African American heritage are less capable academically (Diamond, Randolph, & Spillane, 2004).
According to the 10 Regional Equity Assistant Center research (EAC, 2014), as the rigor of academic standards increase, ensuring focus on educational equity is critical. Without
adequate support and training, the implementation of the Common Core will only sustain and even deepen inequities that have haunted American education. A report recently released by the Perception Institute (2014) frames the current culture of racial ambivalence facing the nation in their most recent report. In their in-depth analysis, they elude that
…most whites, believing themselves to be non-racist, reasonably conclude that race has diminished in significance…yet people of color – particularly black people – often have a significantly different perception of the degree to which race affects their lives and
Race and Ethnicity in Education
Race and ethnicity have been used synonymously in the literature. The initial categories were developed as a way to monitor equal access as regulated by federal and state law in the early 1970’s. As standards have become more clearly defined, both have evolved in definition. The concept of ethnicity, although less understood, provides more insight as it refers to an individual’s identification with a specific culture, attitudes, traditions, and even language (Wallman et al., 2000).
The role of education in the formation of American culture and society as regards the institution of slavery can be found at the interstices of race and learning (Ford et al., 2008; Franklin, 2002). Although contributions to the study of slavery have increased, uncertainty and disagreement still exist when looking at the relationship between slavery and education. Both King (1991) and Warren (2005) address this uncertainty focusing on the relationship between slavery functioning as an educational institution, whether education should be approached as more than schooling, and whether white privilege is an educational outcome of slavery. A number of researchers including Flagg (2005) and Ogbu (1987; 1994) have reported the ability to control the social construction of racial identity and the allocation of resources as two meta-privileges of whiteness. Meta-privilege, the invisibility or lack of awareness by whites that privilege exists, still plagues educational systems (Flagg, 2005).
U.S.-based racism has a well-documented negative impact on Black students academic experiences (Awakoya et al., 2008; Ogbu, 2004). Gordon (1990) found that although a
considerable amount of African-American discourse and research have been published, it has been marginalized and had little success in effecting discourse or change in prevailing
of the common core standards, the Equity Assistance Center (2014) provides a concise timeline of U.S. efforts to serve all students as seen Figure 2 below.
Figure 2
U.S. History of Legislation.
1954-1964 (first generation) – Litigation shaped civil rights, including education, starting with Brown vs. Board of Education of Topeka, Kansas.
1964-1983 (second generation) – Legislation redefined the civil rights landscape and education, starting with the passage of the Civil Rights Act of 1964.
1983-1990 (third generation) – State-driven reform efforts refocused the civil rights conversation on issues beyond access, starting with the report, A Nation at Risk: The Imperative for Educational Reform.
1990-2000 (fourth generation) – State and national government reform efforts focused on how public education should support excellence for all, starting with the 1994 National Governors Association meeting on education challenging the country to look forward to new century.
2001-2011 (fifth generation) – This generation was characterized by national discourse on educational and civil rights and by passage of the No Child Left Behind Act, which required public schools to be accountable for disaggregated student-achievement outcomes.
2012-present (sixth generation) – The current generation started with the Obama administration’s Blueprint for Reform, outlining the re-envisioned federal role in education, and with adoption of the Common Core. It is being shaped by a focus on increased curricular rigor, on ensuring that students graduate from high school ready for success in college or postsecondary job training, and on effective leadership and quality teaching to ensure that students are successful.
In her work on dysconscious racism, King (1991) specifically addresses findings identified in the literature providing three typical explanations for inequity including: a) the results of slavery and U.S. history; b) denial or lack of equal opportunity for African Americans; and c) racism and discrimination as a norm within the US societal framework. Over a decade later, Franklin (2002) joined the dialogue claiming that the reaction of the black
of equalization of funding for school systems that are predominantly Black; and the mobilization of the Black community as a whole has resulted in both academic failure and high dropout rates among African American students.
Figure 3
ACT Average Scores by Race/Ethnicity.
Ford et al. (2012) claim that White privilege continues to play the instrumental role in shaping access to meaningful learning for all students of color. While previous studies have provided comprehensive descriptions and analyses of accepted theories focused on the
educational experiences of Black students, existing theories and research are striving to ask the critical questions necessary to widen understanding of the issues surrounding their experiences. Racial/Ethnic Pedagogy
perception in schools, and the response and perceptions to the system. Obgu’s (1987) theoretical and historical approach was contrary to findings proposed by earlier educational research
paradigms indicating cultural deprivation as the basis for minority students’ failure in the U.S. educational system. The major tenets and typologies of Ogbu’s cultural-ecological theory is well documented and cited throughout literature. Ogbu’s framework (Foster, 2004) for a clearer analysis and understanding of the vast differences in academic performance and adjustment problems facing minorities used the following prerequisites as a basis for understanding: a) types of minority groups (autonomous, immigrant and involuntary minorities); b) types of cultural and language differences inherent in minority identity (primary or secondary); c) societal and school forces; and d) community forces (instrumental, symbolic and relational factors). Over the years, Ogbu (1983; 1987; 1990) has concluded that basic to improving school success and social adjustment is the recognition and removal of obstacles experienced by minority groups. According to Ogbu, (as cited in Erickson, 1987) culturally responsive pedagogy, although effective in many contexts, is not the complete solution, but rather a transformation of society in general is required. Ogbu’s (1994) claim remains constant in that he insists that race, not socio-economic level, is the main determinant of life success. Racial stratification creates barriers in the opportunity structure, which begins, in educational access and policies.
vision of culture; the requirement that teachers understand and are skilled in critical reflection; and finally a lack of consideration of the sociopolitical context in which culturally responsive teaching must occur. Poignantly phrased, Awakoya et al. (2008) poses the pivotal question of how many white, middle class, female educators are experienced, confident and capable of identifying these controversial issues of racism within racist institutions? This mirrors Erickson’s (1987) suggestions that educators must accept responsibility towards becoming conscious of and working towards changing practices, processes, and symbol systems in educational settings.
The need for further investigation of the role educators’ play when balancing effective teaching and students worldviews is supported throughout literature. This is further supported by Ladson-Billings (2008) in her review of the current state of educational inequity in the U.S., suggesting a change in discourse from the achievement gap to education debt through a focus on historical, economic, sociopolitical, and morality as four underlying variables. Donnor’s (2011) discussion reminds us that race, in addition to ethnicity, is essential as a diagnostic tool in the assessment and promotion of equity in educational institutions because it is not only historical, but also relational. Until we address the systemic issues, which both structure and reproduce inequality in our systems we will remain at an impasse.
Policy Mandates
Desegregation
As discussed earlier, the face of racism and systemic oppression left its marks on the educational system in the U.S. as desegregation brought with it huge barriers for African
attempts aimed at trying to correct ineffective and underlying systemic issues. In order to ensure equal access to educational inputs, racial desegregation seemed the answer to constitutional discrepancies. However, even years later Bell (1992) proposes that school desegregation was nothing more than a strategic foreign policy maneuver to support dominant class economic interests within governing institutions at the time. Although a popular symbolic move, it did not address the underlying systemic issues. This perspective is supported in a recent article by Donnor (2011) who presents a compelling argument in his review of a high Court decision on desegregation and inequality. His depiction of the reality of inequity in education faced by students of color as secured by the structural reality of institutions is repeated throughout literature.
Multicultural Education
The second phase of the civil rights movement, the implementation shifted from the legislated mandates of civil rights to the model of acceptance and appreciation known as multiculturalism or cultural diversity (White, 1994). Multicultural education is a national phenomenon regulated by the particular needs of individual countries. Noel (2008) clarifies that the term ‘multicultural education’, although historically a source of both confusion and
controversy, focused specifically on the creation of national policies intended to prepare students to live and function within multicultural societies. The underlying goal was to implement
Hill (2007) presents a coherent review of the relationship between multicultural and intercultural education, clarifying the changes in the multicultural educational movement within the U.S. In early 1900s the first U.S. national policy on multicultural education was established directed at the assimilation of immigrants into mainstream U.S. culture. Until the early 1960s and the civil rights era, multicultural education seemed to be unchallenged in both political and educational arenas. This focus changed overnight from the assimilation of immigrants to the social integration of marginalized or minority groups. Fox and Diaz-Greenberg (2006) describe the approach used to accomplish the overall goal as evolving through three distinct phases including assimilation, social integration, and more recently, pluralism. Although the original goal directed at empowering students with the knowledge and skills necessary to function in an increasingly diverse world remained consistent, the intent of this second wave of multicultural education consciousness was geared towards the restructuring of educational institutions.
On one hand, multicultural education is considered a venue to improve race relations, and many agree that cultural diversity is already acknowledged and embraced by U.S. society
(Aldridge et al., 2000; Bennett, 1998; Pattnaik, 2003). Aldridge et al. (2000) suggest that
multicultural education is divisive for the country, is an anti-western movement, is unnecessary in mono-cultural or bicultural communities, and finally that the majority of individuals identify with one single culture.
postmodern multiculturalism is united in the effort to “...eradicate and dismantle systems of oppression” (Weinschenk, 2008, p. 14). Critical multiculturalism, on the other hand, applies critical theory with the goals of identifying oppressed and marginalized groups and dismantling dominant systems of thought. Along similar lines, Pattnaik (2003) concludes that although the original context was intended as a philosophical guide to be used in developing programs and making curriculum decisions, these practices were ineffective in that they left out direct student involvement, self-analysis, and critical reflection.
Noted scholars throughout multicultural education research stress that in a nation as culturally diverse as the U.S., cultural consciousness and competence on the part of educators is critical. In 2005, an international education congressional resolution emphasized U.S. priority and efforts to reposition themselves as leaders on the world scene (Parker, 2003). Ford et al. (2008), noted scholars in the field of multicultural education, stress that in a nation as culturally diverse as the U.S., intercultural competence on the part of educators is critical. They view the role of multicultural education as a reform movement as pivotal in the fight for equality and social justice for youth. Until a paradigm shift occurs between modern and postmodern
multiculturalism, educators will continue to struggle with little success (Asher, 2005; Awakoya et al., 2008; Bennett, 1998; Ford et al., 2008; Pattnaik, 2003; Weinschenk, 2008).
Educational Equity and Equality
Educational inequality in the U.S. is well documented (as cited in Ladson-Billings, 2008; Irons, 2002; Tatum, 2005). Both Irons (2002) and Fields-Smith (2005) identify the post
desegregation era as a continuous struggle, revealing the increasing difficulty educational
decision, racism is a normalized part of daily life for people of color and continues to haunt the U.S. Cross-cultural competence continues to exist in the margins of the U.S. national educational system (Bennett, 1998; Colvin-Burque, Davis-Maye, & Zugazaga, 2007; Ford et al., 2012; Gurin et al., 2002; McDonough, 2008; Pattnaik, 2003).
Although the scholarship on educational equity has grown tremendously over the past twenty years, the relationship between equity, equality, and social justice continue to haunt collegial discussions. While researchers and laymen agree that equal educational opportunity should be an inherent ‘right’, they become divided when the discussion turns to definition, and meanings. Jencks (2008) finds both public policy and education arenas in agreement regarding the interchangeable use of the terms equity and equality, and suggests that both concepts continue to be surrounded by confusion and misunderstanding.
Espinoza (2007) clarifies the notions of equity and equality while encouraging colleagues to work towards a concise synthesis of research. He states that the concept of equality, as we know it today, grew out of the late 1700s contending sameness in treatment of all people as a fundamental right. Equal opportunity in education thereby ensures equality of resources and treatment for each student at the starting gate. According to Espinoza, the concept of equality should not include the expectation for identical outcomes, although equity in itself demands that different outcomes should never be a result of differing socio-economic power.
components.
The growing body of research has, however, begun to provide commonly agreed upon stages in the educational process. In his attempt to clarify the conceptual dilemma that exists between equality and equity, Espinoza (2007) outlines features including access, resources, survival, output, and outcomes. Although equal access ensures that all children, no matter their socio-economic group, have access to the school system, equal access in itself does not ensure either equality or equity. Particular attention should be devoted to the allocation of resources, systemic issues, and school processes and practices as the primary areas of focus when
investigating equity in the educational realm. In a position paper presented by the Equity Assistance Center Directors (2014, p. 4), they argue that unless the following six goals of educational equity are addressed in the implementation of Common Core standards, gaps in achievement among students of color will continue to widen. The goals include:
• Comparably high academic achievement and other positive outcomes for all students on
all achievement indicators
• Equitable access and inclusion
• Equitable treatment
• Equitable resource distribution • Equitable opportunity to learn
• Shared accountability
educational attainment. Skrla et al. (2009) work supports the urgency of embracing the concept of systemic equity, identifying the critical components of educational equity as:
… the educational policies, practices and programs necessary to (a) eliminate educational barriers based on gender, race/ethnicity, national origin, color, disability, age, or other protected group status; and (b) provide equal educational opportunities and ensure that historically underserved or underrepresented
populations meet the same rigorous standards for academic performance expected of all children and youth. (p. 10)
A number of researchers (Education Northwest, 2013; Espinoza, 2007; Field et al., 2007; Jencks, 1988; Secada et al., 1995; Secada, 1989) have reported that the key concepts to be considered in looking at equity are fairness and inclusion. Inclusion, in this study, refers to the minimum standard of education for all. Fairness implies that the educational success of each student should not be hindered by any demographic such as gender, race, ethnic origin, or socio-economic status. Uline and Tschannen-Moran (2008) indicate the need to focus on the
complicated and varying interplay between the physical and social environments of schools that directly influence individual student group outcomes. According to Diamond et al. (2004),
…teachers’ beliefs about students’ abilities to be highly academically successful tend to be unevenly distributed based on students’ race and family income status…this pattern is particularly troubling because teachers’ expectations are a more powerful influence on African American students than they are on whites. (p. 14)
systemic resolution are vast and far from resolved, based on this perspective the investigation and implementation of strategies towards positive school climates mirrors equity efforts. School Climate and Equity
Researchers have been studying school climate for decades. Although a large number of initial studies on school climate reform originated in the U.S., interest worldwide has rapidly increased and studies around the globe support the significant role school climate plays in the future success of all students. Extensive research has highlighted the core components of school climate (Hoy & Tartar, 1997; Hoy & Miskel, 2001; McIntyre, 2004). As defined earlier by the National School Climate Center (2012), school climate refers to the attitudes of staff and students toward their school experiences, patterns of school life, and reflects the norms and values held institution wide. Therefore, school climate refers to the overall culture of any educational institution comprised of forms of interaction between staff and students that demonstrate the underlying beliefs, attitudes, and values held.
In the 2012 School Climate Research Summary, Thapa, Cohen, and Alessandro (2012) discuss the power of school climates. Positive school climates clearly play a role in student self-esteem, overall emotional and mental health, enhanced motivation to learn, and reducing the negative influence socio-economic status can have on student achievement. Research also demonstrates a clear relationship between school climate, school connectedness, absenteeism, academic achievement, student behavior, and civic engagement. The quality and consistency of interactions in any school community plays a critical role in the social, cognitive, and
psychological development of all children. Thapa et al. (2012) also present a consolidated list of school climate measures including five key areas of focus; physical and emotional safety,
environment, and the processes of school improvement. Whereas these measures have been identified and supported in literature, the number of studies investigating school climate
measures is few and consensus lacking among scholars. More specifically, the lack of consensus among educational professionals in implementation strategies, measurements, and models for improvement demands rigorous and sound research.
Over the past decade the NSCC (2012) has focused on school climate reform in order to encourage the improvement of learning climates in schools through advocacy and policy,
measurement and research, and educational services that translate research into relevant practice. Their research overwhelmingly indicates that in order to build a positive social-emotional
climate within an entire school, it is necessary to actively involve all members. An earlier investigation completed by Stewart (2003) focused on school culture, the organizational structure, and social milieu as predominant elements of school climate. Within these three elements school culture represents unwritten beliefs and values and how they manifest
themselves in interactions between students and staff; the organizational structure representing class size and student teacher rations; and the social milieu spotlighting the attention to the relationships between student and staff demographics to also include teacher experience and training. Although Stewart’s research looks specifically at misbehavior and school climate, his findings highlight the importance of how culture plays into social milieu and interactions.
responsibility for learning lies with the staff; and that in order to eliminate the gap, educators must be willing to change traditional practices.
School climate is one of the most important tools of measurement when looking at equity. Organizations (NSCC, 2012) research findings on school climate issues and measures of proactive change determined vast discrepancies between existing empirical research on positive school climate, and measures of implementation seeking change within schools. In a study completed by Mitchell et al. (2010) comparing teacher and student perceptions of school climate, highlight the importance of assessing both teacher and student perceptions when looking at school and racial climate as a determinant of improved academic performance. Interestingly, they found that teachers focus on classroom-level factors (management, behavior), while students are sensitive to school-level factors (relationships, mobility).
Recently, there has been a surge in interest and research in the place of equity in school climate and system-wide factors. According to Cohen, Pickeral, and McCloskey (2009), this lacuna between school climate, research, policy, practice and teacher education is socially unjust and a violation of children’s human rights. In accordance with the latest report from the NSCC (Ross, 2013) reporting that school climate and equity are one and the same, the need to expand previous research by investigating indicators of equity within the school climate is timely. Data-Driven Strategic School Improvement
The use of questionnaires is an effective tool used to collect perceptions of survey groups that can provide invaluable information regarding attitudes, values and beliefs about all aspects of an educational environment. A valid questionnaire focused on school continuous
data, analysis of results, effective reporting of results, how and when to share results, and the use of results for continuous improvement (Bernhardt, 2004).
In order to ensure educational success for students of color and encourage systemic change, educators must confront institutional practices that impede equitable education for all students (Darling-Hammond, 2010; Lezotte, 1996; Martinez et al., 2011). According to Lezotte (1996), this is the most critical challenge for schools and districts. The literature supports including demographic data, perception data, and school process data as supporting best practice efforts. Perception and process data, in particular, inform decision making that leads to
improved school climate, equity, and student connectedness (Bernhardt & Geise, 2009; Ross, 2013).
In her work on strategic data driven systemic change and continuous school
improvement, Bernhardt (2004) discusses multiple measures of data that allow educators to predict how to best meet the learning needs of all students. In a recent study, the Center for Advancement of Racial and Ethnic Equity (2010) suggests that engagement in data-driven inquiry, promoting intensified awareness of racial and ethnic inequalities in individual schools, and the acceptance of personal and collective responsibility of educators for ensuring equitable education provides the missing framework needed. Although districts and individual schools have distinctly different cultures, each has similar data sets that can provide the ability to predict potential outcomes, thereby contributing to the ability to strategize for both prevention of failure and increased success among all student populations.
school climate includes major spheres of school life such as safety, relationships, teaching and
learning, and the environment as well as larger organizational patterns” (NSCC, 2012, p. 1). The
CHAPTER 3
METHODOLOGY
Introduction
The purpose of this quantitative study was to examine significant relationships in the perception of equity and school climate through the use of archived data from a questionnaire designed as part of a comprehensive school improvement process. This study used a MANOVA statistical analysis to explore whether middle school students and teachers perceive equity in school climate differently based on race, and to ascertain whether a relationship between
perceived equity and school climate exists. Additional analyses were completed using ANOVA and posthoc tests in order to further explore the correlations of each item with race, school and year. The researcher sought to document and hypothesize on the relationship between perceived equity, school climate, and race in a large urban school district located in California.
This study used two years of archived data from the District to compare student and staff perceptions of equity in school climate at the middle school level. The District, in partnership with Education for the Future (EFF), refined and utilized EFF perception surveys as part of their continuous school improvement efforts. The comparison of district schools disaggregated demographic subgroups including school, year, and race. Data collected included student and staff online surveys for the years of 2009 and 2013, and school demographic data.
Setting and Participants
School Climate Survey. This study used the spring data for the years of 2009 and 2013. Schools represented diversity in size, racial composition, and socio-economic status. Only staff and student participants who identified a single race were included in the final analysis.
Research Design and Nature of Data Set
This quantitative study examined whether a relationship between several variables existed. The units of analysis included staff and students at six middle schools in a large Californian urban school district. This study used appropriate statistical procedures to examine existing perception survey data. The middle school students completed the secondary school online questionnaire consisting of 47 statements eliciting their perception of the norms of school climate measures including a caring school climate, high expectations, equity, academic
engagement, connection, academic support, and future orientation. Staffs completed the staff climate online survey, which consisted of 71 statements. The final questions on the surveys asked for demographic data including; (a) gender, (b) race/ethnicity, (c) grade level. The student and staff perception questionnaires are included in Appendix B and C.
The researcher established a research based school equity index (SEI) of 25 selected questions (Appendix D) in order to allow a focused analysis of the relationship among the dependent variables. The Equity Index questions were selected based on the existing District climate survey (DEI) dimensions index (Appendix E), NSCC research on equity in school climate and the research reviewing question selection provided by EFF (Appendix F). In addition, an analysis and cross comparison of the questions identified by the District Climate Survey Dimension as measurements of equity in their district (See questions 1 – 5 in Appendix E) was completed.
which provides line graphs to note thematic joins between the questionnaire items and the disaggregation of key demographic subgroups tied back to school demographic data to note differences. In quantitative research, the researcher must isolate and identify variables and relate them causally to determine relationships (Huck, 2012). In order to present powerful and concise analyses and discussion, this study used a two by two Analysis of Variance (ANOVA) to identify interactions between the selected independent and dependent variables by exporting the data into Excel for investigation (Huck, 2012). The ANOVA design provides a solid design structure allowing for comparison across multiple variables. The two identified independent variables include the constituents (students and staff) and race/ethnicity (African American/Black, Hispanic, Asian, and White). The researcher will also adjust for other individual-level characteristics including school and year.
Operationalization of Variables
Independent Variables
Constituents – made up of district staff and students.
Race and Ethnicity – include the federally mandated reporting categories including African American/Black; White; Hispanic; Asian and Other.
Schools – made of up 6 district middle schools. Years – includes the years of 2009 to 2013. Dependent Variables
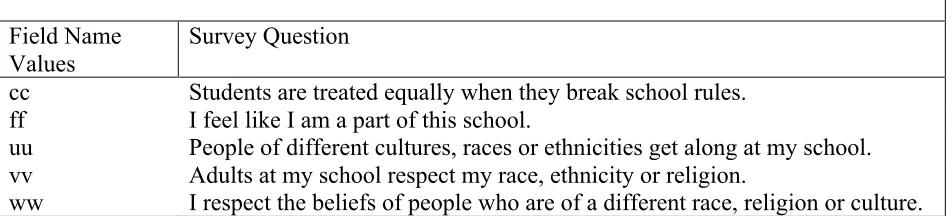
Table 1
District 5-Item Equity Index
Field Name Values
Survey Question
cc Students are treated equally when they break school rules. ff I feel like I am a part of this school.
uu People of different cultures, races or ethnicities get along at my school. vv Adults at my school respect my race, ethnicity or religion.
ww I respect the beliefs of people who are of a different race, religion or culture. School Equity Index (SEI) – the score on a scale created by combining 25 survey items.
Table 2
School 25-Item Equity Index
Field Name Values
Survey Question
a Students at this school are friendly.
b Students at this school treat each other with respect. c My teachers care about me.
d My teachers listen when I have something to say. e My teachers tell me when I do a good job.
f My teachers give me individual help when I need it. g I feel comfortable asking my teachers for help. h My teachers help me catch up if I’m behind.
i My teachers notice if I’m having trouble learning something. j My teachers treat me with respect.
k School administrators treat students with respect. l Campus supervisors treat student with respect. q I am recognized for good academic work. r I am recognized for good behavior. t I have to work hard to do well in school. u The work in my classes is engaging.
w I am encouraged to participate in accelerated/advanced courses. x My teachers expect me to do my best.
y My teachers set high standards for achievement for all students.
z My teachers show how classroom lessons are helpful to me in real life. cc Students are treated equally when they break school rules.
ee It is important for me to participate in activities outside the classroom. ff I feel like I am part of this school.
Procedures
The collection of survey data was a structured and streamlined process converting responses into raw data while simultaneously verifying reliability (Bernhardt et al., 2009; Nardi, 2006). This data collection model has significant ramifications for educational institutions resources. In collaboration with EFF, the District made several modifications to the original EFF questionnaires. Student and staff surveys are completed online in May of each academic year. Surveys were completed online and housed on a server that minimizes costs and requires limited administrative oversight. Survey submission is completely confidential and anonymous - with the responses for all questions and demographics optional. According to the District, the student and staff perception surveys were all administered online at each individual school, so they were able to achieve nearly 100% results over the 5-year period. The data is stored on a secure third party server (survey monkey) and the files provided to the researcher will be destroyed after the results have been tabulated.
Research Ethics
The approval of the George Fox University Institutional Review Board (IRB) for this research project was not required. The researcher obtained institutional approval for access to and use of preexisting data collected by Education for the Future (EFF). As the data was
provided anonymously, the anonymity and confidentiality of participants was guaranteed. Each participant school was issued a pseudonym for the reporting of all data and analysis. EFF signed a letter of consent describing the nature and purpose of the study (Appendix A).
achievement data was destroyed by the researcher after results were tabulated and the dissertation successfully completed.
Role of the Researcher
The researcher in this study pursued this investigation in an ethical and professional manner, following all policies and procedures of the George Fox University Human Subjects in Research Committee. The researcher satisfied committee requirements and preserved the integrity of EFF, a highly respected academic data analysis organization. The researcher, as a professional educator, previously implemented of a U.S. Department of Education dissemination grant on Data-Driven Continuous School Improvement in partnership with EFF. In addition, the researcher has implemented the EFF surveys and process with several schools spanning three continents. The researcher was the principal investigator of this study.
Potential Contributions of the Research
CHAPTER 4
RESULTS
Introduction
This chapter examines the relationship between school climate and the perception of equity among students and teachers. Pre-existing quantitative survey data were analyzed using a Multivariate Analysis of Variance (MANOVA) to identify interactions between the selected independent and dependent variables. Additional analyses were completed using ANOVA and posthoc tests in order to further explore the correlations of each item with race, school and year. The findings respond to the research question posed in the first chapter: Do middle school students and teachers of different races in the District perceive equity in school climate differently? The findings also discuss the initial hypotheses presented in Chapter 1.
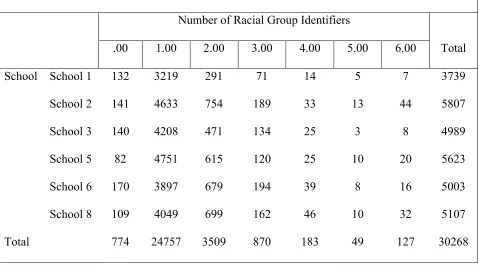
Table 3
School and Race Identifier Cross Tabulation for Students.
Number of Racial Group Identifiers
Total .00 1.00 2.00 3.00 4.00 5.00 6.00
School School 1 132 3219 291 71 14 5 7 3739
School 2 141 4633 754 189 33 13 44 5807
School 3 140 4208 471 134 25 3 8 4989
School 5 82 4751 615 120 25 10 20 5623
School 6 170 3897 679 194 39 8 16 5003
School 8 109 4049 699 162 46 10 32 5107
Total 774 24757 3509 870 183 49 127 30268
Fisher’s Procedure
Using Fisher’s procedure (Huck, 2012) a MANOVA was conducted to examine the effects of race, school, and year on the 5-item and 25-item Equity indices. The MANOVA results indicated the existence of some significant group differences. The MANOVA was followed by two ANOVAs using the 5-item District Equity index (DEI) as the dependent variable for one ANOVA and the other using the 25-item School Equity index (SEI) as the dependent variable focused on the first and last year of data (2009 and 2013). When significant differences emerged in these two-way ANOVAs, the effects were investigated further using one-way ANOVAs and post hoc tests.
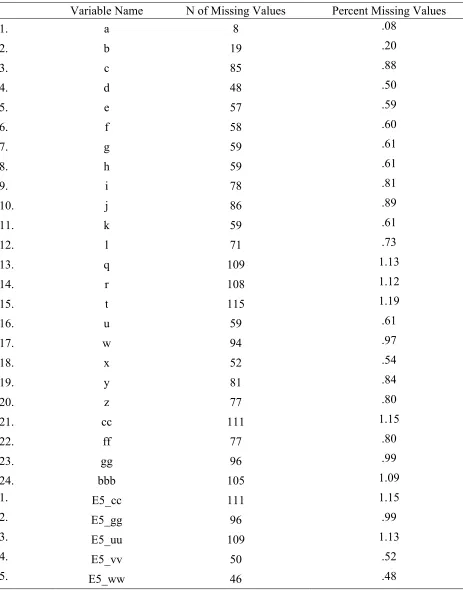
Cleaning the Data
indices were calculated. The number of missing data for each item is shown in Table 5. The rate of missing data is extremely low. There were no significant patterns of missing data identified as a function of race, school, or year.
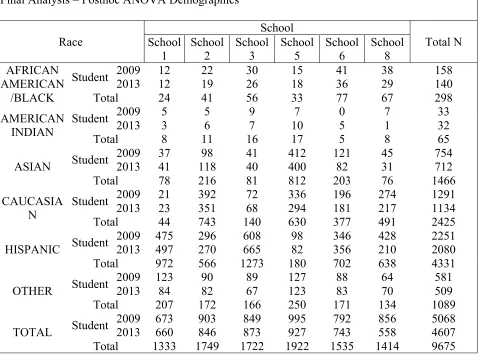
Table 4
Final Analysis – Posthoc ANOVA Demographics
Race School Total N School 1 School 2 School 3 School 5 School 6 School 8 AFRICAN AMERICAN /BLACK
Student 2009 2013 12 12 22 19 30 26 15 18 41 36 29 38 158 140
Total 24 41 56 33 77 67 298
AMERICAN
INDIAN Student
2009 5 5 9 7 0 7 33
2013 3 6 7 10 5 1 32
Total 8 11 16 17 5 8 65
ASIAN Student 2009 2013 37 41 118 98 41 40 412 400 121 82 31 45 754 712
Total 78 216 81 812 203 76 1466
CAUCASIA N
Student 2009 21 392 72 336 196 274 1291
2013 23 351 68 294 181 217 1134
Total 44 743 140 630 377 491 2425
HISPANIC Student 2009 475 2013 497 296 270 608 665 98 82 346 356 428 210 2251 2080
Total 972 566 1273 180 702 638 4331
OTHER Student
2009 123 90 89 127 88 64 581
2013 84 82 67 123 83 70 509
Total 207 172 166 250 171 134 1089
TOTAL Student
2009 673 903 849 995 792 856 5068
2013 660 846 873 927 743 558 4607
Table 5
Missing data for each District Equity Index and School Equity Index Scale Item.
Variable Name N of Missing Values Percent Missing Values
1. a 8 .08
2. b 19 .20
3. c 85 .88
4. d 48 .50
5. e 57 .59
6. f 58 .60
7. g 59 .61
8. h 59 .61
9. i 78 .81
10. j 86 .89
11. k 59 .61
12. l 71 .73
13. q 109 1.13
14. r 108 1.12
15. t 115 1.19
16. u 59 .61
17. w 94 .97
18. x 52 .54
19. y 81 .84
20. z 77 .80
21. cc 111 1.15
22. ff 77 .80
23. gg 96 .99
24. bbb 105 1.09
1. E5_cc 111 1.15
2. E5_gg 96 .99
3. E5_uu 109 1.13
4. E5_vv 50 .52
Findings
In response to the original research question, outcomes indicate that race did not have an affect on student or staff perception of equity as measured by both equity indexes. The results for each hypothesis are outlined below:
H1: Results for students self-identifying as Black/African American and Hispanic
Race/Ethnicity will show significantly lower results than students of White or Asian races.
F1: Black/African American and Hispanic student results were consistent with White
and Asian student results.
H2: Student perception results will show increased scores over time.
F2: Student perception scores increased significantly over time.
H3: Teacher perception results will show higher scores than student perception results.
F3: Teachers perception result scores were higher than student scores.
H4: Results for the District Equity Index (DEI) and School Equity Index (SEI) will be
consistent across all independent variables.
F4: The DEI and SEI responses were consistent for constituents. Race, school and year outcomes demonstrated inconsistencies across indices.
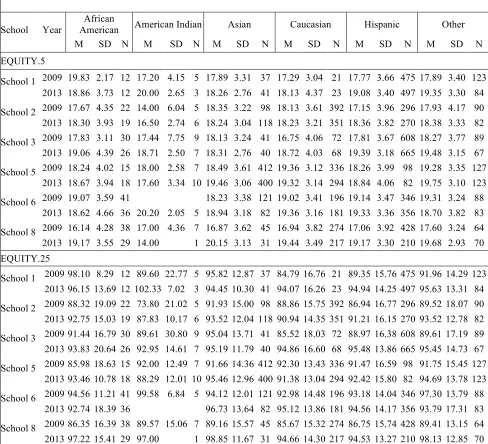
MANOVA: Initial Exploration and Results
Table 6
Posthoc ANOVA: Equity as a Function of Race/Ethnicity.
School Year
African
American American Indian Asian Caucasian Hispanic Other
M SD N M SD N M SD N M SD N M SD N M SD N
EQUITY.5
School 1 2009 19.83 2.17 12 17.20 4.15 5 17.89 3.31 37 17.29 3.04 21 17.77 3.66 475 17.89 3.40 123 2013 18.86 3.73 12 20.00 2.65 3 18.26 2.76 41 18.13 4.37 23 19.08 3.40 497 19.35 3.30 84
School 2 2009 17.67 4.35 22 14.00 6.04 5 18.35 3.22 98 18.13 3.61 392 17.15 3.96 296 17.93 4.17 90 2013 18.30 3.93 19 16.50 2.74 6 18.24 3.04 118 18.23 3.21 351 18.36 3.82 270 18.38 3.33 82
School 3 2009 17.83 3.11 30 17.44 7.75 9 18.13 3.24 41 16.75 4.06 72 17.81 3.67 608 18.27 3.77 89 2013 19.06 4.39 26 18.71 2.50 7 18.31 2.76 40 18.72 4.03 68 19.39 3.18 665 19.48 3.15 67
School 5 2009 18.24 4.02 15 18.00 2.58 7 18.49 3.61 412 19.36 3.12 336 18.26 3.99 98 19.28 3.35 127 2013 18.67 3.94 18 17.60 3.34 10 19.46 3.06 400 19.32 3.14 294 18.84 4.06 82 19.75 3.10 123
School 6 2009 19.07 3.59 41 18.23 3.38 121 19.02 3.41 196 19.14 3.47 346 19.31 3.24 88
2013 18.62 4.66 36 20.20 2.05 5 18.94 3.18 82 19.36 3.16 181 19.33 3.36 356 18.70 3.82 83
School 8 2009 16.14 4.28 38 17.00 4.36 7 16.87 3.62 45 16.94 3.82 274 17.06 3.92 428 17.60 3.24 64
2013 19.17 3.55 29 14.00 1 20.15 3.13 31 19.44 3.49 217 19.17 3.30 210 19.68 2.93 70
EQUITY.25
School 1 2009 98.10 8.29 12 89.60 22.77 5 95.82 12.87 37 84.79 16.76 21 89.35 15.76 475 91.96 14.29 123 2013 96.15 13.69 12 102.33 7.02 3 94.45 10.30 41 94.07 16.26 23 94.94 14.25 497 95.63 13.31 84
School 2 2009 88.32 19.09 22 73.80 21.02 5 91.93 15.00 98 88.86 15.75 392 86.94 16.77 296 89.52 18.07 90 2013 92.75 15.03 19 87.83 10.17 6 93.52 12.04 118 90.94 14.35 351 91.21 16.15 270 93.52 12.78 82
School 3 2009 91.44 16.79 30 89.61 30.80 9 95.04 13.71 41 85.52 18.03 72 88.97 16.38 608 89.61 17.19 89 2013 93.83 20.64 26 92.95 14.61 7 95.19 11.79 40 94.86 16.60 68 95.48 13.86 665 95.45 14.73 67
School 5 2009 85.98 18.63 15 92.00 12.49 7 91.66 14.36 412 92.30 13.43 336 91.47 16.59 98 91.75 15.45 127 2013 93.46 10.78 18 88.29 12.01 10 95.46 12.96 400 91.38 13.04 294 92.42 15.80 82 94.69 13.78 123
School 6 2009 94.56 11.21 41 99.58 6.84 5 94.12 12.01 121 92.98 14.48 196 93.18 14.04 346 97.30 13.79 88
2013 92.74 18.39 36 96.73 13.64 82 95.12 13.86 181 94.56 14.17 356 93.79 17.31 83
School 8 2009 86.35 16.39 38 89.57 15.06 7 89.16 15.57 45 85.67 15.32 274 86.75 15.74 428 89.41 13.15 64
2013 97.22 15.41 29 97.00 1 98.85 11.67 31 94.66 14.30 217 94.53 13.27 210 98.13 12.85 70
A 6 (races) x 6 (schools) x 2 (years) MANOVA using the two equity indices as dependent variables was completed. The data were judged to be linear through the visual
in such a case. The Pillai’s Trace was found to be robust in the face of this violation and
therefore the Box Test assumption is not fatal to the analysis. The MANOVA effects are shown in Table 7.
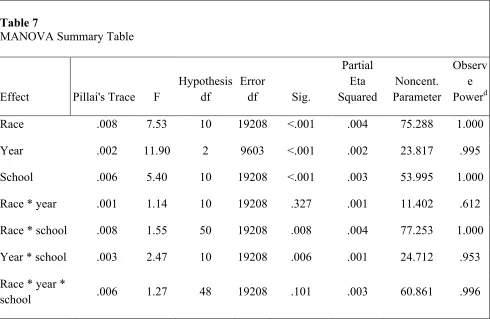
Table 7
MANOVA Summary Table
Effect Pillai's Trace F
Hypothesis df
Error
df Sig.
Partial Eta Squared
Noncent. Parameter
Observ e Powerd
Race .008 7.53 10 19208 <.001 .004 75.288 1.000
Year .002 11.90 2 9603 <.001 .002 23.817 .995
School .006 5.40 10 19208 <.001 .003 53.995 1.000 Race * year .001 1.14 10 19208 .327 .001 11.402 .612 Race * school .008 1.55 50 19208 .008 .004 77.253 1.000 Year * school .003 2.47 10 19208 .006 .001 24.712 .953 Race * year *
school .006 1.27 48 19208 .101 .003 60.861 .996
There are significant main effects for race (F(10, 19208) = 7.53, p < .001), year (F(2, 9603) = 11.90, p < .001), and school (F(10, 19208) = 5.40, p < .001). The interactions of race and year (F(10, 19208) = 1.14, p = .33) and race, year, and school (F(48, 19208) = 1.14, p = .10) were not significant. However, the interactions of race and school (F(50, 19208) = 1.55, p = .008) and year and school (F(50, 19208) = 2.47, p = .006) were both significant. The effect sizes of all the main effects and the interactions were so small that they indicate “no effect” according to Cohen (1992).