R E S E A R C H A R T I C L E
Open Access
A simple method for estimating relative risk
using logistic regression
Fredi A Diaz-Quijano
Abstract
Background:Odds ratios (OR) significantly overestimate associations between risk factors and common outcomes. The estimation of relative risks (RR) or prevalence ratios (PR) has represented a statistical challenge in multivariate analysis and, furthermore, some researchers do not have access to the available methods. Objective: To propose and evaluate a new method for estimating RR and PR by logistic regression.
Methods:A provisional database was designed in which events were duplicated but identified as non-events. After, a logistic regression was performed and effect measures were calculated, which were considered RR estimations. This method was compared with binomial regression, Cox regression with robust variance and ordinary logistic regression in analyses with three outcomes of different frequencies.
Results:ORs estimated by ordinary logistic regression progressively overestimated RRs as the outcome frequency increased. RRs estimated by Cox regression and the method proposed in this article were similar to those
estimated by binomial regression for every outcome. However, confidence intervals were wider with the proposed method.
Conclusion:This simple tool could be useful for calculating the effect of risk factors and the impact of health interventions in developing countries when other statistical strategies are not available.
Keywords:Logistic regression, Odds ratio, Prevalence ratio, Relative risk.
Background
The odds ratio (OR) is commonly used to assess asso-ciations between exposure and outcome and can be esti-mated by logistic regression, which is widely available in statistics software. OR has been considered an approxi-mation to the prevalence ratio (PR) in cross-sectional studies or the risk ratio (RR, which is mathematically equivalent to PR) in cohort studies or clinical trials. This is acceptable when the outcome is relatively rare (< 10%). However, since many health outcomes are com-mon, the interpretation of OR as RR is questionable because OR overstates RR, sometimes dramatically [1-3].
Moreover, the OR has been considered an “
unintelligi-ble”effect measure in some contexts [3].
Binomial regression has been recommended for the estimation of RRs (and PRs) in multivariate analysis [4].
However, sometimes this statistical method cannot esti-mate RR because convergence problems are frequent. Therefore, the Cox regression with robust variance has been recommended as a suitable method for estimating RRs [5,6].
However, these statistical methods (binomial and Cox regression) are not widely available in freeware (such as Epidat or Epi-Info). Therefore, the ability to estimate PRs and RRs in multivariate models could be limited in research groups with scant resources. In this article, a strategy for estimating RRs with ordinary logistic regres-sion is proposed. This new method could be useful for identifying risk factors and estimating the impact of health interventions in developing countries.
Methods
Database
A database of 1000 observations with dichotomous vari-ables was created to simulate a cohort study in which a common event (incidence of 50%) would be strongly Correspondence: [email protected]
Grupo Latinoamericano de Investigaciones Epidemiológicas, Organización Latinoamericana para el Fomento de la Investigación en Salud (OLFIS), Bucaramanga, Colombia
related to two independent predictors (AandB). These predictors would also be statistically associated with one another, resulting in a moderate confounding effect. Then, a third independent variable with a prevalence of
40% was included (predictorC). This variable was
ran-domly distributed, but more often in positive than
nega-tive predictor A group. Thus, this variable was
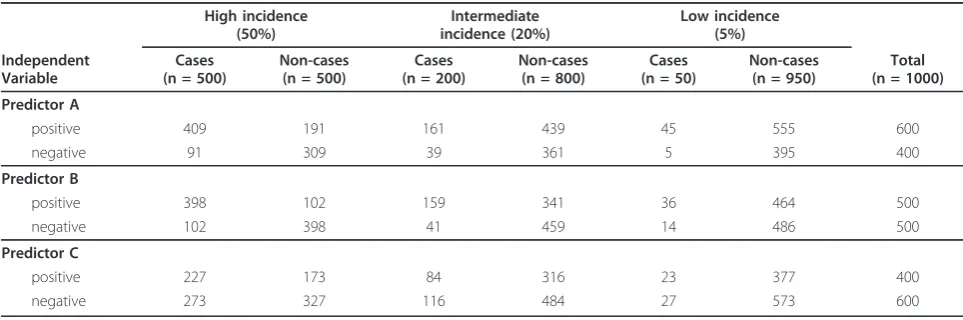
statistically associated with the outcome in a univariate analysis but the association would be explained by the presence of predictor Ain a multivariate model. Finally, additional dependent variables were generated by ran-domly selecting a proportion of cases. Thus, outcome variables with frequencies of 20% and 5% were obtained. The first table shows the hypothetical distribution of subjects according to the predictors and outcomes (Table 1).
Statistical analysis
Statistical analysis was performed using STATA
soft-ware (STATA®/IC 11.0). RRs and 95% confidence
inter-vals (CI) were estimated by applying log-binomial regression and Cox regression with a constant in the time variable [6]. In order to obtain corrected CIs by Cox regression, the robust variance option was applied [7]. ORs and their correspondent CIs were also esti-mated using an ordinary logistic regression. After uni-variate estimations were calculated, ORs and RRs were obtained in multivariate models including all indepen-dent variables (predictors A, B and C).
Proposed modification to logistic regression analysis The log-binomial model is similar to logistic regression in assuming a binomial distribution of the outcome. However, in a logistic regression the link function is the logarithm of the odds, which is the ratio between cases and non-cases, while in binomial regression the link function is the logarithm of the proportion, i.e., the ratio between cases and cases plus non-cases [4].
In a binomial regression model with k covariates, the function is written as:
Log a/(a + b) =β0+ β1X1+. . .+βkXk
wherea is the number of cases andb is the number
of non-cases, andXi the covariates. Thus, a/(a + b) is the probability of success (e. g., the proportion of sick persons in a group), and the RR (or PR) estimated of a given covariate Xiis ebi.
On the other hand, in a logistic regression model, the function is written as:
Log a/b =β0+ β1X1+ . . . + βkXk
where a/b is the odds of success and the OR estimated of a given covariate Xiisebi.
In order for the case information to be included in the denominator of the estimates in a logistic regression, all observed cases were duplicated in a provisional database and identified as non-cases. Thus, a number of observa-tions was included equaling that of the cases and con-taining the same information about the covariates. Thus, this new logistic function could be written as:
Log a/(y) =β0+ β1X1+ . . . + βkXk
where yincludes non-cases as well as cases, although
all of them are identified as non-cases. Afterwards, a logistic regression procedure was performed with the
modified dataset. The“ORs” obtained were considered
direct estimations of RRs because bi defined the
rela-tionship between Xiand the Log [a/(y)], which in this
model would be mathematically similar to Log [a/(a + b)] of the log-binomial model. For each outcome, a pro-visional database was prepared.
This strategy for logistic regression recognizes an entire cohort as controls. This trick is innovative but analogous to the analysis of case-cohort studies. In that design, cases of a particular outcome are compared with
Table 1 Hypothetical distribution of subjects according to the predictors and outcome incidence
High incidence (50%)
Intermediate incidence (20%)
Low incidence (5%)
Independent Variable
Cases (n = 500)
Non-cases (n = 500)
Cases (n = 200)
Non-cases (n = 800)
Cases (n = 50)
Non-cases (n = 950)
Total (n = 1000)
Predictor A
positive 409 191 161 439 45 555 600
negative 91 309 39 361 5 395 400
Predictor B
positive 398 102 159 341 36 464 500
negative 102 398 41 459 14 486 500
Predictor C
positive 227 173 84 316 23 377 400
a sample (sub-cohort) of the entire cohort that gave rise to all cases [8]. The objective of selecting this sub-cohort is to estimate the frequency of exposure in the entire cohort. For this reason, such studies have also been called case-exposure studies [9].
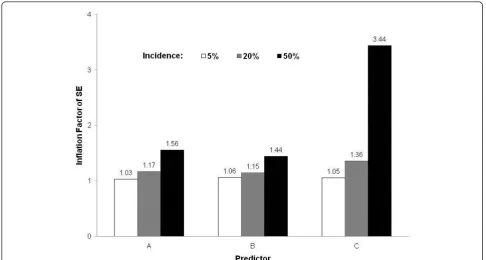
This sub-cohort may include some cases, which would consequently be overrepresented in the analysis. Then, by comparing the frequency of exposure between the cases and the sub-cohort set, we obtain a direct estimate of RR (not OR) [9-11]. Similarly, in the method pro-posed here, the cases would be compared against the entire cohort and thus all cases would be overrepre-sented. This affects the variance of the estimates and for this reason the CIs are wider [11]. Therefore, an infla-tion factor for the Standard Error (SE) of each predictor and outcome incidence was calculated as the ratio between SE obtained with the proposed method and SE resulting from binomial regression (as reference method).
Results
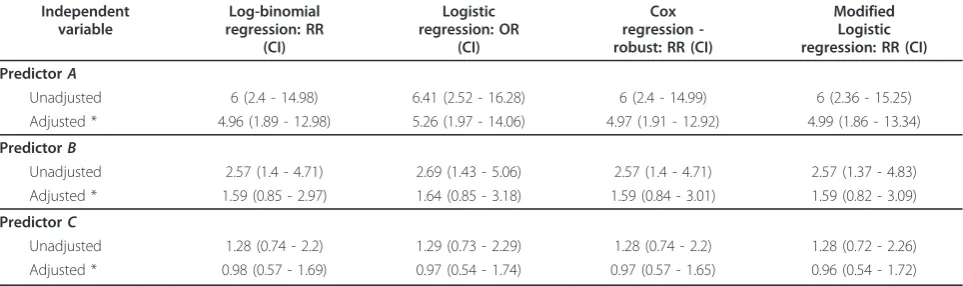
For the rarer event (incidence of 5%), RRs estimated by log-binomial were similar to those calculated both by the Cox regressions and the proposed method (modified logistic regression) (Table 2). Few differences were iden-tified among the CIs of RRs: CIs from the modified method were wider than those estimated by log-bino-mial and Cox regression with the robust variance option. ORs estimated by ordinary logistic regression were close to RR values. Predictors AandBwere statis-tically associated with the outcome in univariate analysis
but only Awas independently associated in the
multi-variate model (Table 2).
For the second and third outcomes, with incidences of 20% and 50% respectively, the differences between RRs in log-binomial regression and ORs in ordinary logistic regression were more evident (Tables 3 and 4). This was
especially remarkable for the commonest event, where the ORs of predictors A and B were at least twice the corresponding RR values (Table 4).
On the other hand, RRs estimated in Cox regressions and modified logistic regression were similar or virtually identical to those estimated by log-binomial regression. However, the CIs outputted by the proposed method were wider than those obtained by the other models (Tables 3 and 4). Consequently, the SE inflation factor rose for each predictor as the outcome frequency increased (Figure 1).
Discussion
The use of an adjusted odds ratio to estimate an adjusted relative risk or prevalence ratio is appropriate for studies of rare outcome but may be misleading when the outcome is common. Such overestimation may inap-propriately affect clinical decision-making or policy development [3]. For example, overestimation of the importance of a risk factor may lead to unintentional errors in the economical analysis of potential interven-tion programs or treatment, which could be particularly harmful in developing countries.
The ordinary logistic model estimates OR (not RR) and was initially adapted for case-control studies since data from this type of study design can only determine OR [12]. Moreover, a case-control study is an optimal choice for analyzing rare-event risk factors, for which OR is a close approximation of RR. Thus, ordinary logis-tic regression is eminently useful for case- control stu-dies mainly because the numeric value of OR mimics RR [12].
On the other hand, RR and PR can be directly deter-mined from data based on cohort and cross-sectional studies, respectively, which are practical only for rela-tively common outcomes. However, in such circum-stances OR estimated by ordinary logistic regression will
Table 2 RRs and ORs and corresponding CIs of associations between a rare event (incidence = 5%) and three
independent variables, estimated by Log-binomial regression, ordinary logistic regression, Cox regression with robust variance and logistic regression with the proposed modification
Independent variable
Log-binomial regression: RR
(CI)
Logistic regression: OR
(CI)
Cox regression -robust: RR (CI)
Modified Logistic regression: RR (CI)
PredictorA
Unadjusted 6 (2.4 - 14.98) 6.41 (2.52 - 16.28) 6 (2.4 - 14.99) 6 (2.36 - 15.25)
Adjusted * 4.96 (1.89 - 12.98) 5.26 (1.97 - 14.06) 4.97 (1.91 - 12.92) 4.99 (1.86 - 13.34)
PredictorB
Unadjusted 2.57 (1.4 - 4.71) 2.69 (1.43 - 5.06) 2.57 (1.4 - 4.71) 2.57 (1.37 - 4.83)
Adjusted * 1.59 (0.85 - 2.97) 1.64 (0.85 - 3.18) 1.59 (0.84 - 3.01) 1.59 (0.82 - 3.09)
PredictorC
Unadjusted 1.28 (0.74 - 2.2) 1.29 (0.73 - 2.29) 1.28 (0.74 - 2.2) 1.28 (0.72 - 2.26)
Adjusted * 0.98 (0.57 - 1.69) 0.97 (0.54 - 1.74) 0.97 (0.57 - 1.65) 0.96 (0.54 - 1.72)
be more discrepant than RR (or PR). This was exempli-fied in the results of this paper in that ORs progressively overestimated RRs as the outcome frequency increased.
Indeed, OR will always be greater than RR if RR is greater than 1 (adverse event) and OR will also be less than RR if RR less than 1 (protective effect). Therefore, the uncritical application of logistic regression and the misinterpretation of OR as RR can lead to serious errors in determination of both the importance of risk factors and the impact of interventions on clinical practice and public health [13].
For these reasons, several strategies for estimating RRs in multivariate analysis have been proposed [7,14-16]. Binomial regression is considered the most adequate choice. However, binomial models often predict prob-abilities greater thanone and sometimes this regression cannot find possible values and converge in a model. Consequently, other alternative methods have been
proposed when binomial regression cannot converge in a model. Cox regression with robust variance using a constant in the time variable seems like a good alterna-tive [7]. However, these options and other statistical alternatives are only available in sophisticated software that some research groups cannot afford.
This paper presents a strategy for logistic regression that recognizes an entire cohort as controls. As the results show, this method can appropriately estimate RRs or PRs, even in analyses with common outcomes. Moreover, the method proposed in this article could be easily performed using free statistics programs that include only logistic regression for multivariate analysis of dichotomous outcomes.
However, the proposed method is associated with SE inflation, which increases confidence intervals. A simple and practical correction factor cannot be established for this problem because, in a multivariate regression, the Table 3 RRs and ORs and corresponding CIs of associations between an intermediate frequency event (incidence = 20%) and three independent variables, estimated by Log-binomial regression, ordinary logistic regression, Cox regression with robust variance and logistic regression with the proposed modification
Independent variable
Log-binomial regression: RR
(CI)
Logistic regression: OR
(CI)
Cox regression
-robust: RR (CI)
Modified Logistic regression: RR
(CI)
Predictor A
Unadjusted 2.75 (1.99 - 3.81) 3.39 (2.33 - 4.95) 2.75 (1.99 - 3.81) 2.75 (1.9 - 3.99)
Adjusted * 1.79 (1.27 - 2.52) 2.06 (1.36 - 3.12) 1.77 (1.26 - 2.48) 1.75 (1.16 - 2.64)
Predictor B
Unadjusted 3.88 (2.82 - 5.34) 5.22 (3.6 - 7.56) 3.88 (2.82 - 5.34) 3.88 (2.69 - 5.59)
Adjusted * 3.15 (2.24 - 4.43) 4.07 (2.75 - 6.03) 3.15 (2.26 - 4.39) 3.15 (2.13 - 4.65)
Predictor C
Unadjusted 1.09 (0.85 - 1.4) 1.11 (0.81 - 1.52) 1.09 (0.85 - 1.4) 1.09 (0.8 - 1.48)
Adjusted * 0.92 (0.72 - 1.17) 0.89 (0.63 - 1.25) 0.92 (0.72 - 1.17) 0.93 (0.67 - 1.28)
* Adjusted by the other independent variables.
Table 4 RRs and ORs and corresponding CIs of associations between a common event (incidence = 50%) and three independent variables, estimated by Log-binomial regression, ordinary logistic regression, Cox regression with robust variance and logistic regression with the proposed modification
Independent variable
Log-binomial regression: RR
(CI)
Logistic regression: OR
(CI)
Cox regression
-robust: RR (CI)
Modified Logistic regression: RR
(CI)
PredictorA
Unadjusted 3 (2.48 - 3.62) 7.27 (5.44 - 9.72) 3 (2.48 - 3.62) 3 (2.31 - 3.89)
Adjusted * 1.9 (1.58 - 2.28) 4.07 (2.88 - 5.74) 1.89 (1.56 - 2.28) 1.88 (1.41 - 2.51)
PredictorB
Unadjusted 3.9 (3.26 - 4.67) 15.23 (11.19 - 20.71) 3.9 (3.26 - 4.67) 3.9 (3.04 - 5.01) Adjusted * 3.08 (2.56 - 3.72) 10.97 (7.95 - 15.14) 3.09 (2.56 - 3.72) 3.09 (2.36 - 4.04)
PredictorC
Unadjusted 1.25 (1.1 - 1.41) 1.57 (1.22 - 2.03) 1.25 (1.1 - 1.41) 1.25 (1 - 1.55)
Adjusted * 1.02 (0.95 - 1.1) 1.12 (0.8 - 1.57) 1.05 (0.96 - 1.15) 1.06 (0.84 - 1.34)
standard error for each predictor depends on its correla-tion with all variables included in the model.
Therefore, since the obtained CIs can be wider than those estimated by other models, investigators must be aware that the risk of Type II error could be higher. For this reason, when an association is not statistically sig-nificant with the proposed method, ordinary logistic regression could be used for testing the hypothesis that association measure is different than unity. This is possi-ble since the null hypothesis is mathematically equiva-lent for both OR and RR, because when RR is equal to 1, OR is also equal to 1.
Conclusion
The proposed method may be useful for estimating RRs or PRs appropriately in analysis of common outcomes. However, because the resultant CIs are wider than those derived from other methods, this strategy should be employed when logistic regression is the only method available. This new method may help research groups from developing countries where access to sophisticated programs is limited.
Abbreviations
CI: Confidence interval; OR: Odds ratio; PR: Prevalence ratio; RR: Relative risk; SE: Standard Error
Authors’contributions
FAD conceived the study, created the database, designed and executed the analysis, and wrote the manuscript.
Competing interests
The author declares that they have no competing interests.
Received: 1 August 2011 Accepted: 15 February 2012 Published: 15 February 2012
References
1. McNutt LA, Wu C, Xue X, Hafner JP:Estimating the relative risk in cohort studies and clinical trials of common outcomes.Am J Epidemiol2003, 157:940-3.
2. Zhang J, Yu KF:What’s the Relative Risk? A Method of Correcting the Odds Ratio in Cohort Studies of Common Outcomes.JAMA1998, 280:1690-1691.
3. Pearce N:Effect measure in prevalence studies.Environ Health Perspect
2004,112:1047-1050.
4. Wacholder S:Binomial regression in GLIM: estimating risk ratios and risk differences.Am J Epidemiol1986,123:174-184.
5. Nijem K, Kristensen P, Al-Khatib A, Bjertness E:Application of different statistical methods to estimate risk for self-reported health complaints among shoe factory workers exposed to organic solvents and plastic compounds.Norsk Epidemiologi2005,15:111-116.
6. Lee J, Chia KS:Estimation of prevalence rate ratios for cross sectional data: an example in occupational epidemiology.Br J Ind Med1993, 50:861-862.
7. Barros AJD, Hirakata VN:Alternatives for logistic regression in cross-sectional studies: an empirical comparison of models that directly estimate the prevalence ratio.BMC Med Res Methodol2003,3:21. 8. Kulathinal S, Karvanen J, Saarela O, Kuulasmaa K:Case-cohort design in
practice - experiences from the MORGAM Project.Epidemiol Perspect Innov2007,4:15.
9. Flanders WD:Limitations of the case-exposure study.Epidemiology1990, 1:34-38.
10. Sato T:Estimation of a common risk ratio in stratified case-cohort studies.Stat Med1992,11:1599-605.
11. Sato T:Risk ratio estimation in case-cohort studies.Environ Health Perspect
1994,102(Suppl 8):53-6.
12. Lee J, Tan CS, Chia KS:A practical guide for multivariate analysis of dichotomous outcomes.Ann Acad Med Singapore2009,38:714-719.
13. Schwartz LM, Woloshin S, Welch HG:Misunderstandings about the effects of race and sex on physicians’referrals for cardiac catheterization.N Engl J Med1999,341:279-83.
14. Localio AR, Margolis DJ, Berlin JA:Relative risks and confidence intervals were easily computed indirectly from multivariable logistic regression.J Clin Epidemiol2007,60:874-882.
15. Thompson ML, Myers JE, Kriebel D:Prevalence odds ratio or prevalence ratio in the analysis of cross sectional data: what is to be done?Occup Environ Med1998,55:272-277.
16. Coutinho LM, Scazufca M, Menezes PR:Methods for estimating prevalence ratios in cross-sectional studies.Rev Saude Publica2008,42:992-998.
Pre-publication history
The pre-publication history for this paper can be accessed here: http://www.biomedcentral.com/1471-2288/12/14/prepub
doi:10.1186/1471-2288-12-14
Cite this article as:Diaz-Quijano:A simple method for estimating
relative risk using logistic regression.BMC Medical Research Methodology
201212:14.
Submit your next manuscript to BioMed Central and take full advantage of:
• Convenient online submission
• Thorough peer review
• No space constraints or color figure charges
• Immediate publication on acceptance
• Inclusion in PubMed, CAS, Scopus and Google Scholar
• Research which is freely available for redistribution