www.ijper.org
Development, Optimisation and Validation of
RP-HPLC Method for the Quantification of Resveratrol
Aarti Abhishek Shah, Yogendra Nayak*
Department of Pharmacology, Manipal College of Pharmaceutical Sciences, Manipal Academy of Higher Education, Karnataka, INDIA.
ABSTRACT
Background: Trans-resveratrol is a naturally occurring polyphenolic compound extensively marketed as a nutraceutical. It is highly explored molecule in the research community with vast therapeutic potential. Therefore, many inventions were made by pharma-industries for its clinical use and to bring it to the market as a drug. Objectives: In this study, a simple, rapid and sensitive Reverse Phase High Performance Liquid chromatographic (RP-HPLC) method for the quantitative determination of resveratrol was optimized and validated. Materials and Methods: HPLC system of Shimadzu Corporation, Japan, SPD-M201 model connected to Photo-diode Array was used in this study. Intek chromosol C18 column was used to perform the separation. The developed method was validated as per International Conference on Harmonization guidelines. The developed method is further used to estimate the % entrapment efficiency in the bone-targeted resveratrol loaded nanoparticles. Results: The optimum chromatographic separation was achieved by the mobile phase consist of acetonitrile and 25 mM ammonium acetate buffer (pH 4.5) in 45:55 ratios respectively. The flow rate of 0.9 mL/min with a standard retention time of 5.8 min at a wavelength 307 nm was optimized. The RP-HPLC method was developed, optimized and validated with the help of Design of Experiment software using 23 full factorial design. The desirability value was near to 1, specifies that the method is the ideal and robust. The method is further used to determine the % entrapment efficiency in the bone-targeted resveratrol loaded nanoparticles and found to be 79.27±5.54%. Conclusion: The present analytical method can be used for the quantification of resveratrol in pharmaceutical preparations and dietary supplements. Key words: HPLC, Nanoparticles, Optimization, Resveratrol, Validation.
DOI: 10.5530/ijper.53.3s.106 Correspondence:
Dr. Yogendra Nayak,
Associate Professor, Department of Pharmacology, Manipal College of Pharmaceutical Sciences, Manipal Academy of Higher Education, Mani-pal-576104
Karnataka, INDIA. Phone: +91 9448154003 E-mail: yogendra.nayak@ manipal.edu
INTRODUCTION
Trans-resveratrol (RSV) is natural polyphenol categorized chemically as a phytoalexin, have pharmacological potential and marketed as a nutraceutical for supplementing the treat-ment of diseases. It is approved as dietary supplements under the Federal Food Drug and Cosmetic Act, FDA, USA. Till today, it is not included as a drug for the treatment of any disorder in the United States Phar-macopeia but sold as a dietary supplement.1
As per the US Food and Drug Administra-tion (USFDA) regulaAdministra-tions, RSV is categorized as a nutrient, has been determined to be Generally Recognized as Safe. The increasing number of clinical trials on RSV for cancer, neurological, cardiovascular and metabolic
Submission Date: 30-04-2019; Revision Date: 24-05-2019; Accepted Date: 01-07-2019
disorders such as diabetes and obesity signi-fies the growing interest of pharmaceutical industries for its translational use.2 However,
the clinical utility of RSV is limited, mainly due to its instability, inefficient systemic delivery and low bioavailability. To overcome these limitations, several attempts were made to develop an effective nano-formulations as polymeric nanoparticles, cyclodextrins, micelles and liposomes to improve bioavail-ability and subsequent stbioavail-ability.3 The
RSV in wines or plant extracts. It includes quantification of RSV in wines from Portugal,4 RP-HPLC coupled with UV
and electrochemical detection in wines,5 HPLC-MS
analysis of RSV in Hungarian wines;6 HPLC using
Chromolith columns;7 microextraction method with
Ultra-performance LC (UPLC) for RSV in wines8 and
quantitative analysis of cis- and trans-resveratrol in wines.7 Vesna Jerkovic et al. had assessed RSV from Beer
using RP-HPLC-MS/MS method.9 Other methods for
the analysis of RSV from the dietary supplements;10
for products containing RSV capsules or multi-ingredient formulations along with other phytochemicals,11
HPLC-MS method12 and RP-HPLC method to quantify
RSV in grape exocarp and seeds extracts.13
RSV is available in the commercial form with >99.0%. Purity. In this research work, the direct injection of a pure form of the RSV was used without prior purifica-tion or extracpurifica-tion method. The pure form of the RSV is used for the development of nano-formulations and in dietary supplements. There is an increasing number of RSV nano-formulations to enhance bioavailability, efficacy and achieve targetability. Therefore, a simple, sensitive analytical HPLC method is necessary to explore RSV nano-formulation research at the laboratory scale. RSV containing dietary supplements gives a greater amount of RSV than present in wines. Pure RSV and RSV containing multi-ingredient formulations are extensively used by the customers as a nutraceutical for health-promoting effects. According to the NIH- Dietary Supplement Label Database, there were 207 RSV containing dietary supplements are available.14 Most of
these dietary supplements are not compliance with the Good Manufacturing Practices (GMP) European laws requirements (95–105% content). A study conducted by Rossi et al. 2012, only five out of 14 brands of RSV formulations were passed the GMP criteria.12 Therefore,
an analytical method for RSV containing products needs to be validated and provide a reliable solution to ensure the correct identity, strength, quality, purity and potency. Thus, it was decided to develop a rapid and economic RP-HPLC method which was based on PDA detection for the quantification in the nano-formulation. Systematic validation of the method is essential to achieve the reproducibility and robustness to quantify RSV.
In the present work, the HPLC method has been validated with the help of DOE (Design of Experiment) software to achieve the optimum solution according to the International Council for Harmonisation of Technical Requirements for Pharmaceuticals for Human Use (ICH) guidelines ICH Q2(R1) guidelines.15
MATERIALS AND METHODS Instrumentation and Chemicals
HPLC system of Shimadzu Corporation, Japan, SPD-M201 model connected to PDA (Photo-diode Array), column-oven and auto-sampler was used in this study. Chromatograms were recorded by a computer-aided LC solution 5.57 software. Intek chromosol C18column (250 mm x 4.6 mm id) was used to perform the separa-tion along with guard column. The pH of the buffer was measured using systronics micro-pH system 361, with a glass electrode. Milli-Q from the direct-Q3 water purification system milli-pore corporation, USA was used. The Design of Experiments (DOE) run was performed by Design-Expert® software, 9.0.4.1 version (Stat-Ease,
Inc. Minneapolis). Trans-resveratrol (>99.0%) was purchased from TCI Chemicals, India. The HPLC-grade solvents were procured from Merck Limited, India. Mobile phase preparation
The mobile phase used for the study is consist of aceto-nitrile and 25 mM ammonium acetate buffer pH 4.5 in the ration of 45:55. The pH adjusted with acetic acid / ammonium hydroxide solution.
Preparation of calibration standards
A standard stock solution of RSV (1000 μg/mL) was prepared by dissolving in methanol. Further working stocks solutions ranging from 0.1-10 µg/mL were prepared by diluting with methanol.
Development of HPLC method and optimization The RSV is a strong acid and has three acidic dissociation constants (pKa1= 8.8; pKa2 = 9.8; pKa3 = 11.4).16
closes to 1.0. The system suitability parameters such as percentage Relative Standard Deviation (%RSD), theoretical plate count and tailing factor at 10% peak width (Tf10%) were calculated using chromatographic data software. The acetonitrile content (%), pH of ammonium acetate buffer solution and flow rate of mobile phase (mL/min) plays an essential role in the development of the method. Hence, these three factors were considered and optimized with the DOE software as indicated in Table 1.
Robustness studies express to provide consistent results within the changes in the method parameters. The variables were acetonitrile content (45±3%), pH of ammonium acetate buffer solution (4.5±0.2) and flow rate of mobile phase (0.9±0.2 mL/min) used in a multivariate approach (Table 1). The 23 full factorial
design with two levels as -1 and +1 to yield a total of 08 runs to detect any changes in method responses like retention time, peak area, Tf10% and a total number of theoretical plates were analyzed by DOE software. Validation of the optimized method
The method was validated as per the requirements ICH Q2(R1) guidelines by determining parameters as System Suitability, Specificity, Linearity, Accuracy, Precision, Limit of Detection (LOD) and Limit of Quantification (LOQ).
System Suitability
To assess the suitability of instrument, analysts and columns, RSV analyte concentration of 1 μg /mL solution (n=6) was used and system suitability parameters were evaluated.
System Specificity
The interference from the solvent with the mobile phase was assessed by injecting methanol as a blank (n=3).
Linearity
The RSV working stocks solutions ranging from 0.1–10 μg/mL were injected thrice into HPLC System. The coefficient of determination (R2) was determined
from the calibration plot of concentration against the peak area.
Accuracy and Precision
The accuracy was established by determining recovery (%) of RSV at three different concentrations as 0.1, 1 and 10 μg/mL (n=3), whereas precision studies were based on the robustness of the study with inter-day (within a day) and intra-day (two different days) sampling. Precision studies were carried at RSV concentration 10 μg/mL (n=6).
Limit of detection and limit of quantification (LOD and LOQ)
The Limit of Detection (LOD) and the Limit of Quan-tification (LOQ) was calculated as LOD = 3.3r/SP and LOQ = 10r/SP, where r is the least standard deviation value in response and SP is the slope of the response.
Applicability of the method in PLGA-nanoparticles In this work, RSV was loaded into Polylactic-co-glycolic Acid (PLGA) nanoparticles to target bone using Alendronate (ALN) as a targeting ligand. The PLGA-Alendronate conjugate was synthesized as per the reported method.17 The amount of RSV to the conjugate
ratio was optimized to get optimum particles size, polydispersity index and zeta potential. The nano- formulation was centrifuged at 13,000 rpm for 20 min. The amount of RSV present in the supernatant was calculated by the standard RSV calibration curve. The %Entrapment Efficiency (%EE) was calculated by the indirect method using the formula %EE = [(Ci–Cf)/ Ci] × 100, Where Ci = Initial amount of the RSV added, Cf = free non-entrapped RSV content in the supernatant.
RESULTS
Development and optimization of HPLC method In this study, as per 23 full factorial design, a total of
08 runs were performed. The effects of independent factors as acetonitrile content (A), pH of ammonium acetate buffer solution (B) and flow rate of mobile phase (mL/min) (C) on the responses as retention time, area, Tf10% and number of theoretical plates were as shown in Table 2.
Perturbation plot interpretations
The Design Expert version 9.0.3.1 provided perturbation plots interpretations to check the effects of independent factors as acetonitrile content (A), pH of ammonium acetate buffer solution (B) and flow rate of mobile Table 1: Independent Factors and levels used for the
23 Full Factorial design
Independent Factors Levels 1 Acetonitrile content (%) 42 48 pH of Ammonium acetate
buffer solution 4.3 4.7
Flow rate of mobile phase
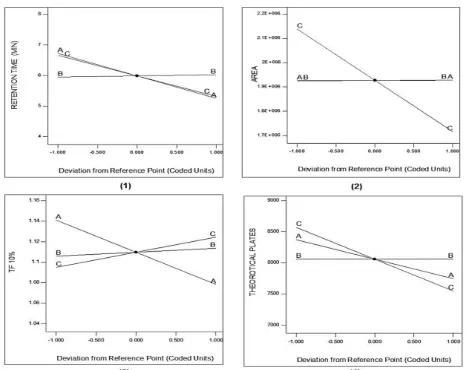
phase (mL/min) (C) on the responses as retention time (R1), area (R2), Tf10% (R3) and number of theoretical plate (R4) as indicated in Figure 1.
Effect of factors on retention time
Perturbation chart showed that retention time is signifi-cantly influenced by changing the acetonitrile content (A) and the flow rate of mobile phase (C). The retention time is decreasing, with the increase in factors A and C while it is not affected by the changes in the pH of the mobile phase (B) as shown in Figure 1(1).
Effect of factors on peak area
Peak area of RSV is significantly influenced by the change in the flow rate of the mobile phase (C). Peak area reduced with an increase in flow rate, while it remains unaffected by acetonitrile content (A) and pH of the mobile phase (B), as shown in Figure 1(2).
Effect of factors on Tailing Factor10%
The Tf10% was significantly influenced by changing the factor A, acetonitrile content (A) and the flow rate of the mobile phase (C). Tf10% is decreased with an increase in acetonitrile content while increased with the flow rate of the mobile phase. The pH of the mobile phase (B) did not have a significant effect on Tf10% as mentioned in Figure 1(3).
Effect of factors on Theoretical Plates
Figure1(4) defined the decrease in theoretical plate count with an increase in acetonitrile content (A) and the flow rate of the mobile phase (C) and unaffected with the changes in the pH of the mobile phase (B). Analysis of Robustness Study
The polynomial equations corresponding to the responses were generated by DOE software and analyzed by ANOVA with significance method. The polynomial equations for each response were given below:
Retention Time (R1) = 5.98687 + -0.733208* A + 0.0377083* B + -0.668708* C + -0.0300417 * AB + 0.0655417 * AC + -0.0322083 * BC
Peak Area (R2) =1.92701e+006 + 840.25 * A + 2052.33 *B + -210661* C + 2382.5* AB + -711.25 * AC + -2555.67 * BC
Tf10% (R3) = 1.10975 + -0.03125 * A + 0.00383333 * B + 0.0146667 * C + 0.00233333 * AB + 0.00633333 * AC
Theoretical Plate Count (R4) = 8059.98 + -311.999 * A + -510.21 * C + -130.208 * AB + -82.9635 * ABC
Where A, B and C are acetonitrile Content, pH of buffer solution and flow rate of mobile phase (mL/min). The correlation Coefficient (R2), level of significance
(ρ value) and relative errors were calculated by DOE software. (Table 3). The robustness studies express the consistent results and the suitability of the method at 10 µg/mL analytes concentration. Therefore, it was
Figure 1: Effect of factors Acetonitrile Content (A), pH of Ammonium Acetate buffer solution (B) and flow rate of mobile
phase (mL/min) (C) on (1) Retention Time (2) Area (3) Tf(10%)
and (4) Number of Theoretical Plates.
Table 2: DOE run results for RSV analyte concentration 10 µg/mL (n=3)
Run % Acetonitrile pH of Ammonium
acetate solution Flow Rate Retention Time Peak Area Tf(10%) theoretical plateNo. of
1 42 4.3 0.8 7.36 2135101 1.13167 8929.48
2 48 4.3 0.8 5.81 2131014 1.04967 8257.07
3 42 4.7 0.8 7.55 2137127 1.13367 8977.8
4 48 4.7 0.8 5.9 2147420 1.06533 8116.41
5 42 4.3 1 5.94 1717889 1.14733 7439.61
6 48 4.3 1 4.68 1715807 1.095 7384.86
7 42 4.7 1 6.03 1714542 1.15133 8141.02
considered realistic for routine usage in any laboratory. Results from the analysis of robustness studies found that the quadratic effect of factors and the responses were significant (ρ <0.05). The regression coefficient (r2) close-to 1 and low relative error was shown that
DOE runs were statistically significant.
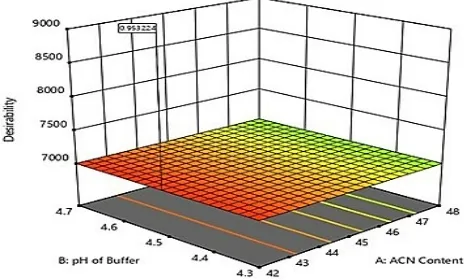
In Figure 2, the desirability of the optimized factors was found to be 0.9532, which shows the aptness of this method. The desirability values near to the 1 indicate that the method was very strong even in the deviation of the factors.
Validation of the optimized method
System Suitability
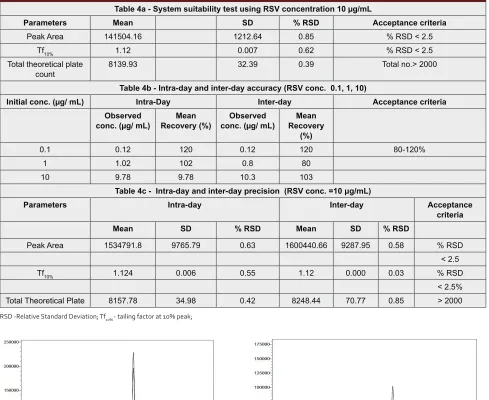
System Suitability data were expressed as percentage standard deviations of peak area, Peak Area, Tailing F (10%) and total no. of theoretical plate count. All the parameters were within the acceptance criteria (Table 4a).
System specificity
As RSV is dissolved in methanol, methanol is used as a blank and run has been carried out in an optimized chromatographic condition. It represents the specificity of the chromatogram of RSV from blank methanol. The overlay chromatogram of blank methanol and RSV at different concentration is as shown in Figure 3. The retention time of RSV with the optimized method was found to be 5.8 min.
Linearity
The calibration plot of peak area against the RSV concentration in the range of 0.1–10 μg/mL was found to be linear. The coefficient of determination (R2) = 0.9989
and linear regression slope was y = 208908x – 7378.6
(Figure 3).
Intra-day and Inter-day accuracy and precision For the Intra-day and Inter-day accuracy estimations, RSV analyte concentration at three different levels as such as 0.1, 1 and 10 were used. Intra-day and Inter-day accuracyresults lie in the acceptance criteria of 80-120 %. For intra-day and inter-day precision studies, RSV at 10 µg/mL (n=6) was injected and the precision was found to be below 2 (Table 4 b and 4c).
Limit of Detection and Limit of Quantification (LOD and LOQ)
LOD, the lowest detectable concentration by HPLC was found to be 0.28 µg/mL while LOQ, the lowest concentration that could be quantified was found to be 0.87 µg/mL.
Applicability of the method for the quantification of RSV in the nano-formulation
An optimized formulation had particle Size 196.9 nm, with polydispersity index 0.26 and zeta potential was found to be -64.21 mV. The % entrapment efficiency of the formulation was found to be 79.27±5.54%. The overlay chromatogram of PLGA-alendronate blank nanoparticles and RSV loaded PLGA-Alendronate nanoparticles is as indicated in Figure 4.
DISCUSSION
Most of the analytical methods reported in the literature were for the quantification of RSV in plant extract and wines. The RSV is increasingly gaining its importance both as nutraceuticals and pharmaceutical formulations and hence, it is essential to have a reproducible analytical method. In the current study, we have developed a RP-HPLC method for RSV and further validated by the various parameters under ICH Q2(R1) guidelines. The 23 Full factorial design using DOE software
Table 3: Analysis of robustness study
R2 Model P-value Predicted Observed Relative Error
Retention Time (R1) 1 0.013 ** 5.98 5.87 1.344
Peak Area (R2) 1 0.0108 ** 1927005.08 1600440.66 16.94
Tf10% (R3) 0.9988 0.0030 ** 1.1 1.12 1.818
Theoretical Plate Count(R4) 0.9626 0.0177 8059.08 8248.44 2.349 Figure 2: The 3-D plot is indicating the desirability of
Figure 3: Overlay HPLC Chromatogram of RSV. Overlay data 1: Blank Methanol; 2: RSV 0.1 μg/mL; 3: RSV
0.2 µg/mL; 4: RSV 0.4 µg/mL; 5: RSV 0.8 µg/mL; 6: RSV 1 µg/mL; 7: RSV 2 µg/mL; 8: RSV 4 µg/mL; 9: RSV 8 µg/mL;
10: RSV 10 μg/mL.
Figure 4: HPLC Chromatogram of (a) PLGA-ALN blank nanoparticles and (b) and the supernatant of RSV loaded
PLGA-Alendronate nanoparticles.
Table 4: Method validation results as per ICH guidelines with acceptance criteria Table 4a - System suitability test using RSV concentration 10 µg/mL
Parameters Mean SD % RSD Acceptance criteria
Peak Area 141504.16 1212.64 0.85 % RSD < 2.5
Tf10% 1.12 0.007 0.62 % RSD < 2.5
Total theoretical plate
count 8139.93 32.39 0.39 Total no.> 2000
Table 4b - Intra-day and inter-day accuracy (RSV conc. 0.1, 1, 10)
Initial conc. (µg/ mL) Intra-Day Inter-day Acceptance criteria
Observed
conc. (µg/ mL) Recovery (%)Mean conc. (µg/ mL)Observed Recovery Mean (%)
0.1 0.12 120 0.12 120 80-120%
1 1.02 102 0.8 80
10 9.78 9.78 10.3 103
Table 4c - Intra-day and inter-day precision (RSV conc. =10 μg/mL)
Parameters Intra-day Inter-day Acceptance
criteria
Mean SD % RSD Mean SD % RSD
Peak Area 1534791.8 9765.79 0.63 1600440.66 9287.95 0.58 % RSD < 2.5
Tf10% 1.124 0.006 0.55 1.12 0.000 0.03 % RSD
< 2.5% Total Theoretical Plate 8157.78 34.98 0.42 8248.44 70.77 0.85 > 2000
RSD -Relative Standard Deviation; Tf10% - tailing factor at 10% peak;
defines the robustness of the method. This software has been used earlier for the development and validation of an analytical method for pharmaceuticals and nutraceuticals.18The desirable value was near to 1, indicates
that the developed method is ideal. Further, the devel-oped analytical method was employed to calculate RSV content and subsequent %EE in the bone-targeted RSV nano-formulation. The bone-targeted RSV loaded
analytical method can be used to estimate RSV content in various nano-formulations and dosage forms.
The present work can be extended to estimate RSV in plasma and other biological fluids for pharmacokinetic profiling associated with the various formulations. With the increasing potential for RSV containing nutraceuticals, the present method is found to be statistically signifi-cant for the analysis of RSV in dietary supplements. It leads to fulfil the GMP criteria for the development of RSV containing dietary supplements and to match the “labelled claim” content.
CONCLUSION
An RP-HPLC method was successfully validated for the quantitative determination of RSV. The following method is under the acceptance criteria and statistically found to be significant. Thus, this method can be used for the quantification of RSV in nano-formulation development and to maintain quality control of RSV containing nutraceuticals.
ACKNOWLEDGEMENT
The authors acknowledge the Department of Science and Technology, Government of India for the financial support vide Reference no. SR/WOS-A/LS-444/2016 to carry out this work.
CONFLICT OF INTEREST
The authors declare no conflict of interest.
ABBREVIATIONS
RSV: Trans-resveratrol; RP-HPLC: Reverse Phase
High-Performance Liquid Chromatography; FDCA:
Food Drug and Cosmetic Act; USFDA: United State
Food and Drug Administration; GMP: Good Manufac-turing Practices; DOE: Design of Experiment; PDA:
Photo-diode Array; %RSD: Percent Relative Standard
Deviation; LOD: Limit of detection; LOQ: Limit of Quantification; PLGA: Polylactic-Co-Glycolic Acid;
ALN: Alendronate; %EE: %Entrapment Efficiency.
REFERENCES
1. Center for Drug Evaluation and Research. Advisory Committee Calendar - Updated Agenda and Public Participation: Nov: Meeting of the Pharmacy Compounding Advisory Committee Meeting Announcement. Center for Drug Evaluation and Research. 2017.
2. Berman AY, Motechin RA, Wiesenfeld MY, Holz MK. The therapeutic potential of resveratrol: A review of clinical trials. Npj Precis Oncol. 2017;1(1):35. 3. Summerlin N, Soo E, Thakur S, Qu Z, Jambhrunkar S, Popat A.
Resveratrol nanoformulations: Challenges and opportunities. Int J Pharm. 2015;479(2):282-90.
4. Ratola N, Faria JL, Alves A. Analysis and Quantification of trans-Resveratrol in Wines from Alentejo Region ( Portugal ). Food Technol Biotechnol. 2004;42(2):125-30.
5. Kolouchová-Hanzlíková I, Melzoch K, Filip V, Šmidrkal J. Rapid method for resveratrol determination by HPLC with electrochemical and UV detections in wines. Food Chem. 2004;87(1):151-8.
6. Mark L, Nikfardjam MSP, Avar P, Ohmacht R. A validated HPLC method for the quantitative analysis of trans-resveratrol and trans-piceid in Hungarian wines. J Chromatogr Sci. 2005;43(9):445-9.
7. Paulo L, Domingues F, Queiroz JA, Gallardo E. Development and validation of an analytical method for the determination of trans-and cis-resveratrol in wine: Analysis of its contents in 186 Portuguese red wines. J Agric Food Chem. 2011;59(6):2157-68.
8. Gonçalves J, Câmara JS. New method for determination of (E)-resveratrol in wine based on microextraction using packed sorbent and ultra-performance liquid chromatography. J Sep Sci. 2011;34(18):2376-84.
9. Jerkovic V, Nguyen F, Timmermans A, Collin S. Comparison of Procedures for Resveratrol Analysis in Beer: Assessment of Stilbenoids Stability through Wort Fermentation and Beer Aging. J Inst Brew. 2008;114(2):143-9. 10. Brizzi A, Brizzi V, Corradini D. Identification and Quantification of
Trans-Resveratrol in Dietary Supplements by a Rapid and Straightforward RP-HPLC Method. J Liq Chromatogr Relat Technol. 2008;31(14):2089-100. 11. Rossi D, Guerrini A, Bruni R, Brognara E, Borgatti M, Gambari R, et al.
Trans-Resveratrol in Nutraceuticals: Issues in Retail Quality and Effectiveness. Molecules. 2012;17(10):12393-405.
12. Ardelean F, Vlase L, Mocan AM, Gheldiu ANAM, Antal DS, Trandafirescu C,
et al. Dietary Supplements with Resveratrol, Flavonoids and Phenolic Acids: In-depth HPLC Profiling and Antioxidant Capacity as Quality Markers. Rev Chim. 2017;68(2):401-7.
13. Cvetkovic Z, Nikolic V, Savic I, Savic-Gajic I, Nikolic L. Development and validation of an RP-HPLC method for quantification of trans-resveratrol in the plant extracts. Hem Ind. 2015;69(6):679-87.
14. NIH-DSLD. National Institutes of Health (NIH) a joint effort of the office of dietary supplements and the national library of medicine. https://www.dsld. nlm.nih.gov/dsld/rptQSearch.jsp?item=Resveratrol&db=adsld
15. Guideline ICH. Validation of analytical procedures: text and methodology Q2 (R1). InInternational Conference on Harmonization Geneva Switzerland. 2005;11-2.
16. López-Nicolás JM, García-Carmona F. Aggregation State and pKa Values
of (E)-Resveratrol As Determined by Fluorescence Spectroscopy and UV-Visible Absorption. J Agric Food Chem. 2008;56(17):7600-5.
17. Pignatello R, Cenni E, Micieli D, Fotia C, Salerno M, Granchi D, et al. A novel biomaterial for osteotropic drug nanocarriers: Synthesis and biocompatibility evaluation of a PLGA-ALE conjugate. Nanomedicine. 2009;4(2):161-75. 18. Politis SN, Colombo P, Colombo G, Rekkas DM. Design of Experiments (DOE)
SUMMARY
An RP-HPLC method was applied for the quantifi-cation of Resveratrol in bone-targeted drug delivery system. It can also be used in various marketed RSV containing nutraceuticals maintain quality control as per regulatory requirement.
Aarti Abhishek Shah: Aarti Abhishek Shah is presently pursuing Ph.D from Manipal College of Pharmaceutical Sciences, Manipal under Women Scientist Scheme-A, (WOS-A) Department of Science and Technology. She is working on bone targeted drug delivery system for Resveratrol. The work submitted in this manuscript is a part of her Ph.D and WOS-A project. Her area of interest is biomaterials development for orthopedic use.
About Authors PICTORIAL ABSTRACT
Dr. Yogendra Nayak: Associat Professor, Department of Pharmacology, Manipal College of Pharmaceutical Sciences. He is mentor and PhD guide for the work mentioned in this manuscript under DST-WOS- A project. Has 15 years of experience in academia and research. Current interest is on osteoporosis, cancer and diabetes. Furthermore, in
silico pharmacology modelings is another
area of interest.