Assessment of wheat crop coefficient using remote
sensing techniques
Mohammed A. El-Shirbeny*1, Abd-Elraouf M. Ali2, Mahmoud A. Badr3, Esam M. Bauomy4
1*,2,3,4 National Authority for Remote Sensing and Space Sciences, Egypt
Irrigation water consumption under physical and climatic conditions for large scale will be easier with remote sensing techniques. Crop evapotranspiration (ETc) uses crop coefficient (Kc) and reference evapotranspiration (ETo). Kc plays an essential role in agricultural practices and it has been widely used to estimate ETc. In this paper Normalized Deference Vegetation Index (NDVI) used to estimate crop coefficient according to satellite data (KcSat) through simple model (KcSat = 2NDVI - 0.2). Landsat8; bands 4 and 5 provide Red (R) and Near Infra-Red (NIR) measurements and it used to calculate NDVI. Single KcFAO estimated under Egyptian conditions according to FAO 56 paper. The KcFAO used to validate KcSat. Linear relationship between KcFAO and KcSat was established and R2 was 0.96. The main objective of this paper is estimation of wheat crop coefficient using remote sensing techniques.
Keywords: Normalized deference vegetation index (NDVI), landsat8; crop evapotranspiration (ETc), Egypt and arid region.
INTRODUCTION
Determination of ETc at farm level has traditionally been made on the basis of a so called two steps approach. The evapotranspiration of a reference standard crop (ETo) is first estimated on the basis of a site meteorological variables. A semi-empirical coefficient (crop coefficient) is then applied to take into account all other crop and environmental factors (magliulo et al., 2003). ETc can be obtained from ETo using a stage-dependent Kc.
Kc based estimation of ETc is one of the most commonly used methods for irrigation water management. Kc method of FAO 56 paper can contribute to ETc estimates that are substantially different from actual crop evapotranspiration (Kamble et al., 2013; Vicente et al., 2012). Similarities between the crop coefficient curve and a satellite-derived vegetation index showed potential for modeling a crop coefficient as a function of the vegetation index (Kamble et al., 2013).
Vegetation indices (VIs) were first developed in the 1970s to monitor terrestrial landscapes by satellite sensors and have been highly successful in assessing vegetation
condition, foliage, cover, phenology, and processes related to the fraction of photosynthetically active radiation absorbed by a canopy (Huete et al., 2008; Edward et al., 2008). Tasumi and Allen (2007) reported that satellite-based remote sensing is a robust, economic and efficient tool for estimating actual ET and developing Kc curves. This technique can cover hundreds of sampled fields at a time so that large populations of ETo and Kc can be used to develop representative mean values. They used empirical equation for soil adjusted vegetation index (SAVI) to get crop coefficient through the regression analysis.
*Corresponding author: Mohammed A. El-Shirbeny, National Authority for Remote Sensing and Space Sciences (NARSS), 23 Joseph Tito St., Nozha El-Gedida, Cairo, Egypt. E-mail: [email protected], Tel.: (+202) 26251267, Fax: (+202) 26225800
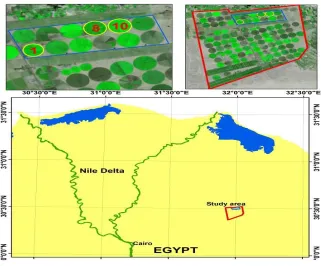
Figure 1. Showsstudy area location.
Kc = a * SAVI + b (1) Where: SAVI, is soil adjusted vegetation index, a, and b, can be determined by regression analysis.
The NDVI transformation is computed as a ratio of measured intensities in the red (R) and near infrared (NIR) spectral bands using the following formula:
NDVI = (NIR - R) / (NIR + R) (2) The resulting index value is sensitive to the presence of vegetation on the Earth's land surface and can be used to address issues of vegetation type, amount, and condition. Many satellites have sensors that measure the red and near-infrared spectral bands, and many variations on the NDVI exist. The sensor that supplies one of the most widely used NDVI products is on board the Landsat8 with channels in the red (Band 4) and near infrared (Band 5). Various studies on NDVI and LAI using remote sensing techniques were done in Egypt for agricultural sustainability purposes (Aboelghar et al., 2010; Aboelghar et al., 2011; El-Shirbeny et al., 2014a; Belal et al., 2014 and Mohamed et al., 2014). Yoder and Waring (1994) found that the sensitivity of NDVI to chlorophyll concentration varied depending on the choice of visible band used in the calculations. The visible band chosen, therefore, significantly changed the correlation between the NDVI and canopy properties. They also found that the NDVI tended to saturate as LAI increased. Satellite maps of vegetation show the density of plant growth. Very low
values of NDVI (0.1 and below) correspond to arid areas of rock, sand, or snow. Moderate values represent shrub and grassland (0.2 to 0.3), while high values indicate temperate and tropical rainforests (0.6 to 0.8).
Ryua et al. (2012) developed a temporal up-scaling scheme using satellite-derived instantaneous estimates of ET to produce a daily sum ET averaged over an 8 day interval. The main objective of this study is estimation the wheat crop coefficient using remote sensing techniques.
MATERIALS AND METHODS
Study area
El-Salhia project is located at the South Western of Ismaillia city and to the East southern of El-Kassaseen city. It is bounded by 30O 22' 02" and 30O 31' 16" latitudes
and 31O 52' 36" and 32O 06' 26" longitudes. Pivot No 1, 8
and 10 were studied (Fig. 1).
Climate Conditions
temperatures reach (34.6°C) in June. January represents the coldest month (19.0 °C). The minimum temperatures range between 8.0 °C in January to 21.5 °C in August.
Remote Sensing Data Availability
Landsat8 data (path 176/row 039) collected around 10 a.m. local time with 30 meter ground resolution, during winter season was used in current study. Landsat8 satellite data were used to calculate NDVI. The data acquired on Dec. 09th, 2013, Dec. 25th, 2013, Jan. 10th,
2014, Feb. 11th, 2014, Mar. 15th, 2014 and Mar. 31st,
2014.
NDVI and KcSat
The relation between Kc and NDVI is clear. Similarities between Kc curve and a satellite-derived vegetation index showed potential for modeling Kc as a function of the vegetation index. Therefore, the possibility of directly estimating Kc from satellite reflectance of a crop was investigated (magliulo et al., 2003). Landsat8 bands 4 and 5 provide R and NIR measurements and therefore can be used to generate NDVI data with the following formula:
NDVI = (Band 5 - Band 4) / (Band 5 + Band 4) (3) Kc used with ETo to estimate ETc. Kc is a dimensionless number (usually between 0.1 and 1.2) that is multiplied by the ETo value to calculate (ETc). The resulting ETc can be used to help an irrigation manager schedule when irrigation should occur and how much water should be put back into the soil. The relation between KcSat and
NDVI represented by equation (4) which established by (El-Shirbeny et al., 2014b).
)
2
.
0
(
6 . 0
2 .
1
−
=
NDVI
Kc
Sat (4)Where: 1.2 is the maximum Kc for wheat under Egyptian conditions; 0.6 is difference between minimum and maximum NDVI value for vegetation and 0.2 is minimum NDVI value for vegetation.
KcFAO Calculation
The Kc is defined as the ratio of ETc to ETo. It is affected
by the local climate conditions, crop characteristics, length of growing season, soil moisture and the time of planting (Doorenbos and Pruitt, 1977; Allen et al., 1998). To estimate Kc follow equation will be used:-
Kc = ETc / ETo (5) The single KcFAO is described in Allen et al. (1998), where
the effect of both crop transpiration and soil evaporation are integrated into a single crop coefficient. The Kc
incorporates crop characteristics and averaged effects of evaporation from the soil. The Kc curve for wheat represents deferent stages of crop growth. The Kc for initial stage is referred as Kcini. Similarly Kc for mid and
end stages are designated as Kcmid and Kcend
respectively. (Allen et al., 1998) tabulated the values of Kcini, Kcmid and Kcend for different crops under standard
growing conditions. Kc affects with climate conditions, so Kcini, Kcmid, and Kcend calibrated to local climate
conditions according to Allen et al., (1998) method.
RESULTS AND DISCUSSION
Normalized Deference Vegetation Index (NDVI)
Menenti (1986) used NDVI to enhance the ability to classify crops into various condition groups. Satellite data used to detect vegetation cover changing from stage to stage, growing season to next, from year to year, and from decade to decade. These information help us to understand the phonological stages for every crop or natural vegetation at large scale. NDVI calculated from Red and NIR bands in Landsat8 data which acquired on Dec. 09th, 2013, Dec. 25th, 2013, Jan. 10th, 2014, Feb.
11th, 2014, Mar. 15th, 2014 and Mar. 31st, 2014. The NDVI
values ranged from -1.0 to 1.0, where vegetated areas typically have values greater than 0.2 and less values indicate non-vegetated surface features such as water, barren, ice, snow, or clouds.
NDVI for cultivated areas vary according to crop age, planting density and chlorophyll activity. It seems like Kc varying from planting to senescence. NDVI used as input in Equation (4) to estimate Kc from satellite data. Figure (2) shows NDVI changing during the growing season.
Figure 2. Showschanging in NDVI values during growing season.
Crop coefficient (Kc)
water allocation. (Kang et al., 2003) Investigated crop coefficients and the ratio of transpiration to evapotranspiration (Tp/ETc) of winter wheat and maize based on lysimeter data for 10 years. They analyzed several relationships, Kc and days after sowing (DAS), Kc and leaf area index (LAI), and Tp/ETc and LAI. (Attarod et al., 2009) calculated Kc using the relation of AET/ETo, where; AET was the measured actual evapotranspiration (mm/d) and the ETo was the FAO reference crop evapotranspiration (mm/d), and the daily average of Kc for the winter season crops was between 1.2 and 0.2.
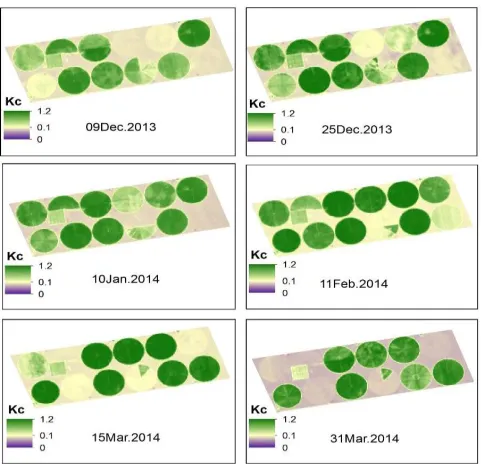
Equation NO (4) used to estimate Kc from Landsat8 data. Figure (3) shows KcSat changing during the growing
season.
Figure 3. Showschanging in KcSat values during growing season.
The Pivot NO 1 cultivated on November 11th 2013 and
average of NDVI, KcSat and KcFAO were 0.57, 0.72 and
0.80 respectively While, Pivot NO 8 cultivated on December 1st 2013 and average of NDVI, KcSat and KcFAO
were 0.49, 0.59 and 0.71 respectively.
The Pivot NO 10 cultivated on November 21th 2013 and
average of NDVI, KcSat and KcFAO were 0.55, 0.70 and
0.77 respectively. Figures 4, 5 and 6 show changing in NDVI, KcSat and KcFAO values during growing season for
Pivots 1, 8 and 10 respectively.
Crop coefficient (Kc) validation
Kc depends on stage of canopy height, crop growth, architecture and cover (Allen et al., 1998). The relation between Kc and NDVI is highly correlated. Empirical Kc have been criticized as regards their meaning and use, because their values vary according to the conditions
Figure 4. Shows changing in NDVI, KcSat and KcFAO values during
growing season for Pivot NO 1.
Figure 5. Shows changing in NDVI, KcSat and KcFAO values during
growing season for Pivot NO 8.
Figure 6. showschanging in NDVI, KcSat and KcFAO values during growing
season for Pivot NO 10.
KcFAO = 0.803*KcSat + 0.2256
R2 = 0.9647
Figure 7. Represents the relation between KcSat and KcFAO.
Table 1. Illustrates KcSat and KcFAO simple model description.
Model
Unstandardized Coefficients
Standardized
Coefficients t Sig.
B Std. Error Beta
Constant 0.226 0.030 7.407 0.000
KcSat 0.803 0.038 0.982 20.903 0.000
a. Dependent Variable: KcFAO
Exploring the regression strength of the relationship between KcSat and KcFAO, Diagram shows that the model
produced has significant correlation between the KcSat
and KcFAO. Model has R2 = 0.965 with standard error of
0.06% at KcSat (Fig. 7 and Table, 1).
CONCLUSION
Landsat8 data were acquired on Dec. 09th, 2013, Dec.
25th, 2013, Jan. 10th, 2014, Feb. 11th, 2014, Mar. 15th,
2014 and Mar. 31st, 2014. Landsat8 bands 4 and 5 used
to calculate Normalized Deference Vegetation Index (NDVI). KcSat=2*NDVI-0.2 represented the relation
between crop coefficient (Kc) and NDVI. Linear relationship between KcFAO and KcSat was established
(KcFAO = 0.803*KcSat + 0.2256) and R2 was 0.96. ACKNOWLEDGEMENT
Company, Egypt for their kind support and encouragement.
REFERENCES
Aboelghar M, Arafat S, Saleh A, Naeem S, El-Shirbeny M, Belal A. (2010). Retrieving leaf area index from SPOT4 satellite data. The Egyptian Journal of Remote Sensing and Space Science, 13(2), 121-127.
Aboelghar M, Arafat S, Abo Yousef M, El-Shirbeny M, Naeem S, Massoud A, Saleh N. (2011). Using SPOT data and leaf area index for rice yield estimation in Egyptian Nile delta. The Egyptian Journal of Remote Sensing and Space Science, 14(2), 81-89.
Allen RG, Perrier LS, Raes D, Smith M. (1998). Crop evapotranspiration: guidelines for computing crop requirements. Irrigation and drainage paper No. 56, FAO, Rome, Italy.
Attarod P, Aoki M, Bayramzadeh V, (2009). Measurements of the actual evapotranspiration and crop coefficients of summer and winter seasons crops in Japan, Plant Soil Environ., 55: 121-127.
Belal AA, El-Ramady HR, Mohamed ES, Saleh AM. (2014). Drought risk assessment using remote sensing and GIS techniques. Arabian Journal of Geosciences, 7(1): 35-53.
Doorenbos J, Pruitt WO. (1977). Crop water requirement: food and agriculture organization of the United Nations, FAO Irrigation and Drainage Paper 24, Rome, 144. Edward PG, Huete AR, Nagler PL, Nelson SG. (2008).
Relationship between Remotely sensed Vegetation Indices, Canopy Attributes and Plant Physiological Processes: What Vegetation Indices Can and Cannot Tell Us about the Landscape, Sensors, 8: 2136-2160. El-Shirbeny MA, Aboelghar MA, Arafat SM, El-Gindy
AGM. (2014a). Assessment of the mutual impact between climate and vegetation cover using NOAA-AVHRR and Landsat data in Egypt. Arabian Journal of Geosciences, 7(4), 1287-1296.
El-Shirbeny MA, Ali AM, Saleh NH. (2014b). Crop Water Requirements in Egypt Using Remote Sensing Techniques. Journal of Agricultural Chemistry and Environment, 3: 57.
Huete A, Didan K, Leeuwen W, Miura T, Glenn, E. (2008). MODIS vegetation indices. In Land Remote Sensing and Global Environmental Change, NASA’s Earth Observing System and the Science of ASTER and MODIS.
Kamble B, Kilic A, Hubbard K. (2013). Estimating Crop Coefficients Using Remote Sensing-Based Vegetation Index. Remote Sens. 5, no. 4: 1588-1602. DOI: 10.3390/rs5041588.
Kang S, Gu B, Du T, Zhang J. (2003). Crop coefficient and ratio of transpiration to evapotranspiration of winter
wheat and maize in a semi-humid region. Agricultural water management, 59(3): 239-254.
Kashyap PS, Panda RK. (2001). Evaluation of evapotranspiration estimation methods and development of crop-coefficients for potato crop in a sub-humid region. Agricultural Water Management, 50: 9-25. doi:10.1016/S0378-3774(01)00102-0
Magliulo V, d’Andria R, Rana, G. (2003). Use of the modified atmometer to estimate reference evapotranspiration in Mediterranean environments, Agricultural Water Management, 63: 1-14.
Menenti M. (1986). Physical aspects of determination of evaporation in deserts applying remote sensing techniques, Report no. 10, Instıtute of Land and Water Management Research: Wageningen, the Netherlads. Mohamed ES, Saleh AM, Belal AA. (2014). Sustainability
indicators for agricultural land use based on GIS spatial modeling in North of Sinai-Egypt. The Egyptian Journal of Remote Sensing and Space Science, 17(1): 1-15. Ryua SY, Baldocchi DD, Black TA, Dettoc M, Lawd BE,
Leuninge R, Miyataf A, Reichsteing M, Vargash R, Ammanni C, Beringer J, Flanagank LB, Gul L, Hutleym LB, Kimn J, McCaugheyo H, Moorsp EJ, Rambal S, Vesalar T. (2012). On the temporal upscaling of evapotranspiration from instantaneous remote sensing measurements to 8-day mean daily sums, Agricultural and Forest Meteorology, 152: 212-222.
Tasumi M, Allen RG. (2007). Satellite-based ET mapping to assess variation in ET with timing of crop development, agricultural water management, 88: 54-62.
Vicente PR, daSilva CJR, Borges C.HA, Farias VPS, Walker GA, Bernardo BS. (2012). Water requirements and single and dual crop coefficients of sugarcane grown in a tropical region, Brazil, Agricultural Sciences, 3(2): 274-286. http://dx.doi.org/10.4236/as.2012.32032. Yoder BJ, Waring RH. (1994). The normalized difference
vegetation index of small Douglas fir canopies with varying chlorophyll concentrations, Remote Sensing of Environment, 49: 81-91.
Accepted 01 September, 2014.
Citation: El-Shirbeny MA, Ali AM, Badr MA, Bauomy EM (2014). Assessment of wheat crop coefficient using remote sensing techniques. World Research Journal of Agricultural Sciences 1(2): 012-016.