Assessment of Risk Function Using Analytical Network Process
Darja Stepchenko, Irina Voronova
Riga Technical University
Kalnciema st. 6, LV-1048, Riga, Latvia
E-mail. [email protected], [email protected]
http://dx.doi.org/10.5755/j01.ee.26.3.8736
The concept of this paper is to perform the improvement of the risk function analysis, assessment and management with the aim to ensure a more sensitive and sophisticated risk coverage in accordance with the Solvency II regime requirements. The authors have offered an approach of risk function implementation and management corresponding with the Solvency II framework by integrating the Analytic Network Process into decision-making process of an insurance company. The most valuable advantage of using the Analytic Network Process in insurance is the possibility to include tangible and intangible strategic factors and elements into the decision-making process of an insurance company by applying specified functions or fields steering, analysis and management. Moreover, the authors have prepared the case study about the practical usage of the Analytic Network Process through the example of one non-life insurance company. In the case study, the authors have emphasized the most preferable strategy through a detailed analysis of risk function by using the Analytic Network Process. According to the authors, the Analytic Network Process is considered to be part of the risk culture of an insurance company, since it helps to increase the employees’ knowledge of risk nature and its influence on the development and results of an insurance company.
Keywords: risk function, SWOT analysis, Analytic Hierarchy Process, Analytic Network Process, the Solvency II Directive.
Introduction
The authors of the paper are concentrated on the choice of a business strategy based on risk management principles using the Analytic Network Process. The choice of the Analytic Network Process is proposed with the purpose to improve the decision-making process in a company through enhancement of an insurance company’s risk culture. The Solvency II Directive has been under constant development for many ages due to the necessity of new approaches to ensure a more sensitive, balanced, and sophisticated risk coverage. The new regime requirements demand changing the way of decision-making in business though alterations in every process of an insurance company. In accordance with the Solvency II Directive’s requirements, the insurance companies of the European Union should establish an effective risk evaluation system with the aim to ensure policyholders interest safety and the ability to prosper within the tough market environment. The Hypothesis of the article comprises the idea, which implies that an insurance company’s activity can be improved by amending of risk management principles according to Solvency II Directive’s main requirements. The concept of the paper is to propose a short-term solution for improvement of decision-making in an insurance company through strengthening of risk culture. The object of the paper is risk function. Therefore, the subject is assessing risk function using Analytic Network Process. In order to achieve the stated objective, the authors use theoretical and methodological analysis of the scientific literature, the Analytic Hierarchy Process, the Analytic Network Process, and the experts’ method as well as comparative methods with the purpose to investigate the main components of risk management and establish proper
risk culture and decision-making process in insurance. The main issue within the process of conducting the research was to interconnect risk management and decision-making process for the insurance company. The article consists of three main sections. The overview of proposed improvement of the risk culture and decision-making approach is presented in Section 1. In Section 2 the authors of the paper introduce the case study of enhancement of decision-making in an insurance company through strengthening of the risk culture. The final section summarizes the findings and conclusions of the research and assesses the improvement of risk evaluation.
Improvement of Desicion Making-Process Using
Risk Management
The Analytic Network Process is the combination of SWOT (the acronym standing for Strengths, Weaknesses, Opportunities and Threats) analysis and choice of a business strategy which helps to ensure further successful development and financial stability of an insurance company. The Analytic Network Process allows measuring the dependencies and feedbacks among decision elements and strategic factors in the hierarchical or non-hierarchical structures; thus, it might be used within the analysis of complicated and sensitive interrelationships between decision levels and attributes. The Analytic Network Process can also be defined as combination of the Analytic Hierarchy Process and SWOT that allows including tangible and intangible strategic factors and elements into the decision-making process of an insurance company by applying specified functions or fields steering, analysis and management. According to scientific definitions, Strengths, Weaknesses, Opportunities, and Threats (SWOT) analysis is a commonly used instrument which scans internal strengths and internal weaknesses of a product or service industry and highlights the opportunities and threats of the external environment (Pesonen et al., 2000; Rauch, 2007). In addition, SWOT can be explained as widely applied tool in the analysis of internal and external environments in order to achieve a systematic approach and support for strategic decision situations (Kangas et al., 2001). The Analytic Hierarchy Process is a theory which comprises expert evaluation measurement by means of pairwise comparisons according to derive priority scales. The scales measure intangibles in relative terms. The Saaty hierarchy method measures how much one element dominates another with respect to the given attribute (Stepchenko et al., 2014). Moreover, the Analytic Hierarchy Process is defined as a multicriteria decision-making technique that can help express the general decision operation by decomposing a complicated problem into a multilevel hierarchical structure of objective, criteria and alternatives (Sharma et al., 2008). The combination of the Analytic Hierarchy Process and SWOT analysis sets strong basis for assessing the existing situation and applying most valuable development strategy in a simpler and more efficient way.
The introduced technique was used in many areas, such as tourism (Vasantha Wickramasinghe et al., 2009; Kajanus et al., 2004), forest and park services (Kurtilla et al., 2001; Pesonen et al., 2000; Leskinen et al., 2006; Masozera et al., 2006), project management (Stewart et al., 2002), agriculture (Shrestha et al., 2004), manufacturing (Shinno et al., 2006), household appliances industry (Dehghanan et al., 2014), tannery industry (YaniIriani, 2012), sport marketing outsourcing (Lee et al., 2011), fishing industry (Poursheikhali et al., 2014), textile industry (Yuksel et al., 2007), selection in maritime transportation industry (Kandakoglu et al., 2009), water resources management (Gallego et al., 2011), information system outsourcing (Wang et al., 2007).
Analytic Network Process was firstly introduced by Thomas Saaty (Saaty, 1996) in his work regarding the decision-making based on multicriteria assessment that applies network structures with dependences and feedbacks among specific elements of decision-making process by arranging them in a hierarchical structure with the aim to evaluate the relative importance of pairs of elements and
synthesize the results. While the Analytic Hierarchy Process represents a framework with a uni-directional hierarchical relationship, the Analytic Network Process allows for complex interrelationships among decision levels and attributes (Yuksel et al., 2007). The fact is that the attracted experts perform evaluation of concrete elements using Saaty scales from 1 to 9 (Saaty, 2001) by means of pairwise comparisons according to the derived priority scales that measure intangibles in relative terms. Experts have to measure how much one element dominates another with respect to the given attribute. Based on the algorithm of the Analytic Network Process in insurance, the experts’ evaluation should be confirmed by calculation of CI (the acronym standing for consistency index) (see Formula 1) or CR (the acronym standing for consistency ratio) (see Formula 2), RI (the acronym standing for random index) (see Formula 3).
), 1 /( )
( max
n n
CI ………(1)
, /RI CI
CR ………(2)
, / )) 2 ( 98 .
1 n n
RI ………(3)
where as
are main eigenvalues of matrix. If matrix returns to a positive value, then n - comparable elements.
However, there is the possibility to use random ratio based on Saaty performed research. During the research 500 random reciprocal n xn matrices were generated for n = 3 to n = 15 using the 1 to 9 scale (Saaty, 2009). During the case study, the authors use the random index values, investigated by Saaty (Saaty, 2001).
Actually, the Analytic Network Process can serve to improve the risk culture in every insurance company due to the attraction of different key employees, particularly from management side, into SWOT factors and alternative development strategy evaluation and result interpretation. The interpretation of the risk culture is presented in Figure 1.
Figure 1. Risk culture interpretation (created by the authors;
based on Stepcenko et al., 2012–2014; Ernst &Young, 2012;
European Insurance and Occupational Pensions Authority, 2008– 2010).
The interconnection between the Analytic Network Process and risk culture is presented in Figure 1, since the Analytic Network Process helps to educate the key employees (including members of the Board) in risk nature understanding, establishment of a risk strategy and risk profile. The authors agree on the fact that risk culture can be defined as the norms and traditions of behavior of
individuals and of groups within an organization that determine the way in which they identify, understand, discuss and act on the risks the organization confronts and takes (Towers Watson, 2011). The authors consider the risk culture of every insurance company to be the heart of ORSA (the acronym standing for Own risk and Solvency assessment). The authors have created the algorithm for the
Analytic Network Process application in the insurance industry in order to ensure proper decision-making process based on the core principles of risk management, to eliminate possible risk of the insurance company, and to improve its development, profit and financial results. The proposed algorithm is presented in Figure 2.
Figure 2. Algorithm for using the Analytic Network Process in insurance business (created by the authors, based on Comite Europeen
des Assurances and the Groupe Consultatif Actuariel Europeen, 2007; Stepcenko et al., 2013–2014; PricewaterhouseCoopers International
Limited, 2010; Saaty, 1980–2005; Towers Watson, 2013)
The Analytic Network Process allows measuring the dependency among strategic factors similar to SWOT factors that affect weights of its factors and sub-factors with the aim to choose the strategy priorities. Moreover, the authors suggest using the Analytic Network Process to evaluate alternative development strategies, since it could help ensure a clear understanding of the received results and deeper assessment of possible strategy impact on insurance company’s development based on the appropriate and more sophisticated analysis of risk nature. The authors also see the possibility of usage of Analytical Network Process in banking and investment industries to improve decision-making through risk analysis.
Case Study: Analytic Network Process in
Insurance
The Analytic Network Process should be applied to the insurance industry in order to ensure proper decision-making process based on the core principles of risk management, to eliminate possible risk of the insurance company, and to improve its development, profit and financial results. The authors of the paper have performed the case study based on one insurance company example, which operates in the Baltics. The case study is performed in line with the algorithm presented in Figure 2. During the research conducted in 2014, key employees with the professional
1. Attra ction of expe
rts
• 1.1. Atraction of the experts
• 1.2. Introduction of Saaty scales and nature of main insurance risk
3. Assess
ment of insura
nce risk
• 3.1. Grouping risk under SWOT internal and external factors • 3.2. Identification of SWOT sub-factors
• 3.3.Determining possible alternative strategies (Strengths/Opportunities, Weaknesses/Threats, Strengths/Threats, Weaknesses/Opportunities), based on SWOT sub-factors
2. Anal
ysis of risk
• 2.1. Risk catalogue creation • 2.2. Risk sub-risk identification
4. SWO
T factor
s evalu ation
• 4.1. Experts determination of factors importance with Saaty scales, assuming no dependence among the SWOT factors
• 4.2. Calculate the importance of each factor using its geometric mean (w1)
• 4.3. Check the conformity of experts' assessment by calculating consistency index (CI), or consistency ratio (CR), and random index (RI)
• 4.4. If consistency ratio is less than 10 % you can say about the conformity of experts’ view. If consistency ratio is more than 10 % that you can say about the nonconformity of experts’ view. Additional experts’ evaluation is needed (repeat from step 4.1).
5. SWO
T sub-facto rs evalu ation
• 5.1. Experts determination of sub-factors importance with Saaty scales, assuming inner dependence among the SWOT sub-factors • 5.2. Calculate the importance of each sub-factor using its geometric mean (wsubf1)
• 5.3. Check the conformity of experts' assessment by calculating consistency index (CI), or consistency ratio (CR), and random index (RI) • 5.4. If consistency ratio is less than 10% you can say about the conformity of experts’ view. If consistency ratio is more than 10 % that you
can say about the nonconformity of experts’ view. Additional experts’ evaluation is needed (repeat from step 5.1).
6. Resu
lts proce ssing
• 6.1. Calculate inner dependence among SWOT factors (w2)
• 6.2. Evaluate the interdependent priorities of the SWOT factors using formula: wf = w2 × w1
• 6.3.Determine total importance degrees of the SWOT sub-factors with formula wsubf= wsubf1 × wf
7. Choi ce of alter nativ e risk strate gy
• 7.1. Experts determination of alternative strategies importance with respect to each SWOT sub-factor using Saaty scales
• 7.2. Calculate the importance of each alternative strategy, using its geometric mean (wstr1)
• 7.3. Check the conformity of experts' assessment by calculating of consistency index (CI), or consistency ratio (CR), and random index (RI)
• 7.4. If consistency ratio is less than 10% you can say about the conformity of experts’ view. If consistency ratio is more than 10 % you can say about the nonconformity of experts’ view. Additional experts’ evaluation is needed (repeat from step 7.1).
• 7.5. Determine total priorities of the alternative development strategies, which reflect the interrelationship between the SWOT factors with
experience of at least two years from different fields of an insurance company have been attracted: risk measurement, actuarial, underwriting and control areas. In the case study, the experts’ evaluation was performed using a consensus approach (Saaty, 1980) in focus group; however, it is also possible to use an average mean approach of all experts’ evaluation with the different or similar experts’ priorities. The conducted research has approved the possibility of
using the Analytic Network Process in insurance. According to the presented algorithm, its 1st, 2nd and 3rd stages should be based on experts’ discussions, therefore results should be assessed with experts and priority charts methods. However, the consistency ratio should be calculated in order to prove the results based on experts’ discussions. During the case study the experts’ discussions were performed with aim to identify sub-factors of SWOT (see Table 1).
The results of the algorithm’s 4th stage are presented in Table 2 and Table 3.
Table 2
SWOT matrix factors evaluation using Saaty scales (created by the authors)
SWOT factors
Total w1
S W O T
S 1,0 2,0 3,0 2,0 1,9 42 %
W 0,5 1,0 2,0 3,0 1,3 29 %
O 0,3 0,5 1,0 0,5 0,5 12 %
T 0,5 0,3 2,0 1,0 0,8 17 %
Table 3
Experts‘ conformity check for SWOT matrix factors evaluation (created by the authors)
Based on Table 3 the authors can make a conclusion that experts’ evaluation of SWOT factors using Saaty scales can be confirmed, since the consistency ratio is less than 10 %. The SWOT sub-factors evaluation from described above algorithm is also performed by the authors: strength sub - factors evaluation presented in Table 4 and Table 5; weaknesses sub-factors evaluation - in Table 6 and Table 7; opportunities sub-factors evaluation - in Table 8 and Table 9; threats sub-factors evaluation - in Table 10 and Table 11.
Table 4
Strengths factors evaluation using Saaty scales (created by the authors)
SWOT factors
Total Wsubf1
S1 S2 S3 S4 S5
S1 1,0 2 0,5 2,0 0,5 1,0 18 %
S2 0,5 1,0 0,5 2,0 2,0 1,0 18 %
S3 2,0 2,0 1,0 3,0 2,0 1,9 34 %
S4 0,5 0,5 0,3 1,0 0,3 0,5 8 %
S5 2,0 0,5 0,5 4,0 1,0 1,1 21 %
Table 5
Experts‘ conformity check for strengths factors evaluation (created by the authors)
Table 6
Weaknesses factors evaluation using Saaty scales (created by the authors)
SWOT factors
Total Wsubf1
W1 W2 W3 W4 W5
W1 1,0 3,0 4,0 3,0 2,0 2,4 41 %
W2 0,3 1,0 2,0 0,5 2,0 0,9 16 %
W3 0,3 0,5 1,0 0,3 0,5 0,4 8 %
W4 0,3 2,0 4,0 1,0 0,5 1,1 18 %
W5 0,5 0,5 2,0 2,0 1,0 1,0 17 %
Table 1
SWOT matrix of an insurance company (created by the authors)
Strengths Weaknesses
S1. Improvement of the strategic and financial planning W1. Challenges to create the operation independence in decision-making
S2. Improvement of the decision-making W2. Challenges in communication with management board
S3. Correct and proper definition of risk appetite, risk tolerance and risk limits
W3. Challenges in calculations and in the assessment of limitations either it is standard or internal model
S4. Implementation of stress testing W4. Challenges with manning skills and knowledge, "right person in right
place"
S5. Improvement of culture in risk management W5. Challenges to create a model that can completely follow up to risk
dynamic nature in changing market situation
Opportunities Threats
O1. Allows to reduce risk on acceptable level ensuring cost saving actions, improving the underwriting results
T1. Lack of risk diversification that requires too high risk capital can lead to increase of mergers that can negatively influence market concentration level O2. By achieving risk reduction in controlled way possibility for higher
growth in selected LoB and segments
T2. EIOPA can change the Solvency II requirements that can lead to additional costs
O3. Product redesign to achieve management targets T3. The cost of holding extra capital required by new regime will force
prices to increase, particularly in annuity market that will negatively influence the demand for insurance
O4. Strong governance ensure process quality and efficiency to increase sales results
T4. The new regime requirements can make EU insurance companies less competitive against insurance companies abroad because of high implementation costs and high risk capital requirements
O5. Transparency to ensure the policyholders regarding their safety will lead to positive impact on brand and reputation of the insurance company that can allow increasing sales volumes
T5. A limited number of insurance companies can go bankrupt because of too high capital putted into the risk that can lead to industry monopolization
Ratio
max
CI CR (based onRI)
CR (RI = 0.89)
Value 4,1638 0,0546 5,52 % 6,14 %
Ratio
max
CI CR (based on RI) CR (RI = 1,11)Table 7
Experts‘ conformity check for weaknesses factors evaluation (created by the authors)
Table 8
Opportunities factors evaluation using Saaty scales (created by the authors)
SWOT factors
Total Wsubf1
O1 O2 O3 O4 O5
O1 1,0 0,5 2,0 0,5 0,5 0,8 14 %
O2 2,0 1,0 2,0 2,0 2,0 1,7 32 %
O3 0,5 0,5 1,0 0,5 0,5 0,6 11 %
O4 2,0 0,5 2,0 1,0 2,0 1,3 24 %
O5 2,0 0,5 2,0 0,5 1,0 1,0 19 %
Table 9
Experts‘ conformity check for opportunities factors evaluation (created by the authors)
Ratio
max
CI CR (based on RI) CR (RI = 1.11)
Value 5,1947 0,0487 4,10 % 4,39 %
Table 10
Threats factors evaluation using Saaty scales (created by the authors)
SWOT factors
Total Wsubf1
T1 T2 T3 T4 T5
T1 1,0 0,5 0,5 0,5 2,0 0,8 14 %
T2 2,0 1,0 0,5 0,3 2,0 0,9 17 %
T3 2,0 2,0 1,0 0,5 2,0 1,3 24 %
T4 2,0 3,0 2,0 1,0 2,0 1,9 35 %
T5 0,5 0,5 0,5 0,5 1,0 0,6 11 %
Table 11
Experts‘ conformity check for threats factors evaluation (created by the authors)
All experts’ evaluations of SWOT sub-factors have been approved with the consistency ratios that are less than 10 % (see Tables 5, 7, 9, 11).
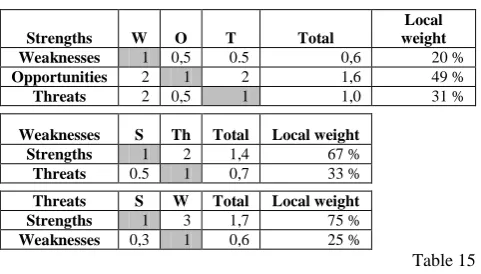
Based on described 6th stage of the algorithm (presented in Figure 2), the authors have calculated interdependent priorities of the SWOT factors (see Table 13) and total importance degrees of the SWOT sub-factors (see Table 12). Detailed explanation how to calculate w2 matrix is presented in Table 14.
With the assistance of the responsible attracted experts, the alternative development strategies of an insurance company were determined and presented in Table 15.
Table 12
Overall importance degrees of the SWOT sub-factors (created by the authors)
SWOT Group Group Priority SWOT sub-factors Sub-factor Priority within
the Group via AHP
Overall Priority of sub –factor
(wsubf)
S tr en g th s 43 %
S1 18,2 % 4,5 %
S2 18,2 % 4,5 %
S3 34,3 % 8,6 %
S4 8,4 % 2,1 %
S5 20,9 % 5,2 %
W
ea
k
n
esses 21 %
W1 40,8 % 10,2 %
W2 16,0 % 4,0 %
W3 7,5 % 1,9 %
W4 18,4 % 4,6 %
W5 17,3 % 4,3 %
O p p o rt u n it ie s 16 %
O1 14,1 % 3,5 %
O2 32,3 % 8,1 %
O3 10,7 % 2,7 %
O4 24,5 % 6,1 %
O5 18,5 % 4,6 %
Th
re
at
s
20%
T1 13,9 % 3,5 %
T2 16,9 % 4,2 %
T3 24,2 % 6,0 %
T4 34,6 % 8,6 %
T5 10,5 % 2,6 %
Table 13
Calculation of interdependent priorities of the SWOT factors (created by the authors)
w2 w1 wf
1,000 0,667 1,000 0,750 0,416 0,430
wf = 0,196 1,000 0,000 0,250 × 0,294 = 0,209
0,493 0,000 1,000 0,000 0,120 0,163
0,311 0,333 0,000 1,000 0,170 0,198
Table 14
Detailed calculation of w2 matrix (created by the authors)
Strengths W O T Total
Local weight
Weaknesses 1 0,5 0.5 0,6 20 %
Opportunities 2 1 2 1,6 49 %
Threats 2 0,5 1 1,0 31 %
Weaknesses S Th Total Local weight
Strengths 1 2 1,4 67 %
Threats 0.5 1 0,7 33 %
Threats S W Total Local weight
Strengths 1 3 1,7 75 %
Weaknesses 0,3 1 0,6 25 %
Table 15
Description of alternative development strategies (created by the authors)
Alternative development strategies
S – O S –T W - T W- O
Growth strategy: to ensure strong governance to allow strong growth in more profitable market segments Growth/Profit ability strategy: by correct definition of risk profile ensure moderate growth and strong risk ratio outcome Profitability strategy: low growth and only in LoB and segment with expected strong combined ratio outcome to improve the identified internal weaknesses. Balanced strategy: product redesign helps to achieve the lower risk ratio outcome Ratio max
CI CR (based on RI) CR (RI = 1.11)Value 5,4091 0,1023 8,61 % 9,21 %
Ratio
max
CI CR (based onRI)
CR (RI = 1.11)
In order to determine total priorities of the alternative development strategies (wstr), reflecting the
interrelationships within the SWOT factors, importance of alternative development strategies (wstr1) and the experts’
evaluation conformation was performed using Analytic Hierarchy Process and then integrated with SWOT sub-factors importance (wsubf) in similar way as described in the
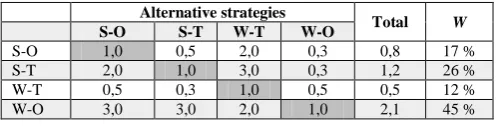
algorithm. Thus, the summary of total priorities of alternative development strategies based on the Analytic Network Process and Analytic Hierarchy Process (can be found in Table 16 and table 17) is presented in Table 18.
Table 16
Alternative strategies evaluation using saaty scales based on analytic hierarchy process (created by the authors)
Alternative strategies
Total W
S-O S-T W-T W-O
S-O 1,0 0,5 2,0 0,3 0,8 17 %
S-T 2,0 1,0 3,0 0,3 1,2 26 %
W-T 0,5 0,3 1,0 0,5 0,5 12 %
W-O 3,0 3,0 2,0 1,0 2,1 45 %
Table 17
Experts ‘conformity check for alternative strategies priorities evaluation (created by the authors)
Ratio
max
CI CR (based on RI) CR (RI = 0,89)Value 4,2583 0,0861 8,70 % 9,67 %
Table 18
Summary of priorities of alternative strategies based on the Analytic Network Process and Analytic Hierarchy Process
(created by the authors)
Strategy
ANP AHP
Priority Weights Priority Weights
Growth strategy 22 % 3 17 % 3
Growth/Profitability strategy
32 % 2 26 % 2
Profitability strategy
13 % 4 12 % 4
Balanced strategy 33 % 1 45 % 1
Based on the experts’ evaluation, the most preferable strategy is a balanced strategy that can ensure stable and long-term solvent development of the insurance company. The authors have concluded that both methods in the particular case gave similar results, however, the importance priorities are different among alternative development strategies, which can lead to varied conclusions. Moreover, the authors suggest using Analytic Network Process in the process of evaluation of alternative development strategies, since it can help ensure clear understanding of received results and deeper assessment of possible strategies impact on insurance company’s development based on risk nature analysis.
Conclusion
Risk dynamic nature in the changing market conditions sets a lot of challenges to every company. Therefore, new approaches to follow up risk nature with the aim to understand their possible impact on financial stability and further development should be implemented. In insurance, it is worth mentioning that the new Solvency II regime’s requirements, which will soon come in force, require new principles for risk evaluation in order to ensure solvency of every insurance company in the countries of the European Union, which might create additional problems for an insurer.
The authors introduce the Analytic Network Process possible usage in insurance to ensure the proper preference of the development strategy based on risk nature understanding.
The Analytic Network Process allows measuring the dependency among strategic factors similar to SWOT factors that observe impact on weights of its factors and sub-factors with the aim to choose the strategy priorities. In fact, it can help to improve the decision-making process in an insurance company.
The authors also propose to use the Analytic Network Process as a possibility to evaluate the risk culture of an insurance company therefore fulfilling the ORSA requirements because of several reasons:
to improve the knowledge in understanding in the risk nature of key employees and members of the board;
to start the discussion within an insurance company regarding the Solvency II Directive’s challenges and possible impact on an insurance company activity;
to implement strong system of governance in an insurance company’s processes.
Within the research, the authors have also proposed the algorithm for usage of the Analytic Network Process in insurance business and performed the case study based on the proposal. Also, the authors suggest the usage of the Analytical Network Process in banking and investment areas since the solvency requirements and challenges regarding the risk analysis of those industries are similar to insurance.
The suggested approach of improvement of the risk culture and decision-making within an insurance company in short-term will enable every insurance company to control trends within their development towards the solvency and will introduce a deeper understanding of risk nature which, in its turn, will allow to follow the Solvency II Directive requirements and establish a more sophisticated and sensitive risk evaluation in future. In future, the authors plan to continue the present research on an insurance company’s risk evaluation.
References
Comite Europeen des Assurances and the Groupe Consultatif Actuariel Europeen. (2007). Solvency II Glossary.
Ernst & Young. (2012). Progress in financial services risk management. Available from internet: http://www.ey.com/Publication/vwLUAssets /Banking_and_financial_services_risk_management_survey_2012/$FILE/ Progress_in_financial_services_risk_management.pdf.
European Insurance and Occupational Pensions Authority. (2008). Final Report on Public Consultation No. 11/008on the Proposal for Guidelines on Own Risk and Solvency Assessment,” 2008. Available from internet: https://eiopa.europa.eu/ fileadmin/tx_dam/files/Stakeholder_groups/opinionsfeedback/IRSG_Final_Report_CP08_ORSA.pdf.
European Insurance and Occupational Pensions Authority. (2008). Own risk and solvency assessment (ORSA). Available from internet: https://eiopa.europa.eu/fileadmin/tx_dam/files/consultations/IssuesPaperORSA .pdf.
European Insurance and Occupational Pensions Authority. (2010). Technical specification for Quantitative impact study 5. Available from internet: https://eiopa.europa.eu/fileadmin/tx_dam/files/consultations/QIS/QIS5/QIS5technical_ specifications_20100706.pdf.
Gallego, A., & Juizo D. (2011). Strategic implementation of integrated water resources management in Mozambique: An A’WOT analysis. Physics and Chemistry of The Earth, 01/2011, 202. http://dx.doi.org/10.1016/j.pce.2011.07.040 Kajanus, M., Kurttila, M., & Kangas, M. (2004). The use of value focoused thinking and the A WOT hybrid method in tourism
management. Tourism Management 25, 499–506. http://dx.doi.org/10.1016/S0261-5177(03)00120-1
Kandakoglu, A., Celik, M., & Akgun, I. (2009). A multi-methodological approach for shipping registry selection in maritime transportation industry. Mathematical and Computer Modelling, 49(12), 586–597. http://dx.doi.org/ 10.1016/ j.mcm.2008.09.001
Kangas, M., Pesonen, M., Kurttila, M., & Kajanus, M. (2000). Utilizing the analytic hierarchy process (AHP) in SWOT analysisa hybrid method and its application to a forest-certification case. Forest Policy and Economics, 1, 41–52. http://dx.doi.org/10.1016/S1389-9341(99)00004-0
Kangas, M., Pesonen, M., Kurttila, M., & Kajanus, M. (2001). A'WOT: Integrating the AHP with SWOT Analysis. 6th ISAHP 2001 Proceedings, Berne, Switzerland, 189–198.
Kangas, M., Pesonen, M., Kurttila, M., Kajanus, M., & Heinonen, P. (2001). Assessing the priorities using A WOT among resource management strategies at the Finnish forest and park service. Forest Science, 47, 534–541.
Lee, S., & Walsh, R. A. (2011). SWOT and AHP hybrid model for sport marketing outsourcing using a case of intercollegiate sport. Sport Management Review, 14, 361–369. http://dx.doi.org/10.1016/j.smr.2010.12.003
Leskinen, L., Leskinen, P., Kangas, M., Kurttila, M., & Kajanus, M. (2006). Adapting modern strategic decision support tools in the participatory strategy process - a case study of a forest research station. Forest Policy and Economics, 8, 267–278 http://dx.doi.org/10.1016/j.forpol.2004.06.007
Leskinen, P. (2000). Measurement scales and scale independence in the Analytic Hierarchy Process. Journal of Multi-Criteria Decision Analysis, 9, 163–174 http://dx.doi.org/10.1002/1099-1360(200007)9:4<163::AID-MCDA274>3.0.CO;2-L Masozera, M., Alavalapati, J. R., Jacobson, S. K., & Shrestha, R. K. (2006). Assessing the suitability of community-based
management for the Nyungwe Forest Reserve. Rwanda Forest Policy and Economics, 206–216. http://dx.doi.org/10. 1016/j.forpol.2004.08.001
Official Journal of the European Union. (2009). Solvency II framework. Available from internet: http://eurlex.europa.eu/ LexUriServ/LexUriServ.do?uri =OJ:L:2009:335:0001:0155:en:PDF.
Poursheikhali, S. P., Kord, R. A., & Varandi, A. N. (2014). Strategic analysis of the fishing industry in Iran with a combined approach OF AHP and SWOT. Spectrum: A Journal of Multidisciplinary Research, 3, 183–197.
PricewaterhouseCoopers International Limited. (2010). The survivors’ guide to Solvency II. Available from internet: http://www.pwc.com/en_GX/gx/insurance/ event/rendezvous/assets/survivors-guide-solvency-2.pdf.
Rauch, P. (2007). SWOT analyses and SWOT strategy formulation for forest owner cooperations in Austria. Eur J Forest Res, 126, 413–420 http://dx.doi.org/10.1007/s10342-006-0162-2
Saaty, T. (1980). The Analytic Hierarchy Process. McGraw-Hill, New York.
Saaty, T. (1991). Prediction, Projection and Forecasting. Kluwer Academic, Boston. http://dx.doi.org/10.1007/978-94-015-7952-0
Saaty, T. (1996). Decision Making with Dependence and Feedback: The Analytic Network Process. RWS Publications, Pittsburgh.
Saaty, T. (1996). Decision Making with the Analytic Network Process. Springer, USA. Saaty, T. (2001). Decision Making for Leaders. RWS Publications, Pittsburgh.
Saaty, T. (2005). Theory and Applications of the Analytic Network process: Decision Making with Benefits, Opportunities, Costs, and Risks,” RWS Publications, Pittsburgh.
Shinno, H., Yoshioka, H., Marpaung, S., & Hachiga, S. (2006). Quantitative SWOT analysis on global competitiveness of machine tool industry. Journal of Engineering Design, 17, 251–258. http://dx.doi.org/10.1080/09544820500275180 Shrestha, R., Alavalapti, R., & Kalmbacher, R. (2004). Exploring the potential for silvopasture adoption in south-central Florida:
an application of SWOT-AHP method. Agriculture Systems, 81, 185–199. http://dx.doi.org/10.1016/j.agsy.2003.09.004 Stepcenko, D., & Voronova, I. (2012). Risk Management as a Tool to Improve the Reliability: Case of Insurance Company.
Journal of Social Science, 2(7), 48–56. Available from internet: http://www.ku.lt/leidykla/files/ 2012/09/Regional_ formation_27.pdf.
Stepcenko, D., & Voronova, I. (2012). Ways of improving risk management function in insurance companies. Business and management. Selected papers. Vilnius: VGTU Press “Technika”, 92–99.
Stepcenko, D., & Voronova, I. (2013). Risk Management Improvement under Solvency II. RTU Press, ISSN1407-7337.
Stepcenko, D., & Voronova, I. (2014). Operational Risk Effect on Insurance Market. Available from internet: https://cas.confex.com/cas/ica14/webprogram/Session5820.html
Stewart, R., Mohamed, S., & Daet, R. (2002). Strategic implementation of IT/IS projects in construction: a case study. Automation in Construction, Vol. 11, 681-694. http://dx.doi.org/10.1016/S0926-5805(02)00009-2
Towers Watson. (2011). Insights: Own risk and Solvency assessment. Available from internet: http://www.towerswatson.com/ en-ZA/Insights/Newsletters/Europe/solvency-ii/2011/Insights-Own-Risk-and-Solvency-Assessment-ORSA.
Towers Watson. (2013). Risk Appetite revised. Available from internet: http://www.towerswatson.com/en/ Insights/IC-Types/Survey-Research-Results/2013/08/Risk-Appetite-An-Essential-Element-of-ERM.
Wang, J., & Yang, D. (2007). Using a hybrid multi-criteria decision aid method for information systems outsourcing. Computers & Operation Research, 34(12), 3691–3700. http://dx.doi.org/10.1016/j.cor.2006.01.017
Wickramasinghe, V., S. Takano, S. (2009). Application of combined SWOT and Analytic Hierarchy process (AHP) for tourism revival strategic marketing planning: A case of Sri Lanka tourism. Journal of the Eastern Asia Society for Transportation Studies, Vol.8.
YaniIriani. (2014). Strategic Management of Enterprises in the Tannery Industry: By an Integrated Deployment of SWOT Analysis and AHP Method. InternationalJournal of Science and Research, 3(6), 301–30.
Yuksel, I., & Dagdeviren, M. (2007). Using the analytic network process (ANP) in a SWOT study for a textile firm. Information Sciences, 177(6). http://dx.doi.org/10.1016/j.ins.2007.01.001