Vol.7 (2017) No. 6
ISSN: 2088-5334
Rice Seed Varieties Identification based on Extracted Colour Features
Using Image Processing and Artificial Neural Network (ANN)
A. A. Aznan
#, R. Ruslan
#, I. H. Rukunudin
#, F. A. Azizan
#, A. Y. Hashim
# #School of Bioprocess Engineering, Universiti Malaysia Perlis, 02600 Arau, Perlis, Malaysia E-mail: [email protected]
Abstract— Determination of rice seed varieties is very important to ensure varietal purity in the production of high-quality seed. To
date, manual seed inspection is carried out to separate foreign rice seed varieties in rice seed sample in the laboratory as there is lack of an automatic seed classification system. This paper describes a simple approach of using image processing technique and artificial neural network (ANN) to determine rice seed varieties based on extracted colour features of individual seed images. The experiment was conducted using 200 individual seed images of two Malaysian rice seed varieties namely MR 219 and MR 269. The acquired seed images were processed using a set of image processing procedure to enhance the image quality. Colour feature extraction was carried out to extract the red (R), green (G), blue (B), hue (H), saturation (S), value (V) and intensity (I) levels of the individual seed images. The classification using ANN was carried out by dividing the data sets into training (70% of data), validation (15%) and testing (15%) dataset respectively. The best ANN model to determine the rice seed varieties was developed, and the accuracy levels of the classification results were 67.5% and 76.7% for testing and training data sets using 40 hidden neurons.
Keywords— seed classification; machine vision; colour features; artificial neural network; rice varieties
I. INTRODUCTION
A high-quality rice seed production is crucial to maintaining high yielding rice production in every planting season. The authority that oversees the seed processing industry samples the rice seed from a seed lot for testing in the laboratory to ensure the quality compliance by establishing quality parameters such as seed purity, moisture content, and germination rate. The inspection tests are very important for seed certification of the individual rice seed bag for marketing.
One of the main concern in the laboratory seed inspection is the amount of weedy rice in the rice seed samples. The standard stipulated that the number of weedy rice seeds per kg is 10 seeds for a certified seed.
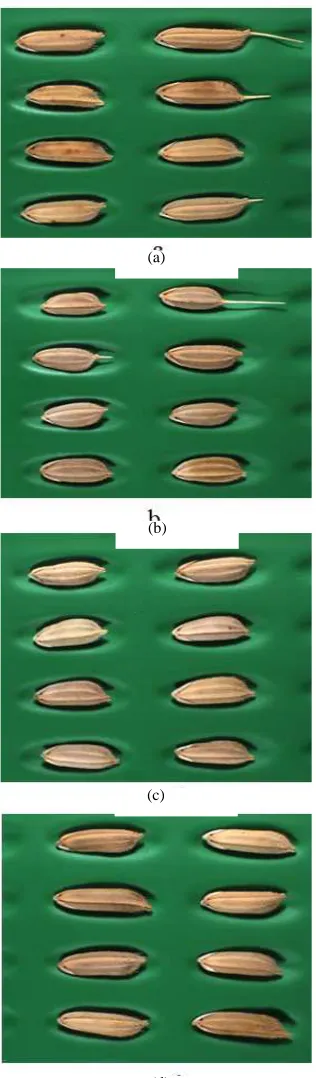
Weedy rice is known as the unwanted rice resulted from the natural hybridization between the cultivated rice and weed variety, de-domestication of cultivated rice to weedy rice and through adaptation of wild rice to continuous habitat disturbance [1]. Thus, weedy rice has evolved to appear very similar to the cultivated rice. As a consequent, the commercial seed processing plant that relies on mechanical separation unable to effectively separate the weedy rice seed from the cultivated rice seed. The sample images of commonly found weed rice seed in Malaysia are as shown in Fig. 1.
Currently, manual seed inspection is conducted using a
visual method by the trained personnel in the laboratory to separate weedy rice seed in the seed sample. However, manual inspection is known to have limitations as it is tedious, time-consuming and greatly dependent on the operator’s experience to identify the weedy rice as the seeds are very similar to the cultivated rice seed.
Varietal seed identification using image processing technique to determine seed varieties such as rice, wheat, oat, rye, and barley has been reported in various studies [2]˗[6]. In the identification of such varieties of seeds and grains, several parameters such as morphology, colour and texture features of the seed images were commonly extracted [7]. Colour attribute of seeds and grains images such as intensity distribution, mean values, variances and ranges of red (R), green (G), blue (B), hue (H), saturation (S) and intensity (I) has been used in the previous studies [8] and [9].
Fig. 1a-1d Typical image of weedy rice seed variants
Pattern recognition of machine learning is performed using the algorithm for seed and grain quality evaluation [7]. One of the most common techniques is by the artificial neural network (ANN). The ANN is developed to replicate the human decision-making process based on the input data fed into the algorithm. The architecture of ANN consists of three distinct layers; the input layer that connects to hidden neurons layer which connects to the output layer. The network processes the data based on the weights obtained from the pattern set in the training process.
The used of ANN in the classification analysis of agro-based product as well as in other application has been widely used such as in the classification of Chinese rice seed varieties [11], apple grading [12], discrimination of rapeseed varieties [13], olive fruits recognition [14], detection of segmentation points of Arabic Words [15] and face recognition [16].
The use of such techniques in identifying varieties and objects based on the acquired images has proven to be a potential to for the development of an automated identification system for seed verification test in the laboratory to improve the existing manual inspection. Thus, this study aimed to adopt image processing technique to extract colour features of individual rice seed images and ANN to identify commonly used local rice seed varieties of MR 219 and MR 269.
II. MATERIAL AND METHOD
The procedure to determine rice seed varieties of MR 219 and MR 269 was the collection of rice seed samples, image acquisition, image processing and segmentation; colour features extraction and classification. The approached methodology is as summarized in the flowchart of Fig. 2.
Fig. 2 Methodology flowchart (a)
(b)
(c)
A. Collection of Rice Seed Samples
The rice seed samples of MR 219 and MR 269 varieties were collected from an authorized local seed supplier in a sealed 20-kg seed bag. The rice seed samples consisted of 200 seed grain per variety were selected individually by visual inspection to ensure the purity of seed variety.
B. Image Acquisition
In image acquisition, a charge coupled device (CCD) Basler camera (acA 1600-60GC) was used with a fitted lens of 16 mm focal length. The camera was mounted on top of a black box perpendicular to the position of the seed plate. The field of view of the camera was adjusted to acquire 10 rice seed per frame. In a single frame, the rice seeds were arranged in 2 x 5 matrix on a fluorescent green 3D printed seed plate. In the black box, two light emitting diodes (LED) bulbs of 6400 K colour temperature were installed on both sides of the box. The experimental set up of the computer vision system is as shown in Fig. 3. In total, 20 images in Red, Green, and Blue (RGB) colour model containing 200 individual seeds were acquired in 1000 x 1200 pixels and saved as Portable Network Graphic (PNG) file format into a personal computer.
Fig. 3 Computer vision system
C. Image Processing and Segmentation
LabVIEW 2013 [17] software was used as a programming tool for image processing, segmentation and colour feature extraction process.
1) Image Processing
In the program, the acquired images were processed to enhance the quality of the acquired images. The image was first extracted in the red colour plane using Image Acquisition (IMAQ) Extract Single Colour Plane VI. The image was then converted to a greyscale image and filtered using IMAQ Convulate VI to enhance the edge contrast and sharpen the image. In this process, Laplacian filter of 3 x 3 matrix size kernel with kernel number 5 was selected based on the visual test [18].
The morphological image processing procedure such as dilation operation was then carried out to close the contours of individual seed images using IMAQ Morphology IV function was used to perform primary morphology transformations.
Later, IMAQ Particle Filter 3 function was used to remove noisy particles formed on the background image, and hole filling operation was carried out to fill any holes in the seed images with pixel value 1.
2) Image Segmentation
Finally, the seed images were separated from the background through image segmentation process to identify the region of interest [19] using IMAQ Threshold IV. In determining the threshold range of the greyscale image in between 0 to 255 grey level value, manual threshold method was used as the acquired images has good contrast between the seed images and its background colour. In this process, the pixel values of the image were isolated into two separate regions; the particle region consisted of the seed images and the background region. Thus, any pixel value outside the defined range will become pixel value 0 while any pixel value lied in the threshold range becomes 1. The resulted image from segmentation procedure was binary image consisted of value 0 for background and 1 for seed images.
3) Masking
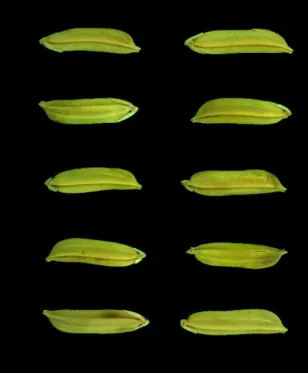
After segmentation, the processed image source that is corresponding to a non-zero-pixel value was masked to display the seed images in RGB format. The sample image before and after image processing procedure for individual seed kernel of MR 219 is as shown in Fig. 4 and Fig. 5 respectively.
Fig. 4 Sample image acquired using CCD camera for MR 219
D. Colour Features Extraction
The processed rice seed images of MR 219 and MR 269 were used in colour feature extraction process to obtain seven colour parameters such as red (R), green (G) and blue (B) in RGB colour space; hue (H), saturation (S), intensity (I), and value (V) in HIS and HSV colour space respectively in term of mean values using IMAQ Colour Histogram VI function in the LabVIEW. Then, the extracted data were saved in a Microsoft Excel data sheet for further analysis.
E. Identification of Rice Seed Varieties
The analysis to determine the rice seed varieties based on the extracted colour features was carried out using ANN Toolbox in MATLAB software. The data was divided into 3 sets of data consisted of 70% training, 15% validation and 15% testing data sets. Numbers of hidden layers were tested using 5, 10, 15, 20, 25, 30, 35, 40 and 45 hidden neurons. Based on the analysis, the number of hidden neurons yielded with the lowest mean squared error (MSE) was chosen for further ANN analysis to obtain the best model for the determination of rice seed according to its varietal groupings.
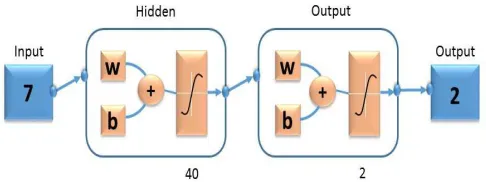
The two-layer feed-forward network consisted of sigmoid hidden neurons followed by an output layer neurons were used in the analysis. The typical scheme of ANN structure for 40 hidden neurons used in the Neural Network Toolbox is as shown in Fig. 6. The ANN was trained using scaled conjugated gradient back propagation method. In the analysis, the stopping criteria of the training network were
set using default setting which automatically ended when the generalization process achieved the optimum accuracy level, thus improving the accuracy of validation data set.
Fig. 6 ANN scheme for 40 hidden neurons
III.RESULTS AND DISCUSSION
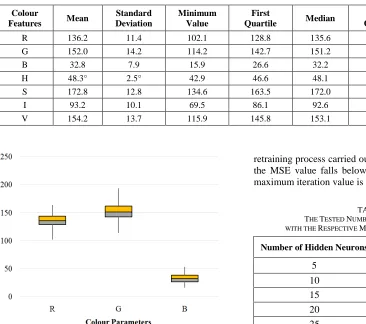
The acquired images of individual rice seeds were isolated from the background using several image processing procedures. The summary of extracted colour features data and the box plot analysis of MR 219, and MR 269 images are as summarized in Table 1 and 2 and Fig. 7 to 10 respectively. From Table 1 and 2, the colour features extracted from MR 219 and MR 269 differed in their respective colour features values. The differences provide the potential to differentiate rice varieties according to their colour features. Such differences in the extracted colour features of the two varieties are statistically demonstrated by the box plot in Fig. 7 to 10.
TABLEI
THE EXTRACTED COLOUR FEATURES FOR MR219SEED IMAGES
Colour
Features Mean
Standard Deviation
Minimum Value
First
Quartile Median
Third Quartile
Maximum Value
R 143.3 11.9 116.1 134.1 142.5 151.6 178.7
G 164.8 16.4 132.2 153.0 164.1 174.0 227.5
B 38.8 10.3 15.0 31.3 37.8 44.7 69.2
H 50.0° 2.8° 42.3° 48.1° 49.8° 51.5° 60.5°
S 168.7 13.8 130.9 159.4 168.8 176.7 210.2
I 102.2 12.4 76.4 92.9 101.7 109.9 148.0
V 166.3 15.8 134.5 155.6 165.0 174.6 227.6
TABLEII
THE EXTRACTED COLOUR FEATURES FOR MR269SEED IMAGES
Colour
Features Mean
Standard Deviation
Minimum Value
First
Quartile Median
Third Quartile
Maximum Value
R 136.2 11.4 102.1 128.8 135.6 143.8 163.6
G 152.0 14.2 114.2 142.7 151.2 162.0 193.5
B 32.8 7.9 15.9 26.6 32.2 38.3 53.5
H 48.3° 2.5° 42.9 46.6 48.1 50.0 57.5
S 172.8 12.8 134.6 163.5 172.0 183.2 202.6
I 93.2 10.1 69.5 86.1 92.6 100.1 119.2
V 154.2 13.7 115.9 145.8 153.1 119.2 194.0
Fig. 9 Box plot analysis of R, G and B colour parameters for MR 269
Fig. 10 Box plot analysis of H, S, I and V colour parameters for MR 269
The extracted data were analysed using ANN to obtain the best model to identify the rice seed varieties in the MATLAB ANN Toolbox. Table 3 shows the results of a tested number of hidden neurons. Based on the neural network training utilizing the training and testing dataset using 5, 10, 15, 20, 25, 30, 35, 40 and 45 hidden neurons. The lowest MSE value of 0.1966 was obtained using the 40 hidden neurons with the accuracy of 64.6% and 70.0% for testing and training data sets respectively. Thus, 40 hidden neurons were selected to improve the classification accuracy by retraining the network. Using the 40 hidden neurons, the
retraining process carried out using ANN was repeated until the MSE value falls below a predefined level or until the maximum iteration value is achieved [20].
TABLEIII
THE TESTED NUMBER OF HIDDEN NEURONS WITH THE RESPECTIVE MEAN SQUARED ERROR VALUES
Number of Hidden Neurons Mean Squared Error (MSE)
5 0.2262
10 0.2355
15 0.1987
20 0.2153
25 0.2168
30 0.2095
35 0.2101
40 0.1966
45 0.2175
The classification accuracy results to identify the rice seed varieties using the retrained network of 40 hidden neurons on training and testing data sets yielded an accuracy of 67.5% (MSE value = 0.20279) and 76.7% accuracy level (MSE value = 0.1885) for testing and training data sets respectively. The details of the classification accuracies obtained from confusion matrix table generated in the MATLAB ANN Toolbox was summarized in Table 4.
TABLEIV
CLASSIFICATION ACCURACY IN IDENTIFYING MR219 AND MR269RICE SEED VARIETIES USING 40HIDDEN NEURONS
Data Set Group
Predicted
Group Mean
Accuracy Total MR 219 MR 269 T ra in in g O ri g in al Count MR
219 96 42 142
MR
269 49 93 138
Accuracy (%)
MR
219 69.6 30.4 67.5
100
MR
269 34.5 65.5 100
V al id at io n Count MR
219 20 17 23
MR
269 8 15 37
Accuracy (%)
MR
219 54.1 34.8 58.3
100
MR
269 45.9 65.2 100
T es ti n g O ri g in al Count MR
219 20 5 35
MR
269 9 26 25
Accuracy (%)
MR
219 80 25.7 76.7
100
MR
269 20 74.3 100
IV.CONCLUSIONS
Based on the analysis, the highest accuracy levels achieved were 67.5% (MSE value = 0.20279) and 76.7% accuracy level (MSE value = 0.1885) for testing and training data sets respectively. The accuracy level is low to accurately identify rice seed of different varieties. The inclusion of other colour features extracted directly or their derivative could improve the accuracy level. As a recommendation to improve the classification accuracy, the input parameters of colour features should be increased while the least significant input must be reduced using the principal component analysis. The accuracy level can be further enhanced if other features such as morphology and texture features are incorporated in the classification analysis.
ACKNOWLEDGMENT
The authors would like to thank the Ministry of Higher Education (MoHE) for funding this research under the Fundamental Research Grant Scheme (FRGS) and Universiti Malaysia Perlis (UniMAP) for sponsoring this research.
REFERENCES
[1] K. Singh, V. Kumar, Y. S. Saharawat, M. Gathala, J. K. Ladha, and B. S. Chauhan, “Weedy rice: An emerging threat for direct-seeded rice production systems in India,” Journal of Rice Research, vol.1(1), 2013.
[2] A. R. Pazoki, F. Faroki, and Z. Pazoki, “Classification of rice grain varieties using two artificial neural networks (MLP and
Neuro-fuzzy),” Journal of Animal and Plant Science, Engineering and Technology, vol. 24(1), pp. 336-343, 2014.
[3] L. L. Wu, J. Wu, Y. X. Wen, L. R. Xiong, and Y. Zheng, “Classification of single cereal grain kernel using shape parameters based on machine vision,” Advanced Materials Research, vol. 605, pp. 2179–2182, 2013.
[4] A. Pourreza, H. Pourreza, M. H. Abbaspour-Fard, and H. Sadrnia, “Identification of nine Iranian wheat seed varieties by textural analysis with image processing,” Computers and Electronics in Agriculture, vol. 83, pp. 102-108, 2012.
[5] P. Zapotoczny, “Discrimination of wheat grain varieties using image analysis and neural networks. Part I. Single kernel texture,” Journal of Cereal Science, vol. 54 (1), pp. 60–68, 2011.
[6] S. Majumdar and D. S. Jayas, “Classification of cereal grains using machine vision: I. Morphology models,” Transaction of the ASAE, vol. 43(6), pp. 1669-1675, 2000.
[7] S. M. Rad, F. A. Tab, and K. Mollazade, “Application of imperialist competitive algorithm for feature selection: A case study on bulk rice classification,” International Journal of Computer Applications, vol. 40(16), pp. 41-47, 2012.
[8] S. Majumdar and D. S. Jayas, “Classification of cereal grains using machine vision: II. Colour models,” Transaction of the ASAE, vol. 43(6), pp. 1677-1680, 2000.
[9] P. Vithu and J. A. Moses, “Machine vision system for food grain quality evaluation: A review,” Trends in Food Science & Technology, vol. 56, pp. 13-20, 2016.
[10] T. Y. Kuo, S. Y. Chen, H. A. Lin, C. L. Chung, and Y. F. Kuo, “Identifying Rice Grains of Various Cultivars using Machine Vision,” ASABE Paper No. 152188279, St. Joseph, Michigan, 2015. [11] Y. Liu, C. Fang, Y. B. Yi, and R. Q. Xin, “Identification of rice seed
varieties using neural network,” Journal of Zhejiang University, vol. 6b(11), pp. 1095-1100, 2005.
[12] P. Moallem, A. Serajoddin and H. Pourghassem, “Computer vision-based apple grading for golden delicious apples vision-based on surface features,” Information Processing in Agriculture, vol. 4(1), pp. 33-40, 2017.
[13] F. Kurtulmus and H. Unal, “Discriminating rapeseed varieties using computer vision and machine learning,” Expert Systems with Applications, vol. 42, pp. 1880-1891, 2015.
[14] G. Gaticaa, S. Bestb, J. Ceronic, and G. Lefranc, “Olive fruits recognition using neural networks,” Procedia Computer Science, vol. 17, pp. 412-419, 2013.
[15] J. R. Khairuldin Omar and M. Faidzul,"A novel method to detect segmentation points of arabic words using peaks and neural network," International Journal on Advanced Science, Engineering and Information Technology, vol. 7(2), pp. 625-631, 2017. [16] H. Boughrara, M. Chtourou, C. B. Amar, and L. Chen, “Face
recognition based on perceived facial images and multilayer perceptron neural network using constructive training algorithm,” Institution of Engineering and Technology Computer Vision, vol. 8(6), pp. 729-739, 2014.
[17] National Instruments Corporation, IMAQ Vision for LabVIEW User Manual, Austin, Texas: National Instruments Corporation, 2000. [18] F. G. Hernandez and J. G. Gil, “A machine vision system for
classification of wheat and barley grain kernels,” Spanish Journal of Agricultural Research, vol. 9(3), pp. 672-680, 2011.
[19] Y. S. Madenda, E. P. Wibowo and Karmilasari,"Object Feature Extraction of Songket Image Using Chain Code Algorithm," International Journal on Advanced Science, Engineering and Information Technology, vol. 7(1), pp. 235-241, 2017.
[20] L. A. I. Pabamalie and H. L. Premaratne, “A grain quality classification system,” in Proc. International Conference on Information Society (i-Society), 2010.
[21] S. Majumdar and D. S. Jayas, “Classification of cereal grains using machine vision: III. Texture models,” Transaction of the ASAE, vol. 43(6), pp. 1681-1687, 2000.
[22] S. Majumdar and D. S. Jayas, “Classification of cereal grains using machine vision: I. Combined morphology, colour and texture models,” Transaction of the ASAE, vol. 43(6), pp. 1689-1694, 2000. [23] F. Cheng, F. B. Ying, Z. Y. Liu, “Rice seeds information system
based on artificial neural network,” Proc. of SPIE, vol. 5999(10), pp. 1-8, 2005.