ANN-based Joint Time and Frequency Analysis of EEG for
Detection of Driver Drowsiness
Suman Dabbu
*, M. Malini
@, B. Ram Reddy
#, and Yashwanth Sai Reddy Vyza
$*,@Department of Biomedical Engineering, University College of Engineering (A), Osmania University, Hyderabad #Department of Physiology, Apollo Institute of Medical Sciences, Hyderabad
$Microelectronics, Delft University of Technology, Netherlands *E-mail: [email protected]
AbsTrAcT
Drowsiness detection plays a vital role in accidents avoidance systems, thereby saving many precious lives. Many attempts were made to detect the drowsiness by the physiological features such as Electroencephalogram (EEG), Electrooculogram (EOG), and Heart Rate Variability, etc., but a reliable index to determine the drowsiness is not yet a reality. This study contributes in identifying the drowsiness levels by an index called Drowsiness Index (DI) from the EEG signal analysis of the drivers. In this report, the EEG signal is processed to detect the behavioural patterns of the brain and drowsiness state of the drivers while performing monotonous driving for long distances. An eight-channel EEG data acquisition system is used to acquire the EEG data from thirteen male volunteers. The EEG signal is pre-processed and decomposed into various rhythms by applying a digital filter in MATLAB 2007b. Time-Frequency domain analysis has been done to extract certain features namely power within spectrogram, power within the root mean square deviation which are statistically significant (ρ < 0.05) in the detection of drowsiness. The driving profile is classified into active and drowsy by a separable marker with a range of 0.4-0.6, and linear regression analysis has been performed on the features extracted. A Drowsiness index is proposed stating a positive correlation (0.8-0.9) between the Total mean and the drowsy mean of the subject. The final features extracted from the data are classified using an ANN-based classifier system and has achieved a sensitivity of 99.82 per cent and specificity of 99.78 per cent.
Keywords: Drowsiness; Power within spectrogram; Power within the root mean square deviation 1. INTroDucTIoN
In the globally expanding network of transportation, road traffic accidents were marked as one of the primary causes of death. It is estimated that 2.2 per cent of all deaths across the globe are caused by road accidents1. Regrettably,
drivers recurrently miscalculate the risk and embellish their competence to resist drowsiness. Many drivers are initially alert, but drowsiness induces with prolonged driving . There are some drivers with insomnia and sleep apnoea who are at greater risk of road accidents. The National Highway Traffic Safety Administration estimates that 1,00,000 police-reported crashes are due to driver fatigue and drowsiness every year 2.
Recent statistics report that India was ranked 8th in the
world based on traffic index3. It is proclaimed that 40 per cent
of fatalities on the road across the world are due to driver error which is induced because of fatigue4. The National
Transportation Safety Board (2010) has adumbrated that driver fatigue credibly causes crashes on the way which engenders injuries and capital loss.
Four major factors that often trigger the driver fatigue are
sleep, specific time of the day, hectic work, and physical strain. In this professional world, people opt for a race against time which results in insufficiency of sleep. The specific time of day strongly influences the driver to attain drowsiness. People on certain medications can become drowsy. Additionally, a person with high stress can be fatigued quicker5. Many of the
current drowsy detection techniques depend on behavioural parameters, vehicle-based parameters, and physiological parameters6.
The behavioural methods for drowsy driving detection include video tracking, which is an unobtrusive way to examine the drowsiness state of a driver. This video monitoring comprises of two techniques, i.e., face and eye tracking to detect the drowsiness signs of the driver and per centage closure of the eyes (PERCLOS). It has been has reported that PERCLOS is one such critical parameter to detect drowsy driving. PERCLOS is the per centage of the time when the eyes are occluded over a specified time interval. Face orientation, Distance of an eyelid from the camera, and lighting conditions can also impact video tracking in behavioural methods for drowsiness detection7-10.
The vehicle-based method primarily focuses on lane Received : 30 December 2016, Revised : 04 July 2017
Accepted : 28 August 2017, Online published : 09 November 2017 2017, DESIDOC
tracking for drowsy driving detection. Vehicle lane position captured in the cameras focused out onto the road estimates the lane tracking as the fatigued driver has the high probability of deviating the lane. Lane tracking has critical limitations since roads cannot seldom match analyst model and the atmospheric changes can block the clear view of markings11.
Physiological signals such as EOG, EMG, and EEG are used to detect the drowsiness, which are reliable as they convey the physiological status of the brain. Blink parameters such as eye opening time (EOT), eye closing time (EcT), and blink duration (BD) derived from the EOG signal clearly distinguishes the Active and drowsy stages12-13.
Recent research evaluated multiple fatigue parameters such as surface electromyography (sEMG), EEG, seat interface pressure, blood pressure, heart rate, oxygen saturation level [14].
Researchers claimed a significant (ρ < 0.05) decrease in the β activity with a simultaneous increase in α and θ activities during the monotonous driving task. These results also showed the significant (ρ < 0.05) fatigue in the muscle groups of backbone and shoulder [15].
A group has used non-linear features extracted from EEG and EOG and correspondingly classified through soft computing techniques. A neuro-fuzzy information system is proposed to detect drowsiness level based on EEG signal. Although EEG analysis was extrapolated to various applications of drowsiness detection erstwhile, the quantification of drowsiness states is still not yet a reality16-17. This study bridges this gap and
proposes a new index to quantify the drowsiness using the features of EEG signals.
2. METhoDoloGy 2.1 study Protocol
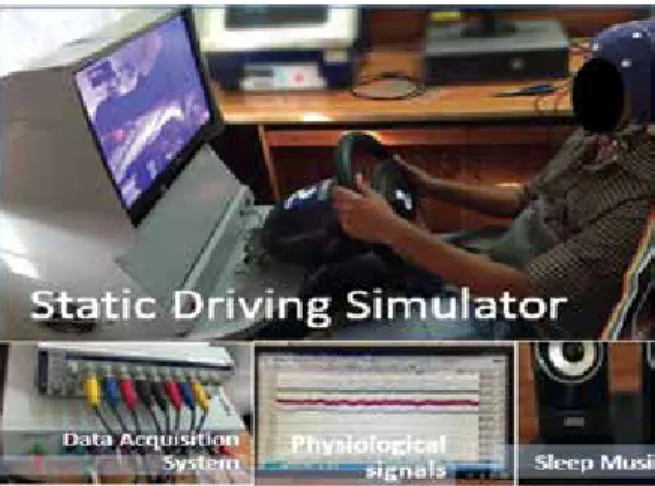
Thirteen male subjects volunteered to help in this study and performed the driving task. Their mean height, weight and ages were 1.72±0.08 m, 62.7±11.2 kg, and 27.76±10.77 years, respectively. The participants included professional licensed drivers with more than two years of driving experience and normal drivers more than two years of driving experience on light motor vehicles (LMV). The experimental procedure and all the risks involved were clearly explained to the volunteers. All the participants performed the driving tasks on a static driving simulator (Logitech G29) in the laboratory.
2.2 Driving simulator
The driving simulator consists of a steering wheel with force feedback, foot pedals (acceleration, break, and clutch), gear shift lever (manual and automation) and a monitor for visual feedback of the driving environment. All the participants have undergone a training session for 30 minutes to get themselves acquainted with the controls on the simulator. After a break of 30 minutes each participant performed the driving task for 60 minutes on a monotonous driving track. All the driving tasks were recorded using a video camera (16 MP: inbuilt-simulator). These recordings were used in the subjective analysis for drowsiness detection.
2.3 safety
The calibration of instruments was performed and the electrical safety of the operator and volunteers was ensured using the Fluke-Electrical Safety Analyser (ESA615) based on the standards IEC-60601-1 (Fluke Electronics Corporation., United States).
2.4 Physiological signal Analysis
Brain functions coherently to control the activities of the human beings. The different lobes of the brain are organised for performing several functions such as driving, cognition, reasoning, and speech, etc. The frontal lobe is associated with higher level of cognition, reasoning, parts of speech, motor skills, and emotions, problem-solving. The parietal lobe is related to orientation, processing tactile sensory stimulus, movement and recognition. The occipital lobe is associated with visual processing. The perietal lobe is associated with memory, perception and recognition of auditory stimulus, speech[18]. It is possible that the activities in these lobes are
affected by drowsiness to different extents. These signals were analysed thoroughly by many researchers in prognosis and diagnosing various neurological disorders. This study is devoted to the detection of drowsiness by EEG signal analysis in both time and frequency domains as shown in Fig. 2.
The EEG signals were acquired by eight channel octal bio-amplifier (AD Instruments: Lab Chart 8) at a sampling frequency of 1000 Hz. The electrodes were positioned on the four lobes of the cerebral cortex, i.e., Frontal (F3, F4), parietal (P3, P4), occipital (O1, O2) and temporal (T3, T4) lobe based on the standard 10-20 electrode system of EEG. Figure 3 shows the normalised EEG signal acquired from the parietal lobe. The raw data was pre-processed by applying Chebyshev Filter with cut-off frequencies of 0.5 and 40 Hz.
The normalised EEG signal was classified into four different rhythms namely Delta (δ: 0.5-3.5 Hz), Theta (θ: 4-7 Hz), Alpha (α: 8-13 Hz) and Beta (β: 14-30 Hz) by using digital filters and as shown in Fig. 4. Such classification was done for the EEG signal derived from the temporal lobe, occipital lobe, and frontal lobe. These rhythms are analysed in time and frequency domain by using root mean square deviation (RMSD) and short-time fourier transform (STFT), respectively.
2.4.1 Time-Domain Analysis
The RMSD is an aggregation of the magnitudes of the Figure 1. Experimental setup.
errors in predictions for several times into a single measure of predictive power.
RMSD [r (n)] was estimated of the beta (β) and Alpha (α) rhythms by using Eqn. (1)
(1) where xn denotes the EEG signal, is the mean of the signal,
N is the length of the window, n is the index of the samples, and
r(n) is the RMSD of EEG signal.
A window of length 128 k (k = 1024) with 50 per cent
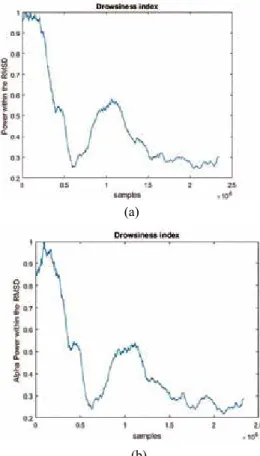
overlap between successive samples was chosen to find the predictive power (PRMSD) within RMSD using the Eqn. (2). The predicted power (PRMSD) was normalised with the maximum power in the window. The Power Pt(n) in the Alpha and Beta waves within the RMSD vs time is shown Fig. 5.(a) and Fig. 5.(b).
(2) where r(n) is the RMSD of the signal, Pt(n) Power within the RMSD signal, M is the length of the window, N is the length of the signal.
Figure 3. Normalised EEG signal acquired from parietal lobe. Figure 2. Data acquisition and feature extraction in both time
and frequency domain.
Figure 4. Normalised EEG rhythms of parietal lobe based on frequency bands: Delta, Theta, Alpha, beta.
2.4.2 Frequency-Domain Analysis
The Alpha and Beta rhythms (Time-domain) were transformed to frequency domain (Spectrogram) by using Short-Time Fourier Transform (Eqn. (3)). A window of length M (128K) with 50 per cent overlap was chosen to compute the STFT.
(3) where X (k, w) is STFT, x (n) is ignal, w (n) is rectangular window, k is length of the window.
The magnitude of power Pf(n) within the STFT was estimated using the Eqn. (4). The power signal was normalised, Figure 5. Drowsiness state using normalised power estimated for
beta and Alpha rhythms. (a) rMsD of beta and (b) rMsD of Alpha.
(b) (a)
and a drowsiness state is proposed in frequency-domain for both Beta (Fig. 6(a) and Alpha rhythms (Fig. 6(b)).
(4) where the Pf(n) is the power within the spectrogram, X is the STFT of EEG signal
2.4.4 Statistical Analysis
The EEG signals from the three lobes namely occipital, temporal, parietal were analysed using Matlab™ 2007b (Math works, Inc., USA).A normality test was performed with logarithmic transformation on the extracted features from the EEG analysis; the results of this appeared positive. The level of statistical significance was tested using Friedman test for 60mins of driving. Linear Regression Analysis, Wilcoxon-signed rank test and Post-hoc analysis through Tukey’s Honestly Significant Difference (HSD) Test was performed on the outcomes of EEG analysis to verify the level of significance and estimated that as (ρ < 0.05). The licensed
2.4.3 Analysis by the Neuro-physicians
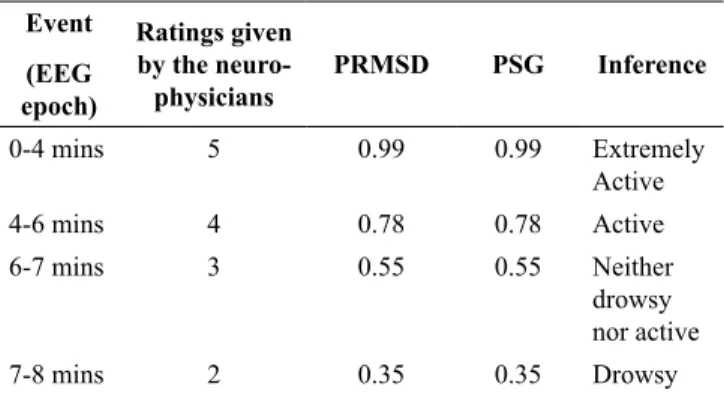
The EEG data was evaluated by three neuro-physicians who are sleep experts [I Mporas et al.]. The experts examined the complete EEG waveforms and divided them into segments of various stages of alertness (scale 1-5) after correlating with the video recordings. A score of “1” as sleepy and the score of “5” as extremely active has been chosen. Figure 6 shows the scoring given by the experts for the EEG data recorded from a subject clearly indicates the drowsiness levels range from 1-5. These ratings are used to compare and validate the results obtained by using PRMSD and PSG.
The experimental results obtained from the two methods by using RMSD & PSG (Fig. 3.2 and 3.3) are validated against the ratings given by the neuro-physicians (Fig. 3.1) and comparison is made as shown in the Table 2.1.
Each epoch of the EEG signal is analysed from the values obtained from PRMSD & PSG and correlated with the ratings given by the subjective assessment. The results are in complete agreement with the ratings given by the subjective assessment. The results of these three analyses
are consistent. Figure 9. EEG signal is classified into active and drowsy by the PsG of beta waveform. Figure 7. EEG signal is classified into active and drowsy by the
subjective assessment.
Figure 8. EEG signal is classified into active and drowsy by the PrMsD of beta waveform.
Figure 6. Drowsiness index using normalised power estimated for beta and Alpha rhythms: (a) spectrogram of beta; (b) spectrogram of Alpha.
(b) (a)
version of SPSS v10.0.1 complete package was used for all these statistical tests.
3. DrowsINEss DETEcTIoN
The EEG analysis shows significant (ρ < 0.05) results in corroboration with the subjective assessment, subject’s self-monitoring scale and Simulator results of driver’s performance. The parameters PRMSD and PSG which constitutes the power within the EEG rhythms decrease with increase in the drowsiness state of the subjects.
The power within the spectrogram of Beta rhythm of one subject as shown in Fig. 7 indicates a significant (ρ < 0.05) decrease in the beta activity in accordance with the cortico-neural activity of the Brain. PRMSD and PSG have shown similar trends of decreasing power with drowsiness state over a period.
It is found that the drowsiness index derived from PRMSD and PSG during the active stage is 0.65-1, drowsy stage is 0.01-0.4, and during the transition stage is 0.4-0.6. This analysis is consistent among all the subjects with a significance level of p<0.005. Drowsiness and alertness are then separable with the index of 0.4-0.6 being a clear marker of separation. Table 2. shows the average indices and their variance in active and drowsy states. The drowsiness index ranges obtained for both PSG and PRMSD are clearly different in both active and drowsy states for all the subjects. It is statistically significant (ρ < 0.05) as the deviation from the mean is minimum. (Figs. 11 and 12).
Figure 11 shows the PSG of subjects in both Active and Drowsy cases after evaluating the threshold, and it is
Figure 10. Power within the spectrogram of beta rhythm of a
subject is plotted against the time. Figure 11. Drowsiness index derived from the PsG within beta rhythm for both active and drowsy cases. validated against the subjective assessment, which is also proved for PRMSD. The complete driving profile of all the subjects was analysed by using PRMSD, PSG and the total mean of subjects in Beta and Alpha are plotted in Fig. 12. and Fig. 13, respectively. The trend line shows a positive correlation between the total mean for all the subjects with R2
ranging from 0.82 to 0.96 for PSG and PRMSD of both beta and alpha rhythms. This study also reports that the PRMSD and PSG of the beta and alpha show the same trend over the entire driving profile for all the subjects (Figs.12 and 13). This study creates an insight into the relation between the PSG & PRMSD and has the scope of extrapolating it into different fields.
Figure 14 ratify the significant (ρ < 0.05) difference in power levels within Beta, Alpha and Theta in Active and Drowsy levels of the subjects recorded from the parietal lobe. A similar trend was observed in both Temporal and Occipital lobes. In contrary to the above observation, several peaks were observed for a minute period during the onset of drowsiness along with certain phases of the three lobes mentioned earlier. Table 1. comparison analysis of drowsiness
Event (EEG epoch) ratings given by the neuro-physicians PrMsD PsG Inference 0-4 mins 5 0.99 0.99 Extremely Active 4-6 mins 4 0.78 0.78 Active 6-7 mins 3 0.55 0.55 Neither drowsy nor active 7-8 mins 2 0.35 0.35 Drowsy
The main reason for these formidable peaks was the sudden and minimal reactions either corresponding to the behavioural patterns or due to the motor imagery.
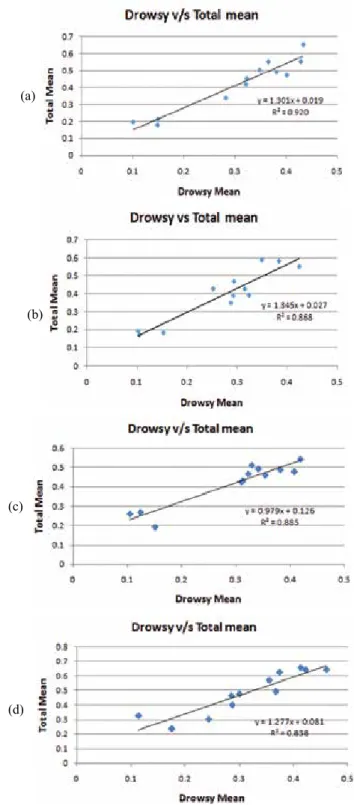
Figures 15(a)-15(d) show the correlation between the total mean of drowsiness index derived from PSG and PRMSD versus Drowsy mean. The study shows a positive correlation of R2 of 0.83-0.96 between the total mean
and Drowsy mean, which is significant (ρ < 0.05) with a confidence interval of 11.
4. ArTIFIcIAl NEurAl NETworKs bAsED clAssIFIcATIoN
Artificial neural networks (ANNs) are nonlinear mapping structures in view of the capacity and working of the human brain. An artificial neural system is a computational structure that is roused by observing the process in neural systems of biological neurons in the brain. It comprises of straight forward computational units called neurons, which are exceptionally Figure 12. Drowsiness index corresponding to the total driving
profile of the subjects from the Beta Rhythm
Figure 13. Drowsiness index corresponding to the total driving profile of the subjects from the alpha rhythm.
Figure 14. Drowsiness index based upon the mean and errors of alpha, beta, and theta of parietal lobe.
Figure 15. (a) and (b) Time-domain, the power within beta and alpha rhythms was classified into active and drowsy stages based upon PrMsD, and drowsy-mean was plotted against total-mean. (c) and (d) Frequency-domain, the power within beta and alpha rhythms was classified into active, and drowsy stages based upon PsG and drowsy-mean was plotted against total-mean. interconnected. ANNs are presently being progressively perceived in the territory of classification and prediction, where regression model and other related statistical procedures have generally been utilised. The most generally utilised learning algorithm in a neural system is the back propagation algorithm. Figure 16 demonstrates the standard back propagation neural network.
(b)
(c)
(d) (a)
In this study, the data obtained from 13 different subjects is combined in-order to normalise any subject to subject variations, it is this data is being used in the design of neural network system for classification into active EEG and drowsy EEG. This set of data is analysed and the following features are extracted from entire set to describe the basic features in a study. The two main features analysed here are: PRMSD and PSG helping us to quantify summaries about the sample and the measures such as maximum/minimum values of variables, mean value being the measure of central tendency and standard deviation as a measure of variability.
Table 3. Design parameters of ANN Parameters
No. of Hidden neurons 2
Train Function Trainlm + Trainscg Activation function for hidden layer Tansig
Activation function for output layer Purelin
Network Performance MSE (cross-entropy) The results of our experiment on EEG signal classification problem into drowsy or active state with the best yielding neural network are summarised in Table 4. The Mean Square Error (MSE) has the objective function to design the neural network classifiers.
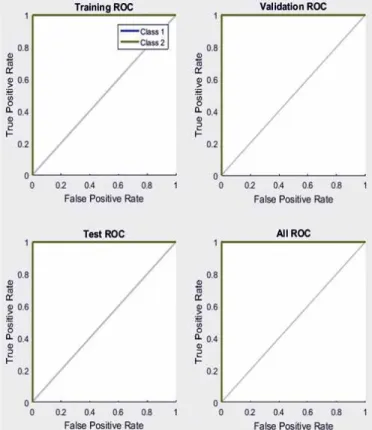
The experimentation results have shown optimal values for the chosen hidden neurons in hidden layer. The classifier model consists of 2 inputs, 2 hidden neurons and 1 output neuron. This ANN model (2-2-1) with back propagation learning (BPNN) has produced the results accounting to trail error as shown in Table 2. Figure 17 shows the learning curve, Fig. 18 the confusion matrix and Fig. 19 the Receiver operating characteristics (ROC) with a percentage MSE of 2.04213e-1. The proposed classification system has achieved 100 per cent training accuracy, less simulation time and good generalisation given the high no. of samples close to nine lakhs in number.
Based on the classification results, that this method has the specificity of 99.78 per cent and sensitivity of 99.82 per cent.
Thereby, given the methodology to acquire data and process it to find critically distinguishable parameters such as PRMSD and PSG has yielded a system with accuracy of 100 per cent classification.
Figure 16. Artificial neural network model.
These extracted features also called elements have been used as the inputs to design the neural network. It has been observed that it is these values of features that are clearly distinguishable for classification of active EEG and drowsy EEG signals. These two parameters are estimated for the 13 subject’s EEG data both for alpha and beta states. The entire data is combined for normalisation and divided into training, validation and testing groups. The proposed study suggested is through a feed forward neural network designed as a classifier with single hidden layer at output. Also, the back propagation learning algorithm has been proposed for various structures of ANNs. Instead of considering a range of hidden neurons, two hidden neurons were selected. This is to secure the ability of the network to generalise, which can be achieved by keeping the number of nodes as low as possible. If large excess of nodes is present, network becomes a memory bank that can recall the training set to perfection, but does not perform well on samples that was not part of the training set. Also, careful attention is to be paid in selecting these hidden layers in order to avoid over-fitting or under-fitting. This can only be increased if the error for training data is significantly smaller than for the cross-validation data set. Table 3 shows the design parameters for the desired neural network classifier.
NN Classifier cross-entropy
(testing) % MsE No. of epochs simulation time Training accu-racy Testing accuracy 2-2-1 (2 hidden
neurons) 10.21361e-0 2.04213e-1 177 00:04:04 99.806779 99.795787
Table 4. Results of ANN classifier
5. DIscussIoNs
This study has attempted to detect drowsiness state of a subject in both time and frequency domains. Two parameters PRMSD and PSG were evaluated from the EEG signal, and a drowsiness state ranging from 0 to 1 is proposed. These results are in total agreement with the subjective assessment of the participants. The results are in total agreement with the drowsiness index in the scale 1-5 proposed by sleep experts19-20. Thus this makes a quantitative approach to
identify behavioural patterns and drowsiness state of a subject while performing monotonous driving task for long periods of time.
made to study the effect of sleep music (Delta waves) on the participants. The results show that there is a significant (ρ < 0.05) decrease in levels of beta activity after listening to the sleep music for all the subjects.
A group of researchers have used independent component analysis (ICA) and Log Power Spectrum of EEG by using Fast Fourier Transform (FFT) to classify the driving performance into active and drowsy16-17.
It has been reported by a group of researchers that there is a significant (ρ < 0.05) change in the Beta, alpha and theta activities within the temporal lobe. A ratio between slow waves and fast waves is proposed by them and is significant (ρ < 0.05) in the detection of drowsiness15. A similar attempt was made
by us, but the ratio tends to change and not significant. This is because that group has recorded the EEG only before and after the driving task, and where as in in this study the EEG recordings were made while performing the driving task.
6. coNclusIoNs
EEG-based drowsiness detection was implemented in this study for a highway driving scenario in a virtual driving environment. Time-frequency domain analysis of Beta, Alpha, and Theta were carried out and two parameters PRMSD, and PSG were found to be significant (ρ < 0.05) with a positive coefficient of correlation 0.82-0.96 for Beta and Alpha rhythms. The total driving profiles of all the subjects were classified into Active and Drowsy state and were validated by the subjective assessment. Drowsiness index has been derived from PRMSD and PSG of Beta and Alpha. The spectrogram of subjects shows there is a significant (ρ < 0.05) change (p<0.0001) in the attention levels of all the subjects, with the linear regression
Figure 19. Plot of receiver operating characteristics.
Figure 18. confusion matrix of ANN.
A group of researchers has reported that the spectral power-based indices γ/δ and (γ+β)/(δ+α) evidences the significant changes in the alert/drowsy transitions of 20 subjects taken from the sleep EDF (European Data Format database)21. Our
study also reports a drowsiness index computed from PSG and PRMSD, which indicates a significant change during drowsy to alert-drowsy transition on the real-time data acquired.
It has been reported that the valuable indicator of drowsiness is the decrease in beta activity, which was also validated by this study. A significant decrease was observed in the levels of beta, alpha, theta activities within parietal, temporal and occipital lobe by other researchers14-17,21-22. However a quantitative
approach to drowsiness state was attempted in this study. A study has reported that the subject’s energy levels of the EEG vary while listening to music23. An attempt was
analysis of correlation coefficient of 0.59 against time for a subject. It is observed that the drowsiness index from PRMSD, PSG in active and drowsy stages of Alpha and Beta as shown in Table 2, are statistically significant (ρ < 0.05).
A relationship is proposed between the Total mean of PRMSD, PSG and Drowsy mean of PRMSD, PSG for Alpha and Beta. There is a strong correlation between the (0.83 - 0.92) the total mean and drowsy mean of PRMSD and PSG. This study has shown that the data is classified by a robust ANN based classifier yielding an accuracy of 99.8 per cent with a sensitivity of 99.82 per cent and specificity of 99.78 per cent. Among the two methods PSG is easy to implement in real time compared to the PRMSD as PRMSD is computationally more complex. The detection of drowsiness and the validation of it in real time scenario is yet to be carried out. Wireless sensors with a DSP processor could be a potential tool for easy implementation in the real time situations thereby decreasing the road accidents. rEFErENcEs
1. The National Highway Traffic Safety Administration(http:// www.nhtsa.gov/).
2. Real time traffic accident statistics (http://www.icebike .org/real-time-traffic-accident-statistics/)
3. Traffic Index for country, 2016 (http://www.numbeo .com/traffic/rankings_by_country.jsp)
4. Connor. J., r. Norton, s. Ameratunga, e. Robinson, i. Civil, r. Dunn, j. Bailey, r. Jackson. Driver sleepiness and risk of serious injury to car occupants: population based case-control study. Br.
Med. J., 324 (7346) (2002), p.1125.
doi: 10.1136/bmj.324.7346.1125
5. Road Safety Information, Rospa, Driver fatigue and Road accidents. (www.rospa.com, 2011)
6. Suman, D.; Malini, M. & VenkateswaraRao, M. Design and development of a comprehensive Driver Drowsiness detection and Alerting System. International Journal of Advances in
Science and Technology (IJAST), pp. 2348-5426, 2014.
7. Abe, T.; Nonomura, T.; Komada, Y.; Asaoka, S.; Sasai, T.; Ueno, A. & Inoue, Y. Detecting deteriorated vigilance using per centage of eyelid closure time during behavioral maintenance of wakefulness tests. Int. J. Psychophysiol 2011, 82, 269–274. doi: 10.1016/j.ijpsycho.2011.09.012. Epub 2011 Oct 3
8. McKinley, R.A.; McIntire, L.K.; Schmidt, R.; Repperger, D.W. & Caldwell, J.A. Evaluation of eye metrics as a detector of fatigue. Hum. Factors 2011, 53, 403–414.
doi: 10.1177/0018720811411297 [Google Scholar]
9. Seeingmachines Driver State Sensor. Availableonline: http:// www.seeingmachines.com/product/dss/ (Accessed on 21 November 2012).
10. Lexus, L.X. Driver Monitoring System. Availableonline: http:// www.lexus.eu/range/ls/key-features/safety/safety-driver-monitoring-system.aspx (accessed on 21 November 2012). 11. Papadelis, C.; Chen, Z.; Kourtidou-Papadeli, C.; Bamidis,
P.D.; Chouvarda, I.; Bekiaris, E. & Maglaveras, N. Monitoring sleepiness with onboard electrophysiological recordings for preventing sleep-deprived traffic accidents. Clinical
Neurophysiology, 2007, 118(9), 1906-1922.
doi: 10.1016/j.clinph.2007.04.031
12. Hu, S. & Zheng, G. Driver drowsiness detection with eyelid related parameters by support vector machine. Exp. Syst.
Appl 2009, 36, 7651–7658.
13. D. Suman; M. Malini & S. Anchuri, EOG based vigilance monitoring system. In Annual IEEE India Conference
(INDICON), New Delhi, 2015, pp. 1-6. doi: 10.1109/INDICON.2015.7443210
14. Lan-lan Chen.; Yu Zhao; Jian Zhang &Jun-zhong Zou. Automatic detection of alertness/drowsiness from physiological signals using wavelet-based nonlinear features and machine learning, Expert
Systems with Applications, Volume 42, Issue 21, 30 November
2015, Pages 7344-7355, ISSN 0957-4174. doi:10.1016/j.eswa.2015.05.028
15. Jagannath, M. & Balasubramanian, V. Assessment of early onset of Driver-Fatigue using multimodal fatigue measures in a static simulator. Applied Ergon. 2014, 45(4), 1140-7.
doi: 10.1016/j.apergo.2014.02.001.
16. Chin-Teng Lin., Ruei-Cheng Wu., Tzyy-Ping Jung., Sheng-Fu Liang., Teng-Yi Huang. Estimating Driving Performance Based on EEG Spectrum Analysis. EURASIP J. Appl. Signal
Processing, 2005, 19, 3165–3174.
17. Chin-Teng (Ct), Lin.; Ruei-Cheng, Wu.; Sheng-Fu, Liang.; Wen-Hung, Chao.; Yu-Jie, Chen. & Tzyy-Ping Jung R. EEG-based drowsiness estimation for safety driving using independent component analysis. IEEE Transactions On Circuits And
Systems—I: Regular Papers, 2005, 52(12).
doi:10.1109/TCSI.2005.857555
18. Kohitij Kar &Bart Krekelberg. Transcranial electrical stimulation over visual cortex evokes phosphenes with a retinal origin,
Journal Neurophysiology, 2012, 108 (8) 2173-2178.
doi: 10.1152/jn.00505.2012
19. Moser, D.; Anderer, P.; Gruber, G.; Parapatics, S.; Loretz, E.; Boeck, M.; Kloesch, G.; Heller, E.; Schmidt, A.; Danker-Hopfe, H.; Saletu, B.; Zeitlhofer, J. & Dorffner, G. Sleep classification according to AASM and rechtschaffen & kales: effects on sleep scoring parameters. SLEEP, 2009, 32(2),139-149.
PMCID: PMC2635577
20. Silber MH; Ancoli-Israel S; Bonnet MH et al. The visual scoring of sleep in adults. J. Clin. Sleep Med., 2007, 3(2), 121-131. PMID:17557422
21. Thiago L.T. da Silveira; Alice J. Kozakevicius & Cesar R. Rodrigues. Automated drowsiness detection through wavelet packet analysis of a single EEG channel. Expert Systems with
Applications, 2016, 55(15), 559-565.
doi: 10.1016/j.eswa.2016.02.041.
22. Vamsi, R.; Suman, D.; CH, N. &Malini M. Discrete Wavelet Transform based statistical features for the Drowsiness detection
from EEG. In The 16th International Conference on Biomedical
Engineering. IFMBE Proceedings, edited by Goh J., Lim C., Leo H. vol 61. Springer, Singapore, 2017.
doi: 10.1007/978-981-10-4220-1_17
23. Kecklund, G. & Akersted, T. Sleepiness in long distance truck driving: An ambulatory EEG study of night driving. Ergonomics, 36, 1007-1017.
doi: 10.1080/00140139308967973
AcKNowlEDGEMENTs
This work is financially supported by the University Grants commission, Govt.of India under the MRP grant F.No:4-4/2015-16(MRP/UGC-SERO). The authors also thank the TEQIP (Technical Education and Quality Improvement Program) Phase-II of World Bank initiative to promote technical education in India, for extending the financial support to procure the equipment, and Software. The authors extended their sincere gratitude to the staff, Department of Physiology, Apollo Institute of Medical Sciences for extending support in Sleep Scoring from the EEG signals.
Declaration of Conflict of Interests: The authors declare that there is no conflict of interest.
coNTrIbuTors
Mr suman Dabbu obtained his BE and ME in Bio Medical Engineering, from the Dept. of BME, University college of Engineering, Osmania University. currently he is working as an Assistant Professor, Department of BME, UcE(A), OU and puring pursuing his PhD from same department. He has 10 years of teaching and 6 years of research experience in the field of Bio signal acquisition and feature extraction. His research interests are to study the physiological parameters and their behaviour with relevant to different diseases, development of indigenous instruments for medical applications.
Dr M. Malini obtained BE in Biomedical engineering, from the University college of Engineering, Osmania University, Hyderabad, in 1988. MTech in Biomedical Engineering from IIT-Bombay, and PhD in Biomedical Engineering from Osmania University. She is
currently the Professor at the Department of Biomedical Engineering, University college of Engineering (A), Osmania University, Hyderabad, India. She has 25 years of teaching experience and 15 years of research experience. Her research interests include : Biomedical signal processing, medical instrumentation, brain computer interface, and embedded based medical instrumentation. She has published over 25 papers in journals and conferences.
Prof. b. ram reddy obtained his MBBS and MD in Physiology from the Osmania Medical college. currently He is the Professor & Head, Department of Physiology, Apollo Institute of Medical Scienc-es, Hyderabad. He has 35 years of teaching and Research experience in the field of Neuro Physiology.
Mr yashwanth sai reddy Vyza obtained his Bachelor from NIT Rourkela in 2017 in electronics and instrumentation engineering and is currently pursuing master’s in microelectronics at Delft University of Technology, The Netherlands. His research interests include bioelectronics and brain computer interfaces for rehabilitative applications.