R E S E A R C H
Open Access
Statistical learning methods as a preprocessing
step for survival analysis: evaluation of concept
using lung cancer data
Madhusmita Behera
1, Erin E Fowler
2, Taofeek K Owonikoko
1, Walker H Land
3, William Mayfield
4, Zhengjia Chen
5,
Fadlo R Khuri
1, Suresh S Ramalingam
1and John J Heine
2** Correspondence: john. [email protected]
2Department of Cancer
Epidemiology, H. Lee Moffitt Cancer Center & Research Institute, 12902 Magnolia Drive, MRC-CANCONT, Tampa, FL 33612, USA Full list of author information is available at the end of the article
Abstract
Background:Statistical learning (SL) techniques can address non-linear relationships and small datasets but do not provide an output that has an epidemiologic interpretation.
Methods:A small set of clinical variables (CVs) for stage-1 non-small cell lung cancer patients was used to evaluate an approach for using SL methods as a preprocessing step for survival analysis. A stochastic method of training a probabilistic neural network (PNN) was used with differential evolution (DE) optimization. Survival scores were derived stochastically by combining CVs with the PNN. Patients (n = 151) were dichotomized into favorable (n = 92) and unfavorable (n = 59) survival outcome groups. These PNN derived scores were used with logistic regression (LR) modeling to predict favorable survival outcome and were integrated into the survival analysis (i.e. Kaplan-Meier analysis and Cox regression). The hybrid modeling was compared with the respective modeling using raw CVs. The area under the receiver operating characteristic curve (Az) was used to compare model predictive capability. Odds ratios (ORs) and hazard ratios (HRs) were used to compare disease associations with 95% confidence intervals (CIs).
Results:The LR model with the best predictive capability gave Az = 0.703. While controlling for gender and tumor grade, the OR = 0.63 (CI: 0.43, 0.91) per standard deviation (SD) increase in age indicates increasing age confers unfavorable outcome. The hybrid LR model gave Az = 0.778 by combining age and tumor grade with the PNN and controlling for gender. The PNN score and age translate inversely with respect to risk. The OR = 0.27 (CI: 0.14, 0.53) per SD increase in PNN score indicates those patients with decreased score confer unfavorable outcome. The tumor grade adjusted hazard for patients above the median age compared with those below the median was HR = 1.78 (CI: 1.06, 3.02), whereas the hazard for those patients below the median PNN score compared to those above the median was HR = 4.0 (CI: 2.13, 7.14).
Conclusion:We have provided preliminary evidence showing that the SL
preprocessing may provide benefits in comparison with accepted approaches. The work will require further evaluation with varying datasets to confirm these findings.
Background
Statistical learning (SL) techniques with kernel mappings can provide benefits when addressing complicated decision problems [1-3]. These techniques are capable of cap-turing non-linear input-output characteristics, operating on small datasets with feature correlation, and do not require modeling or distribution assumptions. These attributes are not derived without tradeoffs. These methods do not provide an output that has a useful epidemiologic interpretation and their training often requires specialized techni-ques. In contrast, logistic regression (LR) modeling, Kaplan-Meier analysis, and Cox regression provide important epidemiologic interpretations and are used extensively due to their availability. This report is an advancement of our earlier simulation work [4] in adapting SL methods for epidemiologic application (see Appendix).
Lung cancer is the leading cause of cancer-related mortality in the world with more than a million deaths each year [5]. Lung cancer is often diagnosed at an advanced stage since early detection has been elusive [6]. Recent evidence indicates that lung cancer mortality can be reduced when screening high-risk patients with a low-dose computerized tomography (CT) scan [7]. Before this promising approach is incorpo-rated into general practice, several important outstanding clinical issues have to be addressed [6,7]. For patients with early stage lung cancer, local therapy with surgical resection is associated with the best survival outcomes. This is limited to those with non-small cell lung cancer (NSCLC), which accounts for approximately 85% of all cases of lung cancer in the United States. Despite optimal surgical resection, recur-rence of disease is noted in 30-75 percent of the patients based on the initial stage. Development of prognostic models for predicting survival outcomes for patients with NSCLC after resection will have important healthcare implications.
To adapt an SL methodology for epidemiologic application, a problem in NSCLC survi-val prognosis was analyzed for stage-1 patients using a relatively small set of variables col-lected routinely for patients of this kind, similar to those investigated previously [8]. A probabilistic neural network (PNN) [9] was combined with LR modeling and survival ana-lyses (i.e. Kaplan-Meier analysis and Cox regression) to demonstrate proof of concept. This hybrid approach combines the strengths of the SL methodology with these important epidemiologic techniques. The PNN is a statistically inspired neural network [9] that uses a kernel mapping [10,11] to estimate the underlying probabilities. For the LR modeling comparisons, the NSCLC dataset was dichotomized into two groups comprised of patients with favorable or unfavorable survival outcomes. Raw clinical variables and a new patient score variable formed with the modified PPN were considered as prognostic factors. Addi-tionally, the PPN output was used as the study variable and compared with age using sur-vival analysis. There are weight parameters within the PNN that must be estimated properly. Differential evolution (DE) was used for this optimization problem [12]. Stochas-tic methods were developed to provide feedback to the DE optimization and to derive the patient PNN scores. We also evaluated this new system with the simulated datasets and methods described previously [4], as discussed in the Appendix.
Methods Dataset
Stage-1 patients that had complete case ascertainment for the variables under consid-eration were selected. Ninety-two (n1) of these patients were alive at last contact
(cen-sored), and 59 (n2) patients died (incident) during the course of the contact interval.
The clinical variables abstracted from the patient files included age (i.e. age of the patient at the time of procedure), gender (binary), history of smoking (binary), histol-ogy sub-type (four categories), and tumor grade. Past or current smokers were categor-ized as smokers (yes), otherwise patients were charactercategor-ized as non-smokers (no). The four histological sub-types were: adenocarcinoma (AC), squamous cell carcinoma (SCC), large cell carcinoma (LCC), and adenosquamous carcinoma (ASC). Tumor grade is a 1-3 integer scale describing cancer cell differentiation (a measure of abnorm-ality) derived from pathology reports. This data was collected under an approved pro-tocol by the Western Institutional Review Board.
Modeling Techniques
Favorable Outcome and Survival Analysis
The non-interaction LR model [13] was used to predict favorable and unfavorable sur-vival outcome by dichotomizing the population into two groups. The 92 censored patients were designated as the favorable survival outcome group defined as group-1 (i. e. the censored group). Fifty-nine patients were designated as the unfavorable survival outcome group defined as group-2 (i.e. the incident group). Other methods of dichoto-mizing the population were considered but discarded as discussed in the Results Sec-tion. Overall survival (OS) time was measured as the distance between the date of procedure and the date of death for a given patient when applicable. Censor time was measured as the distance between the date of the procedure and the date that a given patient was censored, when applicable. The LR model was referenced to predict the probability of a favorable outcome. Age was treated as a continuous variable with inte-ger accuracy, and grade was considered as a three state continuous inteinte-ger variable (grades 1-3). Histology (four-state) and gender (two-state) were treated as categorical variables. Age and grade were combined to form a continuous patient score (or z) using a variation of the PNN. The reasons for this follow from the LR modeling (non-hybrid) findings and that they were treated as continuous variables, whereas the remaining variables were categorical or binary and not strictly amendable to probability density estimations. Kaplan-Meier product-limit estimators and Cox regression were used for the survival probability curve analyses. In this analysis, two groups were formed by choosing the median age and median PNN score as the separation points. The other relevant variables were introduced with both age and PNN score to evaluate their influence on the respective survival probability curves.
interpretation as provided by the fist method). For the Kaplan-Meier analysis, chi-square Wilcoxon (more sensitive to shorter term survival differences) and log-rank (more sensitive to longer term survival differences) tests were used for differences in stratification. Hazard ratios (HRs) were estimated with Cox Regression. Thirdly, Az was also derived from Cox regression and is a measure of the agreement between the model and actual time-to-event outcome [15]. For the ORs and HRs 95% confidence intervals (CI) were provided. The survival analysis was also performed with SAS.
Probabilistic Neural Network and Kernel Methods
We implemented a variation of the PNN using a Gaussian kernel, although there are many kernels meeting the established criteria [16]. Paralleling our earlier work [17], the distance metric for a d dimensional input vector (i.e. the relevant clinical variables) is given by
Di(w) = d
j=1
(wj−wij)2
σ2 j
, (1)
where i is the patient index, wijis the jthcomponent of the ith sample’s input vector,
and wjis the jthcomponent of a prospective test sample’s input vectorw. The
sigma-weights, sj, were estimated with DE optimization. Specifically, d = 2, with wi1= age,
and wi2= grade for the ith patient. The probability density estimation [10,11] forw
with n training samples is expressed as
g(w) = 1 n
n
i=1
exp[−Di(w)] =
1 n
n
i=1
k(w,wi). (2)
Normalization factors are discussed below. The PNN was constructed with the above formulism for each group. For group-1, the density for wis given by
g1(w) = 1 n1
n1
i=1
k(w,wi). (3)
For a givenw, the sum onwiis taken over group-1 samples only with n = n1. The g2
(w) density was estimated the same way by restricting the sum on wi to the group-2
samples with n = n2. In both the g1 and g2 estimations,wincluded samples from both
groups. Equation (3) also represents a function mapping of the vectors w and wi,
where each element of the summation represents the inner product of the mapped vectors [3], rendering a nonlinear problem tractable with the proper choice of kernel. Assuming prior probabilities and misclassification costs are equal, the PNN classifier [9] is expressed as
g1(w)
g2(w) >c, (4)
where c is a constant. For classification when this condition is met, wbelongs to group-1. Because we were interested in developing a score for each patient (not classi-fication), we formed this score with the above expression
patient−score = g1(w)
The multivariate normalization factors were not important because both g1and g2
contained the same sigma-weights. These scores were used with LR modeling and the survival analysis. Because the above expression is always positive and can be large, we used z = ln (patient - score) in the analyses as the PNN derived patient score and per-formed a range compression technique to reduce statistical outlier interference in the LR modeling.
Probabilistic Neural Network Training and Operation
The sigma-weights for the kernel in the PNN must be estimated properly. A stochastic cross-validation technique was developed in combination with DE to estimate these weights. DE is also a stochastic global optimization strategy that is self-organizing via feedback. We developed the algorithm described by the founders of DE [12] and used their notation in this description. Important points underlying DE were discussed in our previous work [17] and are briefly discussed here. We used a uniform crossover Cr = 0.9 and scale factor F = 0.2. The zero-generation feature vector population (i.e. NP = 40 vectors) was initialized with uniformly distributed random variables with compo-nents constrained to this range [0.01, 1.5]. For a given generation, the DE process con-structs a mutant vector (orvg) by stochastic perturbation from the current population
of x, where g is the generation index. From this, a candidate vector (orug) is
con-structed that competes with a given current generation vector, xg, selected at random
in such a way that it was not involved with the vg (orug) construction. Possible
solu-tions (xg and ug) compete against each other using feedback from the optimization
problem. The winner moves to the next generation ofx (i.e. g+1). For a given genera-tion there are NP competigenera-tions. In our DE applicagenera-tion, Az was the feedback measure using the two patient-score distributions derived from Eq. (5). The feedback to the DE was formed by ensemble averaging derived with bootstrap sampling [18]. For one DE generation, Ntbootstrap populations were generated. To form a given bootstrap
popu-lation, n2samples were selected randomly from group-1 and from group-2 with
repla-cement. We keyed on n2 as not to bias the sampling to the larger population. One
sample from each class was selected randomly and used aswin Eq. (5) to generate the respective patient-score quantities. The remaining samples were used to build the respectivewipopulations in Eq. (5). We refer to this process as a leave two-out
sto-chastic cross-validation technique. When Nt= 1, the process is similar to the
conven-tional leave two-out approach using different realizations of the population. This process then was repeated Nt(i.e. training) times and the average Az was used as
feed-back for one DE generation. The process was terminated after G generations. The weights that provided the largest Az were carried over to the analysis and used to gen-erate z for each patient using stochastic methods and ensemble averaging. For a given
w, a bootstrap population was generated from the wipopulation and the respective z
was generated for all n1 and n2 patients. Each patient’s z was derived from ensemble
averaging by repeating this process for Nsc times. The training process and final score
Results
Favorable Outcomes
The patient characteristics are summarized in Table 1. To assess inter-group differ-ences in these clinical variables, a t-test was used for continuous variable comparisons, and the binomial proportional test (with the normal approximation) was used for the categorical or binary variable comparisons, where applicable. As shown in the right most column of Table 1, the censored group patients are younger, more likely female, tend to have grade 1 disease, and the smoking status is similar. The censored group is more likely to have AC in comparison with the incident group, whereas the other his-tology-type and other grade differences are less clear in the summary format. The stan-dard LR modeling (i.e. raw clinical variables or accepted approach) findings are shown in Table 2 (top). A one SD increase in age (SD = 8.68 years) indicates the respective patient is 0.60 times more likely to be in group-1 (or 1.66 times more likely to be in group-2 and not survive), which was significant. The OR for the tumor grade adjusted model shows a trend. A unit increase in grade indicates a given patient is about 1.5 times more likely to be in group-2, but this association was not significant. When introducing gender with age and grade, the gender association OR = 0.38 was signifi-cant indicating females are 2.6 times more likely have a favorable outcome. The adjust-ments for grade and gender had a minor influence on the age ORs. However, adding these variables increased the model’s predictive capability: Az = 0.636 (age alone), Az =
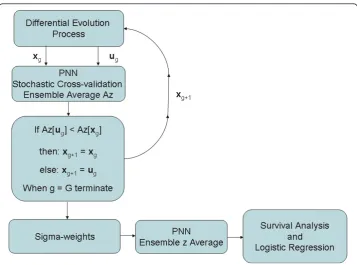
Figure 1Modified probabilistic neural network stochastic training and z generation flow diagram. This schema shows the modified probabilistic neural network (PNN) training flow for the differential evolution (DE) sigma-weight vector construction, competition, and feedback from the g to the g+1 populations. The sigma-weight vectorsxgandugcompete for the next generation. The receiver operating
0.657 for age and grade, and Az = 0.703 for age, grade, and gender. The standard error (SE) in Az was estimated as SE = 0.03. Adding histological-type and smoking status with gender and grade produced marginal influences on the relationships (not shown). In summary, younger age, lower-grade, and gender (female) confer a favorable survival outcome. The weak association for grade with survival could be due to limited sam-ples, the association is truly marginal, or the relationship is complicated and cannot be captured with the LR model. To assess these possibilities, grade was combined with age using a variation of the PNN classifier.
Table 1 Patient characteristics.
Characteristic Incident n Incident mean/SD or % Censored n Censored mean/SD or % p-value
Age 59 69.58/7.85 92 65.42/8.84 0.0038*
Grade 59 2.22/0.62 92 2.10/0.68 0.2651*
One 6 10.17% 17 18.48% 0.1656
Two 34 57.63% 49 53.26% 0.5988
Three 19 32.20% 26 28.26% 0.6053
Gender
Male 38 64.41% 34 36.96% 0.0010
Female 21 35.59% 58 63.04% 0.0010
Histology subtype
Adenocarcinoma 29 49.15% 58 63.04% 0.0919
Squamous 25 42.37% 20 21.74% 0.1510
Large Cell 3 5.08% 11 11.96% 0.1555
Adenosquamous 2 3.39% 3 3.26% 0.9655
Smoking status
Non-Smoker 12 20.34% 19 20.65% 0.9629
Smoker 47 79.66% 73 79.35% 0.9629
The patient characteristics are summarized in this table. The incident column refers to group-2 patients (unfavorable survival outcome) and the censored column refers to group-1 patients (favorable survival outcome). The mean and standard deviation (SD) are provided for the continuous variables and percentages (%) are provided for the other variables by group. The number of patients (n) for each variable is given for each group. The incident and censored group characteristics were compared with either the t-test (*) or binomial proportional test. The relevant p-values are provided in the last column (right).
Table 2 Odds Ratios.
Model SD Age OR Az Covariate Unit Covariate OR
Accepted
Age 8.681 0.60
(0.42, 0.86) 0.636
Grade adjusted 8.681 0.58 (0.40, 0.83)
0.657 Grade 1 0.68
(0.40, 1.15) Grade and Gender adjusted 8.681 0.63
(0.43, 0.91)
0.703 Grade 1 0.73
(0.42, 1.25) Gender Male vs Female 0.38
(0.19, 0.78)
Model SD ln(z) OR Az Covariate Unit Covariate OR
Hybrid
z (Age and Grade) 1.695 4.15 (2.15, 8.01)
0.763
Gender adjusted 1.695 3.67 (1.88, 7.16)
0.778 Gender Male vs. Female 0.50 (0.24, 1.05)
The DE training for the modified PNN resulted in two sigma-weights with s1 = 0.013610961 and s2= 0.35805283 for age and grade, respectively. Using Nt= 1
pro-duced training Az values between 0.700-0.830. Choosing Nt= 5 gave consistent
find-ings and was used in the analysis. The stochastic cross-validation performance coinciding with these weights gave Az = 0.710 with SE = 0.03 after three generations (G = 3), which is in agreement with the Az derived from holdout cross-validation ana-lysis (see Appendix). We used these parameters to generate z for each patient with Nsc
= 20. Processing age and grade separately through the PNN gave Az = 0.656 for age and Az = 0.538 for grade, which are statistically similar to the Az values when asses-sing these variables individually without the PNN procesasses-sing. The continuous hybrid LR findings are shown in the bottom of Table 2. The combined effect shows that for a SD increase in z (SD = 1.69), the respective patient is about 4.15 times more likely to experience a favorable survival outcome (or incident group member is 0.24 more likely to experience a favorable outcome) with Az = 0.763, which was significantly larger (p = 0.0062) than that provided by the respective age and grade LR model. Due to the way the PNN was defined, increasing z was protective, whereas increasing in age was not. Adjusting for gender increased the predictive capability of the model with Az = 0.778 (SE = 0.03), although the gender OR lost significance. Gender also reduced the association for z with OR = 3.67 per standard deviation increase, which was a stronger association than provided by age in the corresponding model. The Az derived from the hybrid model (z and gender) was significantly greater than that of the corresponding LR model with age, grade, and gender (p = 0.0173). As above, including histology-type or smoking status with z had a marginal influence on the relationships (not shown).
To evaluate the effect of the kernel mapping on age and grade, the LR model outputs for the two models were plotted as a function of grade and age. The left side of Figure 2 shows the grade plots for the LR (accepted approach with age and grade) model. The respective grade plots for the hybrid LR model using z (age and grade combined) are shown on the right side of Figure 2. In these plots black was used to denote cen-sored group samples and red to denote incident group samples. The grade 1 plots for both models exhibit similar behavior for the lower ages and show that patients 65 years of age and younger are more likely to be in censored group. The hybrid model separates some older grade 1 patients in contrast with the accepted LR model. A com-parison of the grade 2 plots shows that the hybrid model provides separation for the younger, middle age, and some upper age patients, whereas the respective accepted LR model produces confusion between the groups. In the grade 3 plots, both models pro-vide separation for lower age patients, whereas the hybrid model shows group separa-tion in the middle-age range as well. Because z is a composite variable and difficult to interpret, the associations between age, grade, z, and group status shown in Figure 2 are also summarized in Table 3. This provides the average values for age and the z variables separated by grade and group.
dichotomization method. Other methods of dichotomizing the population were consid-ered, such as choosing a cutoff-point at given OS time but this technique added ambi-guity with those censored on the left-side of the cut-point and left few samples on the right-side of the cut-point when considering four or five year OS times as the demarcation.
Survival Analysis
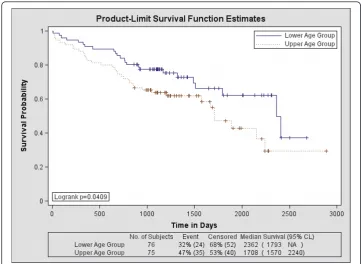
The Kaplan-Meier survival probability curves for age are shown in Figure 3. The related findings are provided in Table 4. The hazard for age was HR = 1.72 indicating that upper-age group membership is significantly more hazardous than lower-age group membership. Roughly, 37% of the lower-age group survived past 7 years, whereas about 29% of the upper-age group survived past this time. The longer-term
Figure 2Logistic regression model output for each tumor grade. The plots on the left show the logistic regression model probabilities (P) using the age and grade variables as the model inputs for each tumor grade. The plots on the right show the respective hybrid logistic regression model probabilities (P) using the variable z (i.e. age and grade combined with the probabilistic neural network) as the model input. Because there are overlapping points (patients with the same grade and age), some points are not distinguishable. The censored group (black) is compared with the incident group (red). The curves were fitted with a cubic spline.
Table 3 Age and z relationships.
Censored group Grade 1 Grade 2 Grade 3 All
n 17 49 26 92
Age (mean) 66.41 66.27 63.19 65.42
z (mean) 2.11 3.91 3.12 3.36
Incident group Grade 1 Grade 2 Grade 3 All
n 6 34 19 59
Age (mean) 73.83 68.88 69.47 69.58
z (mean) 0.26 1.37 -0.07 0.8
survival is significantly different between the two age groups (p < 0.050). Including grade induced a greater hazard with HR = 1.78, but the change in the survival curves when controlling for grade was not significant in either the short term (p = 0.074) or the longer-term (p = 0.091). The addition of gender caused a significant change in the survival curves compared with age alone for both the short term (p < 0.002) and long-term survival (p < 0.005) but the HR = 1.64 lost significance. The grade and gender adjusted hazard for age was HR = 1.68 (also lost significance). The statistical test find-ings for age and gender are provided in Table 5 (top rows). The survival probability curves for z are shown in Figure 4 and the HRs are provided in Table 4. There is a sig-nificant survival difference between these upper and lower-z groups both in the short term (p < 0.0001) and long term (p < 0.0001) with HR = 0.25 indicating those in the upper-z group are at a significantly reduced hazard compared with those in the lower z group (i.e. the hazard for those in the lower-z membership was HR = 4.0). About 52% of the upper-z group survived past 7 years, whereas as about 11% of the lower-z group survived past this time. The addition of gender also produced a significant change in both short term (p = 0.0146) and the longer term (p = 0.0319) with HR = 0.28 (HR = 3.57 for lower-z membership). The associated statistical comparisons for z and gender are provided in Table 5 (bottom two rows). As shown in Table 4, the hybrid Cox model (i.e. using z) showed greater concordance (Az = 0.691) with the out-come than that of the Cox model (accepted approach) using age and grade (Az = 0.606), but the difference in Az was a trend (p = 0.056). Likewise, the Az comparison between the hybrid Cox model using z and gender (Az = 0.738) with the Cox model using age, grade, and gender (Az = 0.677) showed a similar trend (p = 0.0747). The
favorable prognostic values for both age and gender are in agreement with other stu-dies [8,19].
Discussion
A technique for incorporating SL methods with epidemiologic analyses was illustrated. The approach used ensemble averaging based on bootstrap sampling. These prelimin-ary findings indicate the hybrid approach provided benefits. With this data, the hybrid approach provided greater Az in the logistic regression modeling and greater hazard relationships in the survival analyses than that of the accepted approaches. The inter-nal validity of our findings is supported by the ainter-nalysis provided in the Appendix. This approach represents a framework that is easily generalized. We used the SL output as the input into LR model and survival analysis, essentially combining the strengths of the various modeling techniques. In this capacity, the SL device was operating as fron-tend preprocessing step for these accepted analysis techniques. Processing the SL out-put with these approaches provides a mechanism for converting the SL outout-put into epidemiologic metrics (i.e. ORs and HRs). We used a relatively simple SL device to demonstrate the concept with a two-class problem. This specific approach can be extended to include more than two classes (e.g. death, greater than three, and five year
Table 4 Hazard relationships for dichotomous age and z.
Model Age Hazard Ratio Az
Accepted
Dichotomous Age 1.72 (1.02, 2.90) 0.5792
Grade adjusted 1.78 (1.06, 3.02) 0.606
Gender adjusted 1.64 (0.96, 2.78) 0.669
Grade Gender adjusted 1.68 (0.99, 2.85) 0.677
Model z Hazard Ratio Az
Hybrid
Dichotomous z 0.25 (0.14, 0.47) 0.691
Gender adjusted 0.28 (0.15, 0.53) 0.738
For the age and z variables, two groups were formed using the respective distribution median as the cut-point and compared. The hazard ratios (HRs) are provided parenthetically with 95% confidence intervals. The area under the receiver operating characteristic curves (Azs) derived from Cox regression models are also provided. Because age and z translate inversely with respect to hazard, increased age confers a greater hazard while decreased z confers a greater hazard. To make HR comparisons of z with age, the reciprocal of the z HR is required.
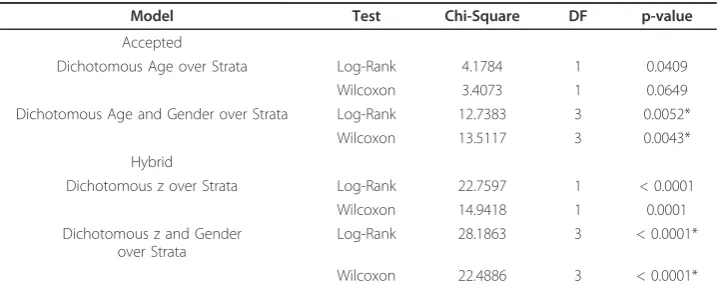
Table 5 Survival probability statistical test summaries.
Model Test Chi-Square DF p-value
Accepted
Dichotomous Age over Strata Log-Rank 4.1784 1 0.0409
Wilcoxon 3.4073 1 0.0649
Dichotomous Age and Gender over Strata Log-Rank 12.7383 3 0.0052*
Wilcoxon 13.5117 3 0.0043*
Hybrid
Dichotomous z over Strata Log-Rank 22.7597 1 < 0.0001
Wilcoxon 14.9418 1 0.0001
Dichotomous z and Gender over Strata
Log-Rank 28.1863 3 < 0.0001*
Wilcoxon 22.4886 3 < 0.0001*
survival benchmarks). The PNN applies to multiclass problems, as well, and multino-mial logistic regression can address multiple level outcomes. It could be argued that the LR modeling was suboptimal because the time-to-event variable resolution was reduced to a coarser dichotomous variable. However for a specific set of variables, the LR output provides a different metric (i.e. probability of having a favorable outcome) than that provided by Cox regression (i.e. instantaneous relative risk). Thus, the resolu-tion reducresolu-tion is the price paid for an alternative output. More generally, the same hybrid approach is applicable for the output of any other type of SL method or deci-sion device (e.g. support vector machines, kernel based partial least squares, or other types of neural networks).
There are several limitations with our findings. The analysis was performed with a limited number of samples derived retrospectively. Censoring limits the survival time estimations. Although the DE is a robust approach, there is no guarantee that it will converge indicating that the findings may be less than optimal. The generation termi-nation limit, G = 3, was empirically set because we found that letting the process evolve over many generations produced weights that were too finely tuned and did not provide performance consistency between the training evaluation and the final score assessments. Because the dataset was limited, further evaluation using both simulation methods and holdout cross-validation with the z-score was provided in the Appendix. The findings from the hybrid modeling will require further evaluations with different datasets to show generalization. In principle to use a system as illustrated here in prac-tice, the sampled patient population should be representative of stage-1 lung cancer patients in general. The operation of this system with new datasets would relegate this
current dataset to assume the position of wi in the final score generation using
pro-spective samples as w(without further training) to generate z for assessing survival probabilities or predicting favorable outcomes. The SL method was trained with a dichotomized survival output, which was the same output used to train the hybrid LR model. Therefore, the corresponding hybrid LR model (or the survival curve separa-tion) could be confounded by the z variable if the choice of kernel or weights were suboptimal. Determining the optimal kernel was beyond the scope of this research.
Generalization of the LR model and incorporating kernel based techniques into epi-demiologic survival analyses represents a diverse field of inquiry. Earlier research used a PNN and LR modeling to predict survival in early stage NSCLC but did not fuse the models [20]. Logistic regression is a member of a family of generalized linear models. Replacing the LR argument with various forms of smooth functions has provided bene-fits in the study of colon-cancer [21], heart-disease [22] and infant mortality [23]. Other researchers have incorporated univariate kernel density estimations for studying prostate-cancer [24], health disparities [25], and nutrient intake [26]. Similarly, univari-ate kernel density estimations have been used to estimunivari-ate summary measures that were incorporated into LR modeling in fast-food consumption studies [27]. Our work differs from this other work in that the PNN application makes no assumption con-cerning the functional relationship of the variables under study and we incorporated the measures into LR.
Conclusion
An SL methodology comprised of DE optimization, a kernel mapping, and stochastic ensemble averaging was presented as an illustration to generalize widely used analysis techniques. The technique gives the SL methodology an epidemiologic interpretation. Although we used a specific example, the framework applies to all situations where LR modeling and survival analysis are appropriate. The approach can be easily modified to include as many input variables as required and new samples can be added into the training procedure with the proper clinical feedback indicating the system can learn continually without computer processing demands due to its relative simplicity. The system will require further evaluation with different datasets before it can be applied in practice.
Appendix
Additional evaluation was performed to assess the PNN z score method that included a simulation study and holdout cross-validation analysis.
Simulation evaluation
A simulation was performed to assess the training, optimization, and patient scoring system shown in Figure 1 under ideal conditions. We used the same simulation meth-ods with two correlated input features and non-linear separation boundary as described in our earlier work [4]. We used 200 samples per class giving 400 samples total as previously for the training dataset. We used this training dataset to estimate the sigma-weights using the algorithm described above (Figure 1). We used the same stochastic averaging (N t= 5, and Nsc = 20) and bootstrap methods. We stopped the
used for wiin the score generation using independent data. We then simulated an
eva-luation dataset of the same dimension (200 per class giving 400 samples total) that was not used in the sigma-weight generation. These new samples were then used as win the stochastic score generation and evaluated. This evaluation gave Az = 0.979. This shows in principle, the system is viable and that the training distribution must be representative of the population. It is also worth noting that the separation provided by this modified PNN system was larger than that described previously using a differ-ent statistical learning system when processing the same type of simulated datasets (i.e. Az≈0.950).
Holdout cross-validation
To assess the internal validity of the approach, we used the scheme shown in Figure 1 with one main difference. Two patient samples (one sample from each group) were selected at random and held out (i.e. leave two-out cross-validation) of the training process To slow the DE convergence, we set Cr = 0.1. The system comprised of the remaining n-2 patients was trained for 20 DE generations for each holdout pair. These n-2 samples were used for training and for generating training z scores (age combined with grade with the PNN) and Azs. For each DE generation, a bootstrap population was generated from the fixed n-2 population and an Az was generated. The weights that gave the largest Az for the 20 DE generations were used to generate the z scores for the two samples (holdout pair). We used stochastic averaging for the output scores, where 20 bootstrap populations were generated from the fixed n-2 training samples (generated 20 scores for each of the two left out samples). This process cycled (i.e. choosing another pair at random leaving a new n-2 training population for the next 20 DE generations) until all patients received a score. The resulting leave two out cross-validations gave Az = 0.700, indicating the approach was internally valid.
Acknowledgements
The authors thank Dr. Robert C. Hermann, Northwest Oncology Center, Marietta GA, for his efforts in the data collection for this project. Drs. Owonikoko, Khuri, and Ramalingam are Distinguished Cancer Scholars of the Georgia Cancer Coalition.
Author details
1Department of Hematology and Medical Oncology, Emory University, Winship Cancer Institute, 1365 Clifton Road NE,
Rm C-3090, Atlanta, GA 30322, USA.2Department of Cancer Epidemiology, H. Lee Moffitt Cancer Center & Research Institute, 12902 Magnolia Drive, MRC-CANCONT, Tampa, FL 33612, USA.3Thomas J. Watson School of Engineering,
Binghamton University, State University of New York, PO Box 6000, Binghamton, NY 13902-6000, USA.4WellStar Kennestone Hospital, Marietta, GA 30060, USA.5Biostatistics & Bioinformatics Shared Resource at Wnship Cancer
Institute, Department of Biostatistics & Bioinformatics, Rollins School of Public Health, Atlanta, GA, USA.
Authors’contributions
MB is the primary author and was instrumental in designing and developing the work and performed data analyses. EEF is the secondary author, performed data analyses, assisted in developing the differential evolution and statistical learning methods with MB and JJH. TKO reviewed and edited the manuscript. WHL provided expertise used in the statistical learning developments, reviewed and edited the manuscript. WM was instrumental in the data collection protocol implementation, reviewed and edited the manuscript. ZC reviewed and edited the manuscript. FRK reviewed and edited the manuscript. SSR was the Principal Investigator for the protocol involving the tumor tissue and clinical data collection, reviewed and edited the manuscript. JJH is the senior author and played an important role in the development of the statistical learning system and data analyses. All authors have read and approved the final manuscript.
Competing interests
The authors declare that they have no competing interests.
References
1. Vapnik VN:The Nature of Statistical Learning Theory.NY: Springer;, Second 2000. 2. Vapnik VN:Statistical Learning Theory.NY: John Wiley & Sons, Inc.; 1998.
3. Shawe-Taylor J, Cristianini N:Kernel Methods for Pattern Analysis.Cambridge, UK Cambridge University Press; 2004. 4. Heine JJ, Land WH, Egan KM:Statistical learning techniques applied to epidemiology: a simulated case-control
comparison study with logistic regression.BMC Bioinformatics2011,12:37.
5. Manser RL, Irving LB, Byrnes G, Abramson MJ, Stone CA, Campbell DA:Screening for lung cancer: a systematic review and meta-analysis of controlled trials.Thorax2003,58(9):784-789.
6. Bach PB:Inconsistencies in findings from the early lung cancer action project studies of lung cancer screening.J Natl Cancer Inst2011,103(13):1002-1006.
7. Team NLSTR, Aberle DR, Adams AM, Berg CD, Black WC, Clapp JD, Fagerstrom RM, Gareen IF, Gatsonis C, Marcus PM,
et al:Reduced lung-cancer mortality with low-dose computed tomographic screening.N Engl J Med2011, 365(5):395-409.
8. Montesinos J, Bare M, Dalmau E, Saigi E, Villace P, Nogue M, Angel Segui M, Arnau A, Bonfill X:The changing pattern of non-small cell lung cancer between the 90 and 2000 decades.Open Respir Med J2011,5:24-30.
9. Specht DF:Probabilistic neural networks.Neural Networks1990,3:109-118.
10. Parzen E:On estimation of a probability density function and mode.Annals of Mathematical Statistics1962, 33(3):1065-1076.
11. Cacoullos T:Estimation of a multivariate density.Annals of the Institute of Statistical Mathematics1966,18(1):179-189. 12. Price KV, Storn RM, Lampinen JA:Differential Evolution: A Practical Approach to Global Optimization.Heidelberg:
Springer; 2005.
13. Hosmer DW, Lemeshow S:Applied Logistic Regression.NY: John Wiley & Sons, Inc.;, second 2000.
14. Hanley JA, McNeil BJ:The meaning and use of the area under a receiver operating characteristic (ROC) curve.
Radiology1982,143(1):29-36.
15. Pencina MJ, D’Agostino RB:Overall C as a measure of discrimination in survival analysis: model specific population value and confidence interval estimation.Stat Med2004,23(13):2109-2123.
16. Mercer J:Functions of positive and negative type, and their connection with the theory of integral equations.
Philosophical Transactions of the Royal Society of London Series A, Containing Papers of a Mathematical or Physical Character1909,209:415-446.
17. Land WH Jr, Margolis D, Kallergi M, Heine JJ:A Kernel Approach for Ensemble Decision Combinations with two-view Mammography Applications.International Journal of Functional Informatics and Personalised Medicine2010,
3(2):157-182.
18. Efron B, Tibshirani RJ:An Introduction to the Bootstrap.Boca Raton, FL: Chapman & Hall/CRC; 1993.
19. Albain KS, Crowley JJ, LeBlanc M, Livingston RB:Survival determinants in extensive-stage non-small-cell lung cancer: the Southwest Oncology Group experience.J Clin Oncol1991,9(9):1618-1626.
20. Marchevsky AM, Patel S, Wiley KJ, Stephenson MA, Gondo M, Brown RW, Yi ES, Benedict WF, Anton RC, Cagle PT: Artificial neural networks and logistic regression as tools for prediction of survival in patients with Stages I and II non-small cell lung cancer.Mod Pathol1998,11(7):618-625.
21. Zhao LP, Kristal AR, White E:Estimating relative risk functions in case-control studies using a nonparametric logistic regression.Am J Epidemiol1996,144(6):598-609.
22. Abrahamowicz M, du Berger R, Grover SA:Flexible modeling of the effects of serum cholesterol on coronary heart disease mortality.Am J Epidemiol1997,145(8):714-729.
23. Gage TB, Fang F, O’Neill E, Stratton H:Maternal age and infant mortality: a test of the Wilcox-Russell hypothesis.Am J Epidemiol2009,169(3):294-303.
24. Savage CJ, Lilja H, Cronin AM, Ulmert D, Vickers AJ:Empirical estimates of the lead time distribution for prostate cancer based on two independent representative cohorts of men not subject to prostate-specific antigen screening.Cancer Epidemiol Biomarkers Prev2010,19(5):1201-1207.
25. Osypuk TL, Acevedo-Garcia D:Are racial disparities in preterm birth larger in hypersegregated areas?Am J Epidemiol
2008,167(11):1295-1304.
26. Vercambre MN, Fournier A, Boutron-Ruault MC, Clavel-Chapelon F, Ringa V, Berr C:Differential dietary nutrient intake according to hormone replacement therapy use: an underestimated confounding factor in epidemiologic studies?
Am J Epidemiol2007,166(12):1451-1460.
27. Moore LV, Diez Roux AV, Nettleton JA, Jacobs DR, Franco M:Fast-food consumption, diet quality, and neighborhood exposure to fast food: the multi-ethnic study of atherosclerosis.Am J Epidemiol2009,170(1):29-36.
doi:10.1186/1475-925X-10-97