R E S E A R C H A R T I C L E
Open Access
An application of a pattern-mixture model
with multiple imputation for the analysis of
longitudinal trials with protocol deviations
Abdul-Karim Iddrisu
*and Freedom Gumedze
Abstract
Background: The benefit of a given treatment can be evaluated via a randomized clinical trial design. However, protocol deviations may severely compromise treatment effect since such deviations often lead to missing values. The assumption that methods of analysis can account for the missing data cannot be justified and hence methods of analysis based on plausible assumptions should be used. An alternative analysis to the simple imputation methods requires unverifiable assumptions about the missing data. Therefore sensitivity analysis should be performed to investigate the robustness of statistical inferences to alternative assumptions about the missing data.
Aims: In this paper, we investigate the effect of tuberculosis pericarditis treatment (prednisolone) on CD4 count changes over time and draw inferences in the presence of missing data. The data come from a multicentre clinical trial (the IMPI trial).
Methods: We investigate the effect of prednisolone on CD4 count changes by adjusting for baseline and time-dependent covariates in the fitted model. To draw inferences in the presence of missing data, we investigate sensitivity of statistical inferences to missing data assumptions using the pattern-mixture model with multiple imputation (PM-MI) approach. We also performed simulation experiment to evaluate the performance of the imputation approaches.
Results: Our results showed that the prednisolone treatment has no significant effect on CD4 count changes over time and that the prednisolone treatment does not interact with time and anti-retroviral therapy (ART). Also, patients’ CD4 count levels significantly increase over the study period and patients on ART treatment have higher CD4 count levels compared with those not on ART. The results also showed that older patients had lower CD4 count levels compared with younger patients, and parameter estimates under the MAR assumption are robust to NMAR assumptions.
Conclusions: Since the parameter estimates under the MAR analysis are robust to NMAR analyses, the process that generated the missing data in the CD4 count measurements is missing at random (MAR). The implication is that valid inferences can be obtained using either the likelihood-based methods or multiple imputation approaches.
Keywords: Likelihood-based methods, Missing at random, Multiple imputation, Not missing at random, Pattern-mixture model, Protocol deviation, Sensitivity analysis
Background
The benefit of trial medication may be evaluated through a randomized clinical trials design. Randomized clini-cal trials with longitudinal follow-up are central to the evaluation of treatments. However, statistical inferences from the resulting analysis is almost always complicated
*Correspondence:[email protected]
Department of Statistical Sciences, University of Cape Town, Rondebosch, 7701 Cape Town, South Africa
because subjects might deviate from the protocol [1]. The study protocol sets out the objective and procedure of conducting the trial.
Given the trial setting and the specific question, such deviations may include poor compliance with, or with-drawal from the intervention; unblinding, either of inter-vention or evaluation; and loss to follow-up, so that no further information on the patient is available [1]. These deviations complicate the analysis because (to address
both primary and secondary questions), there is the need to make assumptions about the unobserved data [1, 2]. These assumptions are often not verifiable. There is now an increase in awareness that such assumptions have the potential to introduce implicit ambiguity into the infer-ences that can be drawn [1, 3, 4]. In addition, inappro-priate assumptions about the unobserved data may lead to biased estimates of the treatment effect. The extent to which such inappropriate assumptions are practical issues will depend both on the precise question, and on how the extent and nature of deviations from the pro-tocol affect this question [1]. Most often, regulators and analysts will require some level of confidence that infer-ences are robust to plausible departures from the pri-mary assumptions that govern the main analysis. This gives an indication that such inferences require sensitivity analyses [1].
It is known that missing data may severely compro-mise statistical inferences from clinical trials. However, missing data has received little attention in the clinical-trials research [5] and existing regulatory guidelines [6] on design, conduct, and analysis of clinical trials have lim-ited advice on how to handle missing data. The national research council (NRC) report [3] outlined recommenda-tions for handling missing data in clinical trials.
There is now increasing attention to the importance of conducting sensitivity analysis in the biomedical research. For instance, Section 7 of the new EMA guideline on miss-ing data in confirmatory clinical trials [7] is devoted to this issue. It states “The sensitivity analyses should show how different assumptions influence the results obtained.” In addition, recommendation 15 of the NRC report [3] recommended that “sensitivity analyses should be part of the primary reporting of findings from clinical tri-als. The sensitivity to the assumptions about the missing data mechanism should be a mandatory component of reporting.”
Sensitivity to missing data can be conducted based on three modeling frameworks [8]. In the selection model-ing (SeM) framework, the joint distribution of the mea-surement and the dropout processes is factored as the marginal distribution of the measurement process and the conditional distribution of the dropout process, given the measurements [8, 9]. The pattern-mixture model (PMM) is a reverse factorization of the SeM defined as the marginal distribution of the dropout process and the conditional distribution of the measurement process given the dropout process [2,8]. For the shared-parameter model (SPM), a set of latent variables (random effects) is assumed to be shared between the measurement and the dropout processes [8, 10]. It is conventionally assumed that conditional on this set of random effects, no fur-ther dependency exists between the measurement and the dropout process, although this can be generalized
[11]. Yuan and Little [12] proposed mixed-effect hybrid models (MEHMs) framework, where the joint distribution of the measurement process and dropout process is fac-torized into the marginal distribution of random effects, the dropout process conditional on random effects, and the outcome process conditional on dropout patterns and random effects. Carpenter and colleagues [1] proposed the pattern-mixture model with multiple imputation (PM-MI) approach in order to conduct sensitivity analysis. Ratitch and colleagues [13] considered sensitivity analy-sis approaches based on the pattern-mixture model, and Mallinckrodt and colleagues [14] considered selection model based approaches [9] and the PM-MI approach [1] to conduct sensitivity analyses. Permutt and colleagues [15] examined previous ideas of sensitivity analysis with a view to explaining how the NRC panel’s recommenda-tions are different and possibly better suited to coping with present problems of missing data in the regulatory setting. They also discussed, in more detail than the NRC report, the relevance of sensitivity analysis to decision-making, both for researchers and for regulators. In this paper, we applied the PM-MI approach of Carpenter and colleagues to investigate the effect of prednisolone treat-ment on CD4 count changes over time and to investi-gate sensitivity of inferences to missing data assumptions [8,16,17] using the incomplete CD4 count data from the IMPI trial [18,19]. Carpenter and colleagues [1] applied the PM-MI approach to longitudinal data but used models which assumed independent observations, i.e., they fitted models to values at the last visit, whereas in the models in this paper we considered CD4 count measurements at all visits.
Description of the IMPI trial data
In this paper, we used data from the IMPI trial [18,19]. The IMPI trial was a multicentre international random-ized doubled-blind placebo-controlled 2 × 2 factorial study. The IMPI trial tested prednisolone and Mycobac-terium indicus pranii (M. indicus pranii) immunotherapy treatments in TB pericarditis patients in Africa. TB peri-carditis leads to high mortality especially in countries with limited resource and with concomitant epidemics of human immunodeficiency virus (HIV) infection [18,19]. Tuberculous pericarditis is associated with high morbidity and mortality even if anti-tuberculosis treat-ment is taken as directed [19]. A reduction in the strength of the inflammatory response in TB pericarditis may improve patients conditions by reducing cardiac tampon-ade and pericardial constriction. However, whether the use of adjunctive immunomodulation with corticosteroids and M. indicus pranii can safely reduce mortality and mor-bidity is uncertain [19]. To investigate whether adjunctive immunomodulation with corticosteroids and M. indicus pranii can safely reduce mortality and morbidity, Mayosi and colleagues set up the IMPI trial [18,19].
In total, 1400 patients with definite probable tuber-culosis pericardial effusion, from 9 African countries in 19 centers were enrolled in the four-year trial. Eli-gible patients were randomly assigned to receive oral pill prednisolone for 6 weeks and M. indicus pranii or placebo for 3 months. Patients were followed up at weeks 2, 4, and 6 and months 3 and 6 during the inter-vention period and 6-monthly thereafter for up to 4 years [18].
The main aim of the IMPI trial was to assess the effec-tiveness and safety of oral pill prednisolone and M.w injec-tion in reducing the time to first occurrence of the primary composite outcome of death, pericardial constriction, or cardiac tamponade requiring pericardial drainage in with TB pericardial effusion [19]. In this paper, we assessed the effect of trial medication (prednisolone) on CD4 count changes over time. A large proportion of the TBP patients were also co-infected with HIV (42%). Hence the inter-est in invinter-estigating the effect of prednisolone among HIV positive (denoted as HIV+) patients. We restricted our analysis to HIV positive (denoted as HIV+) patients only who have at least two CD4 count values observed. In the IMPI trial, patients who were confirmed HIV+ at the time of randomization or confirmed to be HIV+ dur-ing the trial, were given a standard of care (ART) and their CD4 count were measured at some visits. Mayosi and colleagues [19] results showed that the oral pill pred-nisolone and M. indicus pranii do not interact and hence, treatments arms were analyzed separately with their cor-responding placebo arms. Also, their results showed that prednisolone reduces the risk of constriction whereas M. indicus pranii was not effective. We considered analysis
of the CD4 count measurements under the prednisolone treatment and its corresponding placebo arm only. The analysis of CD4 count data is restricted to the mandated periods for CD4 count measurements; baseline, week 2, months 1, 3 and 6. However, most South Africa cen-tres continued to measure CD4 count at months 24, 36 and 48 scheduled visit time. These data were excluded in this analysis. A majority of patients had unobserved CD4 count with 72%, 84%, 93% as missingness proportions for the months 24, 36 and 48, respectively.
In this paper, we applied the PM-MI approach to non-monotone and monotone missing data patterns. For non-monotone missing data pattern, patients can be missing at any scheduled visit and then be observed at the subsequent visit. For monotone missing data pattern, if theithpatient is missing at schedule visitj, then this same patient will be missing at the next scheduled visitj+1.
Non-monotone data
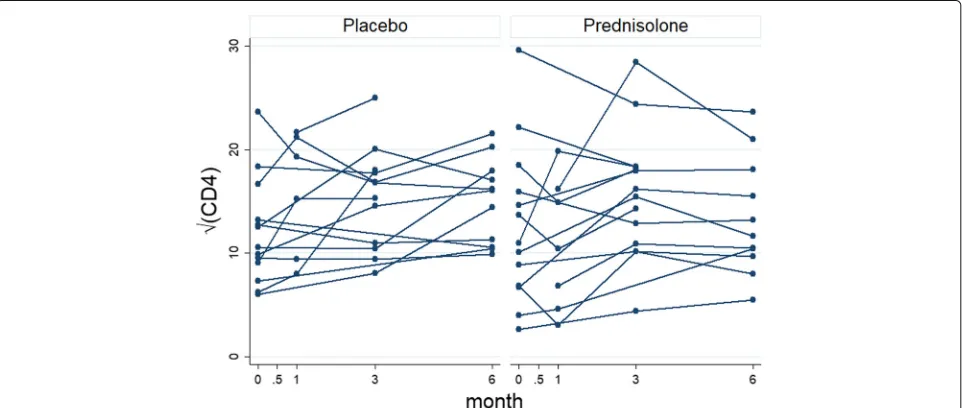
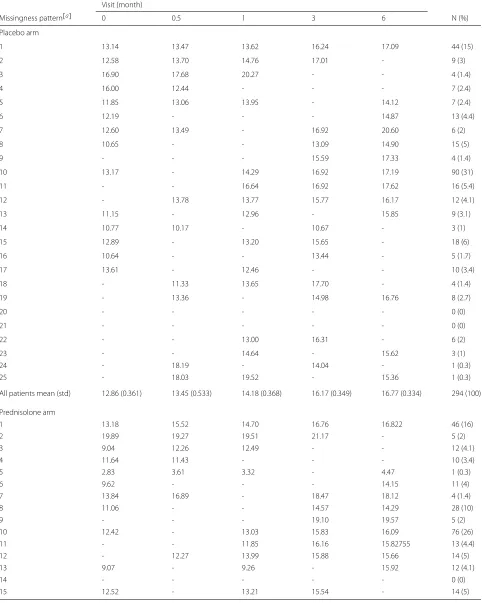
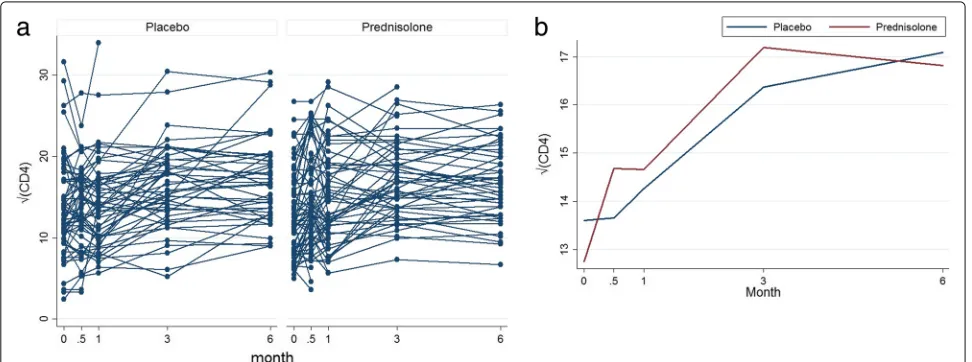
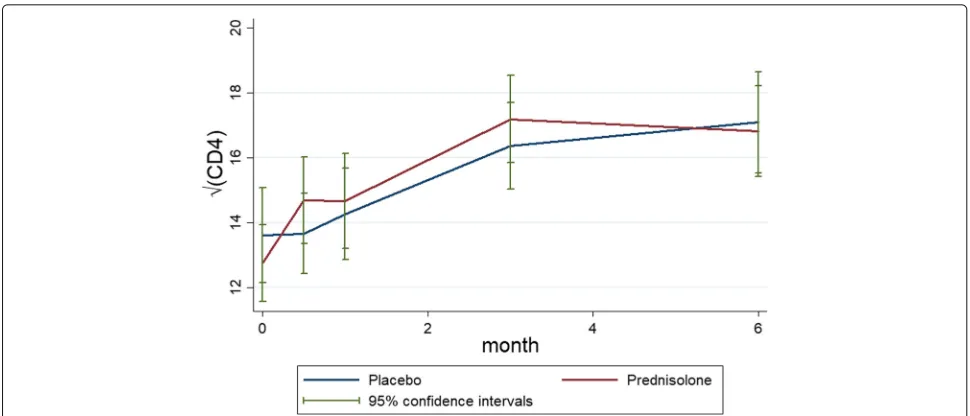
Out of 587 HIV+ patients, 294 patients are in the placebo arm and 293 patients are sin the prednisolone arm. Some of the patients have missing values within the selected scheduled visits. The left panel of Fig. 1 shows profiles plots of the observed √CD4 count measurements for each patient. Some of the patients CD4 count values are missing at either months 0.5, 1, or 3, after the baseline measurements are taken whereas some patients com-pleted the study with their values observed from baseline up to month 6. Because there are too many patients in the left panel of the Fig.1, the figure is not that informa-tive. We have provided observed profiles plots of 29 (5%) patients in Fig.2to make this panel more informative. It can be observed from these plots that some patients com-pleted the study (observed from baseline 0 to the month 6) while others have missing values (incomplete cases). The right panel of the Fig.1 shows the profiles plots of the mean√CD4 count measurements by treatment arms. The mean profile plots showed a slight reduction of CD4 count level among patients in the prednisolone arm com-pared with those in the placebo arm. The Fig.3displays standard error bars around the mean graph. These plots show an overlap between confidence intervals which sug-gests comparable ART benefit to patients in the placebo and the prednisolone arms. There are 25 missingness patterns, presented in Table1. A missingness pattern rep-resents time points for which a group of patients values are missing or observed at all time points. The Table1 shows the mean√CD4 count for each of the missingness patterns at each visit by treatment arm. The proportion of patients with missing values, in the prednisolone arm (84%), is approximately the same to that of the patients in the placebo arm (85%). Table1presents summaries of the
√
Fig. 1Profiles plots of the non-monotone√CD4 count data (left panel) and the mean√CD4 count (right panel), by placebo and prednisolone treatment arms
groups does not differ (chi-squared test statistic = 29.97,p=0.1858).
Monotone data
The monotone CD4 count data consisted of 137 HIV pos-itive patients. 64 were in the placebo arm and 73 in the prednisolone arm.
The left panel of Fig. 4 shows profiles plots of the observed√CD4 count measurements for each HIV posi-tive patient. Some of these patients dropped out at months 0.5, 1, and 3, after the baseline measurements are taken, whereas some patients completed the study with their values observed from baseline up to month 6. The right panel of the Fig.4shows profiles plots of the mean√CD4 count measurements by treatment arms, where it can be observed that there is a slight reduction of CD4 count level for patients in the prednisolone arm compared with
those in the placebo arm. The Fig. 5 displays standard error bars around the mean graph. These plots show an overlap between confidence intervals which suggests comparable ART benefit to patients in the placebo and the prednisolone arms.
Table 2 gives the number and proportion of patients remaining at each visit by treatment arm. There is higher completion rate 44 (69%) in the placebo arm compared with 46 (63%) completion rate in the prednisolone treat-ment arm. There are four deviation patterns. A deviation pattern represents the time point for which a group of patients dropped out of the study. The deviation pat-terns 4, 3, 2 and 1 represent completers (those patients who completed the study without missing values), those who dropped out at months 3, 1 and 0.5 respectively. Table 3 shows the mean √CD4 count for each of the deviation patterns at each visit by treatment arm. The
Fig. 3Mean profiles plots with standard error bars of the non-monotone√CD4 count data by placebo and prednisolone treatment arms
proportion of patients deviating (who do not complete the study) in the prednisolone arm (37%) is higher than the portion deviating in the placebo arm (31%). The distri-butions of the patterns of missingness between the two treatment groups do not differ (chi-squared test statistic= 5.15,p=0.161).
Figure 6 shows the profile plots of the mean √CD4 count of the four deviation patterns for patients in the placebo and prednisolone groups. This figure gives an indication that the √CD4 count increases over time. Figure6agrees with those mean profiles in Figs.1and 4. That is, there is slight increase in the√CD4 count among patients in the placebo arm compare with those in pred-nisolone arm.
Estimands for primary and sensitivity analyses Since the focus of this paper is to draw statisti-cal inferences in the presence of missing data, this section discusses the de jure and de facto estimands [1]. This discussion is necessary because our primary analysis model is based on the de jure estimand, and the sensitivity analysis models are based on the de facto estimand [1]. The primary analysis (as speci-fied in the statistical analysis plan) addresses the main objective of the study, whereas the sensitivity anal-ysis considers models the make alternative assump-tions (trial protocol) that, in one way or the other, may influence statistical inferences under the primary analysis model. We discuss the de jure estimand in “De jure estimand hypothesis” section and then the de factoestimand in “De facto estimand hypothesis” section. We will also discuss deviations associated with each esti-mand in “Deviations associated with estimands” section.
De jure estimand hypothesis
The de jure estimand estimates the effect of treat-ment on patients assuming that patients adhered to the study protocol without deviating from the trial proto-col [1, 14]. The de jure estimand hypothesis is analo-gous to the MAR mechanism. This hypothesis assumes that the conditional distribution of observations later in the up, given observations earlier in the follow-up, is independent of whether deviation occurs. In this case, patients are expected to obtain the full benefit of the treatment and the question of interest is whether the treatment works under the best case scenario. In this study, the de jure primary analysis is based on the multiple imputation under missing at random (MAR) [8,17,20]. The primary analysis method to choose varies from trial to trial. The guidelines on how to decide on an appropriate primary analysis for a given trial can be found in the NRC panel report [3] and many others [14,15].
De facto estimand hypothesis
Table 1Non-monotone data: mean√CD4 count at each visit by treatment arm
Visit (month)
Missingness pattern[a] 0 0.5 1 3 6 N (%)
Placebo arm
1 13.14 13.47 13.62 16.24 17.09 44 (15)
2 12.58 13.70 14.76 17.01 - 9 (3)
3 16.90 17.68 20.27 - - 4 (1.4)
4 16.00 12.44 - - - 7 (2.4)
5 11.85 13.06 13.95 - 14.12 7 (2.4)
6 12.19 - - - 14.87 13 (4.4)
7 12.60 13.49 - 16.92 20.60 6 (2)
8 10.65 - - 13.09 14.90 15 (5)
9 - - - 15.59 17.33 4 (1.4)
10 13.17 - 14.29 16.92 17.19 90 (31)
11 - - 16.64 16.92 17.62 16 (5.4)
12 - 13.78 13.77 15.77 16.17 12 (4.1)
13 11.15 - 12.96 - 15.85 9 (3.1)
14 10.77 10.17 - 10.67 - 3 (1)
15 12.89 - 13.20 15.65 - 18 (6)
16 10.64 - - 13.44 - 5 (1.7)
17 13.61 - 12.46 - - 10 (3.4)
18 - 11.33 13.65 17.70 - 4 (1.4)
19 - 13.36 - 14.98 16.76 8 (2.7)
20 - - - 0 (0)
21 - - - 0 (0)
22 - - 13.00 16.31 - 6 (2)
23 - - 14.64 - 15.62 3 (1)
24 - 18.19 - 14.04 - 1 (0.3)
25 - 18.03 19.52 - 15.36 1 (0.3)
All patients mean (std) 12.86 (0.361) 13.45 (0.533) 14.18 (0.368) 16.17 (0.349) 16.77 (0.334) 294 (100)
Prednisolone arm
1 13.18 15.52 14.70 16.76 16.822 46 (16)
2 19.89 19.27 19.51 21.17 - 5 (2)
3 9.04 12.26 12.49 - - 12 (4.1)
4 11.64 11.43 - - - 10 (3.4)
5 2.83 3.61 3.32 - 4.47 1 (0.3)
6 9.62 - - - 14.15 11 (4)
7 13.84 16.89 - 18.47 18.12 4 (1.4)
8 11.06 - - 14.57 14.29 28 (10)
9 - - - 19.10 19.57 5 (2)
10 12.42 - 13.03 15.83 16.09 76 (26)
11 - - 11.85 16.16 15.82755 13 (4.4)
12 - 12.27 13.99 15.88 15.66 14 (5)
13 9.07 - 9.26 - 15.92 12 (4.1)
14 - - - 0 (0)
Table 1Non-monotone data: mean√CD4 count at each visit by treatment arm (Continued)
Visit (month)
Missingness pattern[a] 0 0.5 1 3 6 N (%)
16 14.12 - - 15.73 - 9 (3.1)
17 8.12 - 10.74 - - 13 (4.4)
18 - 14.35 14.73 16.00 - 2 (0.7)
19 - 17.10 - 20.95 21.59 4 (1.4)
20 - 15.07 13.10 - - 3 (1)
21 - 10.21 - - 10.80 2 (0.7)
22 - - 15.07 16.78 - 3 (1)
23 - - 13.09 - 9.32 3 (1)
24 - 18.19 - 14.04 - 1 (0.3)
25 - 8.35 8.20 - 13.36 2 (0.7)
All patients mean (std) 11.89 (0.333) 106, 14.27 (0.575) 219, 13.12 (0.397) 224, 16.20 (0.344) 221, 15.86 (0.348) 293 (100)
a
Missingness patterns: 1 = CD4 count data at all visits, 2 = CD4 count data at all visits except 6, 3 = CD4 count data at all visits except 6 and 3, 4 = CD4 count data at all visits except 6, 3, and 1, 5 = CD4 count data at all visits except visit 3, 6 = CD4 count data at baseline and visit 6 etc
instance, the fairer comparison might be to move those who deviate from the prednisolone arm onto the placebo arm. In the case of the IMPI trial, since all patients in both prednisolone and placebo arms were given ART, we expect no significant difference in their response to ART treatment unless there is interaction between pred-nisolone and ART treatment.
We discuss four de facto options for obtaining post-deviation data in “Constructing joint distributions of pre-deviation and post-deviation outcome data” section. These options make assumptions about the missing post-deviation data. These assumptions are alternative plausible assumptions, which depart from the MAR
assumption under the primary analysis. In this way, it is assumed that the data are not missing at random (NMAR) and we assess the robustness of inferences under the MAR primary analysis to the alternative assumptions under thede factooptions (sensitivity analyses).
Deviations associated with estimands
It is important to define clearly deviations associated with each estimand in the study protocol. This is because clar-ity of deviations associated with each estimand is vital for primary analysis and framing relevant sensitivity anal-ysis [1]. The exact definition of a deviation will depend on the trial setting and may also vary between separate
Fig. 4Profiles plots of the monotone√CD4 count data (left panel) and the mean√CD4 count (right panel), by placebo and prednisolone
Fig. 5Mean profiles plots with standard error bars of the monotone√CD4 count data by placebo and prednisolone treatment arms
analyses [1]. In the IMPI trial, the following situations can be regarded as deviations associated with the de jureestimand: unblinding of treatment arms and unob-served CD4 count measurements and deviations asso-ciated with the de facto estimand are unblinding such as treatment allocation, loss to follow-up such that no further treatment is taken and influence if trial pred-nisolone treatment on ART.
Given the estimands and their associated deviations, it is assumed that each patient has longitudinal follow-up data until either the patient deviates or reaches the final visit, and that the nature or reason of each devi-ation is known. This approach further assumes that for each deviation or group of similar deviations occurring in a dataset due to similar reasons, an appropriate post-deviation distribution can be built taking into consider-ation (1) the patient’s pre-deviconsider-ations, (2) pre-deviconsider-ations and post-deviations data from other patients in the trial, (3) the nature of the deviation, (4) and the reason for the deviation [1].
Table 2Percentage of patients remaining in the study at each visit
Placebo Prednisolone
Month N (%) N (%)
0 64 (100) 73 (100)
0.5 64 (100) 73 (100)
1 57 (88) 63 (86)
3 53 (83) 51 (70)
6 44 (69) 46 (63)
Standard pattern-mixture model and the
pattern-mixture model with multiple imputation It this section, we give a brief review of the stan-dard pattern-mixture model (PMM) and then discuss the pattern-mixture model with multiple imputation (PM-MI) of Carpenter and colleagues. In “Link between the pattern-mixture model and the pattern-mixture model with multiple imputation” section, we give the link between these approaches.
Standard pattern-mixture model
We have mentioned in the “Background” section that the pattern-mixture modeling framework is a reverse factorization of the selection model [2, 8, 9, 21]. The selection model can be viewed as a multivariate model where one variable represents marginal density of the measurements process and the other variable repre-sents the conditional density of the missingness pro-cess, given the outcomes. The PMM approach, on the other hand, is defined as a model for the product of the conditional distribution of the responses Yi for patient i,i = 1, 2,. . .,N, given non-response patterns Ri and the model for non-response Ri. [10, 22, 23]; that is
Pr(Yi,Ri∣Xi,θθθ,ψψψ) =Pr(Yi∣Xi,Ri,θθθ) ×Pr(Ri∣Xi,ψψψ),
(1)
Table 3Monotone data: mean√CD4 count at each visit by dropout pattern and treatment arm
Dropout time (months)
Dropout pattern[a] 0 0.5 1 3 6 N (%)
Placebo arm
4 13.14 13.47 13.62 16.24 17.09 44 (69)
3 12.58 13.702 14.76 17.01 - 9 (14)
2 16.90 17.68 20.27 - - 4 (6)
1 15.98 12.44 - - - 7 (11)
All patients mean (std) 13.61 (5.84) 13.65 (4.97) 14.26 (5.32) 16.37 (4.85) 17.09 (5.14) 64 (100)
Prednisolone arm
4 13.18 15.52 14.70 16.76 16.82 46 (63)
3 19.89 19.27 19.51 21.17 - 5 (7)
2 9.04 12.26 12.49 - - 12 (16)
1 11.64 11.43 - - - 10 (14)
All patients mean (std) 12.75 (5.10) 14.68 (5.71) 14.66 (5.84) 17.19 (4.80) 16.82 (4.72) 73 (100)
a
Dropout patterns: 4 = subjects who had all measurements up to 6 months (completers), 3 = subjects who had measurements up to 3 months, 2 = subjects who had measurements up to 1 month, and 1 = subjects who had measurements up to 2 weeks
The PMM has desirable properties especially where the data are NMAR (probability that a response will be missing depends on the Ri and Yi). For instance, where it is not substantively reasonable to consider non-responses as missing data, it may be desirable to limit the inferences to the subpopulation of patients whose responses are observed. Thus, it is more meaningful to consider the distribution of Yi given Ri = 1 (Ri = 1 if subject is observed and 0 otherwise) rather than the marginal distribution of Yij [8]. Contrary to the selection model, Pr(Ymi ∣Yio,Xi,Ri)is modeled directly from the pattern-mixture model, whereYoi is a vector of
observed responses and Ymi is a vector of the missing responses.
One important feature of the pattern-mixture model (1) is that it fits a different response model for each pattern of missingness such that the observed data is a mixture of patterns weighted by their respective prob-abilities of missing patterns. That is, the first compo-nent in the PMM (1), Pr(Yi∣Xi,Ri,θθθ) fits a response model for each pattern of missingness and Pr(Ri∣Xi,ψψψ) represents dropout probability for each pattern. It fol-lows that if there areU number of missingness patterns in a data set, then the marginal distribution of Yi is a
Fig. 6Profile plots of the mean of the√CD4 count for each deviation pattern under the placebo arm (left panel) and the active arm (right panel).
mixture of Pr(Yi∣Xi,θθθ) = U ∑
u=1
Pr(Yi∣Ri=Riu,Xi,θθθu)πu,
where πu = Pr(Ri=u∣Xi,ψψψ) andRi counts the num-ber of U patterns, θθθu represents the parameters of marginal density Pr(Yi) in the uth pattern. It can be observed that in the pattern-mixture model,
parame-ters{θθθ1,. . .,θθθU}can have different dimensions. A
logis-tic model is often assumed for dropout probabilities and a linear mixed effect model (LMM) [24] for the measurement process.
The linear mixed effects model (LMM) [24] is assumed for the measurement process and is given by
⎧⎪⎪⎪ ⎪⎪ ⎨⎪⎪ ⎪⎪⎪⎩
Yi=Xiβββ+Zibi+i,
bi∼N(000,Gi(ρρρ)),
i∼N(000,Ri(σσσ)),
bii,
(2)
where bi is an q-dimensional vector of random effects, Zi andXi areN×q andN×q dimensional matrices of known covariates,βββis ap-dimensional vector containing the fixed effects,i is anN-dimensional vector of resid-ual components,Gi(ρρρ)andRi(σσσ)areq×q andni×ni covariance matrices respectively andσσσ andρρρarec×1 and s×1 (withs≤ni(ni+1)/2) vectors of unknown variance parameters corresponding toiandbirespectively.
The pattern-mixture model (1) is well understood using the second MAR assumption. The second MAR assumption states that observations that would have been recorded for a patient in the future, given that the observed history of such patient has the same statistical behavior. This feature of the pattern-mixture model makes it possible for multiple imputation to provide a practical approach to estimation and inferences. In addition, this feature provides a framework for the formulation of the pattern-mixture model with multiple imputation [1].
Pattern-mixture model with multiple imputation methodology
In this section, we describe the pattern-mixture model with multiple imputation (PM-MI) methodology [1]. Con-sider a randomized clinical trial with two treatment arms and predictors of continuous response Yi (Yij)for each patient. Let theYijbe the measurements of theithpatient at thejthoccasion in each treatment armTi, wherej= 0 represents baseline measurements in each treatment arm andj=nidenotes the last observation time prior to a devi-ation for theithpatient. It is then assumed that all patients were observed at baseline. Let (1) Yoi = (Yi0,. . .,Yini)′ denotes a vector of the ith patient’s observed responses at each scheduled visit from j = 0,. . .,ni, (2) Ymi =
(Yini+1,. . .,Yin)′denote a vector of theithpatient’s
miss-ing post-deviation responses at scheduled visits time from
j = ni +1,. . .,n, wheren is the last schedule visit, (3)
Ym = (Ym1′,. . .,YmN′)′denotes a column vector of theith
patient’s missing post-deviation responses profile, and (4)
Yo = (Yo1′,. . .,YoN′)′ denotes a column vector of theith
patient’s observed responses profile. It follows that the dis-tribution of each patient’s post-deviation responses Ymi , given each patient’s pre-deviation responses Yoi and the deviation timeni, is defined by
Pr(Ymi ∣Yoi,ni,Ti,θθθ), (3)
where Ti denotes binary treatment arm (for patient in either the prednisolone or placebo treated arm). The parameter vector θθθ has to be estimated before we can impute missing post-deviation data by drawing from con-ditional distribution (3).
Link between the pattern-mixture model and the pattern-mixture model with multiple imputation
If post-deviation data are assumed to be MAR (that is, the probability that the responses are missing depends on the observed data), the distribution (3) is independent of the deviation timeni. Hence the distribution (3) can be written as
Pr(Ymi ∣Yio,Ti,θθθ). (4)
Under such assumption, the direct maximum likelihood estimation [8,25] or the multiple imputation under MAR can be used to obtain valid inference [8, 17, 26]. How-ever, if data are NMAR, the distribution (3) depends on the deviation the timeni in a manner that could be dif-ferent for each patient. This feature of the distribution (3) is analogous to the standard pattern-mixture model (1), where response model is fitted for each pattern of missingness such that the observed data is a mixture of patterns weighted by their respective probabilities of missingness.
To obtain post-deviation data from the distribution (3), Carpenter and colleagues [1] suggested the following.
Step A: Assume a multivariate normal for the observed
dataYo.
Step B:Draw samples of the parameter estimates ofβββ
andRi from the Bayesian posterior distribution defined as Pr(βββ′,ααα′ ∣Yo), whereβββ is a vector of the means and ααα′ = (σσσ′,ρρρ′) ′is a parameter vector of the variance com-ponents in the measurement model. The Markov chain Monte Carlo (MCMC) method is used to draw samples of βββandαααfrom this posterior.
Step C:Update the Markov chain sufficiently after each
draw in order to avoid correlation between draws in each of the parameter estimatesβββandααα.
Step D: After each draw ofβββ andααα for each patient
who deviates before the end of the trial, βββ and ααα are used to build the joint distribution of such patient’s pre-deviation and post-deviation data. We discuss dif-ferent options for building this joint distribution in “Constructing joint distributions of pre-deviation and post-deviation outcome data” section.
Step E: The joint model in Step D is then
used to build the conditional distribution of each patient’s missing post-deviation data, given the pre-deviation data (3). The missing post-deviation data in the conditional distribution (3) are obtained using the parameter estimates βββ and ααα obtained
fromStep D.
Step F:Repeat StepsB-EKtimes to createK“complete”
data sets. Thereafter, any method of analysis that yields valid inferences in the absence of missing data can then be applied to the complete data sets.
Carpenter and colleagues [1] considered the treatment benefit at the last schedule visit where they fitted a lin-ear regression model that assumed that observations are independent. This paper considers the treatment bene-fit over time and hence the linear mixed effect model [24] is assumed for the measurement process. This model is then fitted to each of the K imputed data sets. This analysis produced K statistics for the parameter esti-matesβββ andααα. Estimates from each of theKcompleted data set were then combined to produce single esti-mates with their associated standard errors using the Rubin’s rule [17].
Constructing joint distributions of pre-deviation and post-deviation outcome data
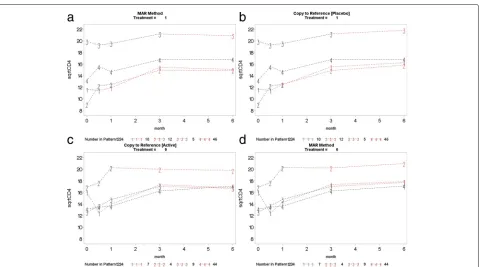
In this section, we discuss the fourde facto options for obtaining the missing post-deviation data [1]. These options make alternative and plausible assumptions about the missing data such that the de facto (NMAR sensitivity analysis) assumptions depart from the de jure (MAR primary) assumption about the missing data. These assumptions assess whether inferences
under such MAR primary analysis assumption are sensitive to the alternative plausible assumptions under NMAR sensitivity analysis. In this way, we will be able to assess whether the process that gener-ated the missing CD4 count data is MAR or NMAR mechanism. This distinction is necessary because the type of missing data mechanism has implications for both the analysis and interpretations of the results [27]. We also discuss how to choose reference arm (“Choosing the reference arm” section) and the implications of thede factooptions under the IMPI trial in “De facto options under the IMPI trial” section.
Carpenter and colleagues proposed the following options for constructing the joint distribution of each patient’s pre- and post-deviation outcome data where each option represents a possiblede jureorde factoassumption concerning post-deviation data. These assumptions differ in the ways in which unavailable information for deviated patient are borrowed, or estimated, from other groups of patients in the same trial [1]. Here two treatment arms, placebo and active (prednisolone in our study), are con-sidered and one of these arms is chosen as a reference arm such that unavailable information for deviated patient can be “borrowed” from such reference arm. The refer-ence arm could be either the placebo or the active arm depending the hypothesis to address. In this study, we in turn used each arm as reference arm just to explore how treatment effect is affected under such considerations. Here, we refer to the arm not chosen as reference as the other arm.
A: Jump to reference (J2R): Under this assumption, after a patient stops taking treatment from the random-ized arm, such patient’s mean response distribution is now considered to be the same us of the “reference” group of patients. Typically, such a patient will take treat-ment from the control or placebo arm. However, such a patient may not necessarily take treatment from the placebo arm (but assumes to take treatment from the randomized arm after dropout) since the choice of the reference arm may depends on trial setting. In a trial where more benefit is expected in the active arm, such a change may be seen as extreme, and choosing the ref-erence group to be the placebo group may be viewed as a worst-case scenario in terms of reducing any treatment benefit, since withdrawn patients on active will lose the effect of their period on treatment. In this study, the post-deviation data in the reference arm are imputed under randomized-arm MAR.
arm, but starting from the benefit already obtained from the active arm.
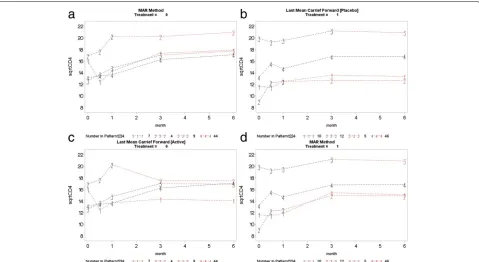
C: Last mean carried forward (LMCF): Under the LMCF, it is assumed that after deviation, the patient’s post-deviation means equal that of the marginal mean of the randomized treatment arm.
D: Copy reference (CR): The “copy reference” de fact option assumes that a patient’s whole distribution, both pre-deviation and post-deviation data, is the same as reference arm.
Whereas the above assumptions for constructing post deviation data have been proven to be practical and per-mit relevant, accessible assumptions for framing primary and sensitivity analyses, the PM-MI approach depends on the relevance of the assumptions about missing post-deviation data in relation to the context of the trial at hand [1]. In this study, we apply the PM-MI approach in the context of the IMPI trial setting (see “Choosing the reference arm” and “De facto options under the IMPI trial” sections).
Choosing the reference arm
For the “jump to reference”, “copy reference” and “copy increment in reference”de factooptions, we discuss the implications for the choice of the reference arm. In the IMPI trial, it could be either the placebo or the pred-nisolone arm. This is because we expect similar statistical behavior for patients in either arm. Suppose that one wishes to address thede factoquestion corresponding to the assumption that after post-deviation (CD4 count mea-surements are unobserved), (1) patients on the placebo arm obtain a treatment equivalent to the active (pred-nisolone) arm, and (2) the prednisolone-treated patients continue on treatment and adhered to the study protocol, so that their post-deviation data can be imputed assum-ing randomized-arm MAR. In such a case, we specify the prednisolone arm as a reference. In the IMPI trial, HIV+ patients in either placebo or prednisolone arm were given ART and thus patients with their CD4 count unobserved are expected to have equivalent treatment benefit com-pared with those patients with their CD4 count observed unless prednisolone treatment influences ART treatment. Since we hypothesized that patients’ response to ART treatment in both the placebo and the prednisolone arms are comparable, we also present results where the placebo arm is used as a “reference”. Thus dropouts in the pred-nisolone arms obtain treatment equivalent to the placebo arm so that their post-deviation data (unobserved CD4 count measurement) can be imputed under randomized-arm MAR. This latter assumption might be appropri-ate where no alternative treatment is generally available or where patients in both arms receive treatment but responses were unobserved (in the case of the IMPI trial IMPI trial).
De facto options under the IMPI trial
A simple interpretation of the PM-MI approach is that within the same trial, the PM-MI approach is used to “bor-row” or estimate unavailable information from a group of patients for another group of patients who have their information missing. As we have stated earlier, in the IMPI trial setting, HIV+ patients in both the active treat-ment (prednisolone) arm and the placebo treattreat-ment arm were given ART, and hence we expect similar benefit of ART treatment unless prednisolone treatment inter-acts with the ART treatment. One research question to address in the IMPI trial is whether the prednisolone treatment interacts with the ART treatment. If they do interact, patients’ response to ART treatment from the active arm and the placebo arm will be different, other-wise they would be comparable. Also in the IMPI trial, missing CD4 count for patients were unobserved due to inadequate resources but not necessarily that the patient dropped out before the end period of the trial. In other words, CD4 count measurements were missing at some scheduled visits mostly due to administrative reason and missingness would have been generated by a random pro-cess. In fact, only 6% of the patients dropped out (genuine dropout) in the IMPI trial. This means that most of the patients do not dropout from the study but their CD4 count values could not be measured due to inadequate resources. Thus, patients who CD4 count are unobserved, are expected to have similar CD4 count levels to those who were observed. Out of a total number of 294 HIV pos-itive patients in the placebo arm, approximately 78% were already on ART at the time of randomization and out of a total number of 293 HIV positive patients in the pred-nisolone arm, approximately 80% were already on ART at baseline.
For the de factoquestion, since we do not expect sig-nificant different in treatment effect between patients with their CD4 count observed and those with their CD4 count unobserved, the jump to reference and the copy reference options are the most plausible options for assessing sensitivity of inferences to MAR assumption.
√
CD4ij=β0+β1×prednisolonei+β2×monthj +β3×prednisolone×monthij+β4×ARTij +β5×prednisolone×ARTij+β6×Agei +bi+ij,
(5)
where √CD4ij is the square root of CD4 count for ith patient at thejthvisit, fori = 1,. . .,N andj = 1,. . .,ni, birepresents the patient-specific random effect, andijis the residual error. It is assumed that bi andij are inde-pendently distributed as bi∼N(0,σb2)andij∼N(0,σ2) respectively.
Application of the PM-MI approach to the IMPI trial CD4 count data
In this section, we applied the PM-MI approach to the incomplete CD4 count data. We implemented the PM-MI approach using STATAmimixpackage developed by Cro of London School of Hygiene and Tropical Medicine (LHTM), UK. This package imputes missing continuous outcomes for a longitudinal trial with protocol deviations under distinct reference groups based assumptions for the unobserved data, following the procedure proposed by Carpenter and colleagues [1].
To address thede jurehypothesis, we performed multi-ple imputation for the unobserved CD4 count under MAR mechanism using theicepackage in STATA [28]. We also impute post-deviation under LMCF, J2R, CDR and CR de factooptions to obtain a complete data sets. The lin-ear mixed effect model (5) was then fitted to each of the completed data sets and parameter estimates combined to produce parameter estimates with their corresponding standard errors using the Rubin’s rule [17,28].
Monotone data
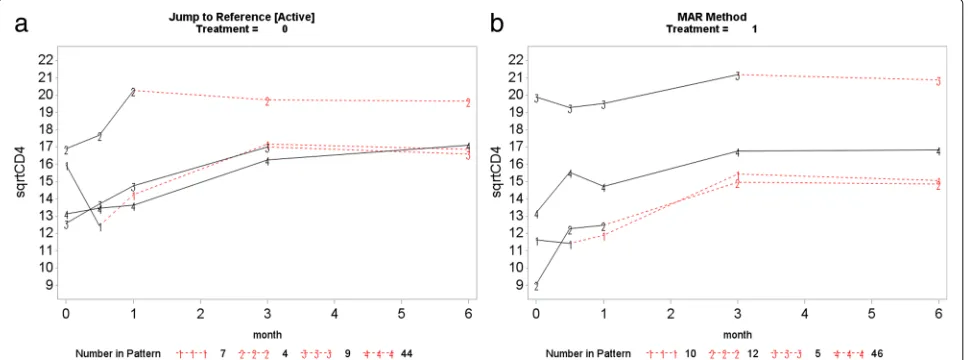
This section presents the PM-MI analyses of the mono-tone CD4 count data. We consider the jump to reference option for illustration purpose and Fig.7shows profiles plots of the mean √CD4 count measurements for the complete data sets, for each deviation pattern, by placebo arm (Treatment = 0) and prednisolone arm (Treatment = 1). The left panel of the Fig.7shows complete data profiles of the placebo reference arm with missing post-deviation values obtained under MAR whereas the right panel of the Fig. 7shows complete data profiles of the prednisolone arm patients with missing post-deviation data “borrowed” from the placebo arm (left panel of the Fig.7). We in turn used the prednisolone arm as a reference where the com-plete data profiles are shown in Fig. 8. The right panel of the Fig.8 shows complete data profiles of the pred-nisolone reference arm with missing post-deviation values obtained under MAR whereas the left panel of the Fig.8
shows complete data profiles of the placebo arm patients with missing post-deviation data obtained from the pred-nisolone arm (right panel of the Fig.8). It can be observed that treatment seems to reduce CD4 count a little, and so imputed data for placebo under MAR are above those when the placebo patient jumps to the prednisolone arm. Hence, we investigate the significance of such reduction in the CD4 count level by using the parameter estimates associated with the prednisolone-ART interaction (see Table 4). Similar plots for LMCF, CDR and CR can be found in Appendix A. After imputation of the missing post-deviation data under LMCF, J2R, CDR and CR, we fit a linear mixed effect model (5) to the completed data sets and combine the parameter estimates from each data set using the Rubin’s rule to produce parameter estimates with their associated standard errors for the final infer-ences. The parameter estimates from these analyses are shown in Table4.
Fig. 7Placebo reference arm (Treatment = 0): Profile plots of the mean√CD4 count against month for the four different deviation patterns. The solid lines join the observed means (before deviation) and the dotted lines join the means of the imputed data for that pattern. Pattern 4: group of patients who completed the study (completers), Pattern 3: group of patients who dropped out after month 3, Pattern 2: group of patients who dropped out after month 1 and Pattern 1: group of patients who dropped out after week 2
same rate (no significant prednisolone effect and pred-nisolone does not influence ART treatment) and CD4 count increases with increasing time where this increase, in both arms, is the same over time (no prednisolone-time effect).
Combined monotone and non-monotone data
This section presents the PM-MI analyses of the com-bined monotone and non-monotone data. Parameter estimates of these analyses are shown in Table 5. The results of these analyses agree with the results under the Table 4. These results also give an indication that the MAR primary analysis (MI), which addresses thede jure
hypothesis, are robust to the difference assumptions by and the NMAR sensitivity analyses under de facto esti-mand hypothesis (LMCF, J2R, CR, and CDR). These anal-yses show that the mechanism that generated the missing data in the CD4 count measurements from the IMPI trial is missing at random (MAR) mechanism. This means that the direct maximum likelihood and multiplication methods under MAR can be used to provide valid infer-ences when assessing the effect of prednisolone and ART treatments on changes in CD4 count level among different treatment groups.
It can be observed from these analyses that there is no significant prednisolone effect and the effect of
Fig. 8Prednisolone reference arm (Treatment = 1): Profile plots of the mean√CD4 count against month for the four different deviation patterns.
prednisolone-ART is also not significant. This implies that prednisolone treatment does not influence ART treatment. We also found a reduction of CD4 count level in the prednisolone arm. However, this reduction is not significant. As expected, patients’ CD4 count lev-els significantly increase with increasing time and patients who are on ART at each schedule visit time have signifi-cantly higher CD4 count levels relative to those who are not on ART treatment at each schedule visit. The near zero estimates of the prednisolone-time interaction effect suggest that there is no difference in prednisolone effect in both arms over time. This means that the effect of treatments in both arms does not differ significantly over time. The results also show that older patients are more likely to have lower CD4 values, hence CD4 count signif-icantly decrease with increasing age. These results agree with the mean√CD4 count profiles plots in Figs.1and4. This is because CD4 count in both the prednisolone and placebo arms increases at the same rate (no significant prednisolone effect and prednisolone does not influence ART treatment) and CD4 count increases with increasing time where this increase, in both arms, is the same over time (no prednisolone-time effect).
Simulation study
In this section we performed simulation experiments to evaluate the performance of the PM-MI approach. We performed a simulation experiment to evaluate the per-formance of thede factohypothesis against the usual MI method for imputation of missing data and likelihood based method (ML). These methods (MI and ML) are known to provide valid inference when missing values are missing at random (MAR) [8,17].
The simulated datasets were generated using the R soft-ware. The R code for the simulation experiment is avail-able from the first author upon request. The simulation experiment was performed according to the linear mixed effect model defined by
Yij=β0+β1×treatmenti+β2×timej +β3×treatment×timeij+bi+ij.
The initial values for β0,β1,β2, and β3 are 13, 0.75,
0.11, -0.19, 0.20 respectively. The initial value for standard deviation σ of the random effect bi is 4.57. In generat-ing these data sets, we assumed that (1) the measurement at the first time point (j= 0) from the original data set is completely observed, (2) the data are MCAR or MAR mechanism, (3) the missing pattern is monotone, and (4) there are different dropout rates. We considered the fol-lowing two steps for generating the data sets. We called these steps, M-step and D-step. We generated the longi-tudinal measurements under the M-step and under the
D-step, we then generated data according to MAR and MCAR mechanisms.
M-step: We generated five-repeated measurements for
each patient by a random number from a multivariate nor-mal distribution. We used parameter estimates obtained from fitting a linear mixed effect model to the data. We repeated these processes 1000 times for 200 patients. Patients were randomly assigned to two treatment (treat-ment and placebo) arms in a ratio 1:1.
D-step: We generated missing data according to MCAR
and MAR mechanisms. Missing data were generated through a logistic regression model. However, generat-ing MCAR and MAR missgenerat-ing mechanisms involves two different assumptions for the dropout mechanism. For MAR, missing data were generated by dropping obser-vations according to a logistic regression model relat-ing the probability of dropout at particular time point with changes from baseline to previous time point. For MCAR, missing data were randomly generated by drop-ping observations according to a logistic regression model. Specific values for the logistic regression were chosen in order to yield the desire dropout rates in a given missing data mechanism. Under each of the missing data mech-anisms, we generate overall dropout rates at 5%, 20%, 30, and then 50%. Thereafter, we perform analyses using ML, MI, LMCF, J2R, CDR and CR approaches and then assess the performance of these methods in estimating treatment effect.
20%. However, ML and MI, yielded unbiased estimates for treatment-time interaction. These results suggested that the fourde factoassumptions proposed by Carpen-ter and colleagues [1] are suitable for handling the missing data in the IMPI clinical trial and other trials with similar settings.
Discussion and conclusion
In this paper, we investigated the effect of TB pericardi-tis treatment (prednisolone) on CD4 count changes over time. We also conducted sensitivity analysis to investigate sensitivity of statistical inferences under MAR analysis (de jure option) to alternative plausible assumptions under NMAR (de factooption) using the PM-MI approach [1]. These principles and methods quantify the robustness of inferences to departures from the primary analysis assumptions. We recognized that this case study cannot cover the broad range of types and designs of clinical trials. This is because the literature on sensitivity anal-ysis is evolving. The primary objective of this paper is to assert the importance of conducting some form of sensitivity analysis and to illustrate principles in the IMPI trial setting.
The study results show that inferences under the de jure (MAR primary analysis) assumption are robust to the inferences under the de facto (NMAR sensitivity analysis) assumptions. This finding gives an indication that the mechanism that generated the missing values in the CD4 count measurements from the IMPI trial is likely to be missing at random (MAR). The implica-tions are that (1) the observed data are random sample from the population patients with TB pericarditis and (2) either the direct maximum likelihood (ML) approach or the multiple imputation approach, under the assumption that the data are MAR, can be used to produce valid inferences.
The investigation of sensitivity of statistical inferences to missing data is important and use of such methods must be encouraged. This is because, such sensitivity anal-ysis provides additional information to readers of a clinical report to be able to interpret the results. This means that clinical reports should describe the primary and the sensitivity analyses to non-statisticians. This requires that assumptions about missing data are articulated in a transparent manner so that researchers and practic-ing clinicians can assess their validity under the study at hand [1]. Carpenter and colleagues [1] encourage the need for such sensitivity analysis stating that “assump-tions need to be assessable, so that in the context of the trial at hand all stakeholders can understand whether they are plausible. Then, departures from these assump-tions also need to be relevant in the context of the trial at hand, so that stakeholders can see if they require investigation.” When data are missing, it is possible that
readers of a clinical report may doubt its conclusions unless the conclusions are supported with sensitivity analysis.
Our study results from both the combined monotone, and the non-monotone and monotone showed that there is no significant prednisolone effect in all the analyses. The prednisolone-time interaction results show a very slight reduction in CD4 count level among the patients in the prednisolone arm compared with placebo arm over time. However, this reduction is not significant. As expected, there is a significant time effect indicating that CD4 count level increases with increasing time. Patients who are on ART treatment, at each scheduled visit, are likely to have significantly higher CD4 count levels com-pared with those who are not always on ART at each visit time. The results also show that older patients are more likely to have a lower CD4 count level. Also, there is no prednisolone-ART interaction effect in all the analyses. However, the prednisolone effects under the combined monotone and non-monotone analyses are negatives because the overall reduction in the CD4 count lev-els among patients in the prednisolone arm is more pronounced than that of the patients in the placebo arm (see Fig. 1). On the contrary, the treatment effects under the non-monotone analyses are positives because the overall reduction in the CD4 count lev-els among patients in the prednisolone arm is less pronounced than that of the patients in the placebo arm (see Fig.4).
The IMPI trial was a cardiology trial and HIV-related data were collected. However, the HIV data were not col-lected as would have be in a HIV focused clinical trial, and hence there are missing CD4 count. Despite the fact that the IMPI trial is a cardiology trial, our analyses of the HIV data provide reasonable information regarding the effect of prednisolone on CD4 count changes over time.
In the IMPI trial prednisolone effect was not significant, and hence patients CD4 count levels in the treatments arms are comparable. If the prednisolone effect was signif-icant, CD4 count levels for patients in the treatment arms would have been different.
The missingness of CD4 values might be informative, and hence later values of CD4 count might be missing because patients died. This would require joint modeling on the CD4 count and time to death.
Appendix A
This section presents the complete profile plots ofCDR, CR, andLMCFde factohypotheses.
Appendix B
Fig. 9Copy increment from reference (CDR): placebo arm (top left panel) used as reference to impute data for the active arm (top right panel). Active arm (bottom right panel) used as reference to impute data for the placebo arm (bottom left panel)
Fig. 10Copy to reference (CR): placebo arm (top left panel) used as reference to impute data for the active arm (top right panel). Active arm
Table 6MCAR mechanism by missingness rate
Missingness rates Treatment Time Treatment x Time Coverage probability
5% Analysis Bias RMSE Bias RMSE Bias RMSE Treatment Time Treatment x Time
ML -0.063 0.127 -0.005 0.015 0.028 0.033 94.10% 96.40% 93.50%
MI -0.0602 0.127 0.001 0.020 0.021 0.031 95.50% 94.10% 95.80%
LMCF -0.079 0.137 -0.049 0.051 0.032 0.039 93.50% 95.00% 95.60%
J2R (P-) -0.100 0.149 -0.006 0.016 0.050 0.054 92.70% 95.40% 94.30%
CDR (P-) -0.090 0.141 -0.006 0.016 0.040 0.046 93.10% 95.30% 94.20%
CR (P-) -0.095 0.146 -0.006 0.016 0.045 0.050 92.20% 95.30% 94.80%
10%
ML 0.112 0.157 -0.017 0,022 0.028 0.035 89.50% 94.50% 95.00%
MI 0.112 0.158 -0.018 0.024 0.030 0.040 90.50% 95.50% 95.00%
LMCF 0.095 0.150 -0.103 0.104 0.040 0.046 92.50% 87.50% 95.50%
J2R (P-) 0.072 0.133 -0.015 0.020 0.054 0.058 94.5% 87.50% 94.50%
CDR (P-) 0.088 0.143 -0.015 0.020 0.046 0.051 92.50% 86.50% 96.00%
CR (P-) 0.078 0.136 -0.015 0.020 0.052 0.057 93.50% 88.50% 95.50%
20%
ML -0.032 0.12 -0.0024 0.017 0.024 0.034 95.00% 94.50% 95.00%
MI -0.042 0.124 -0.005 0.022 0.033 0.045 94.50% 95.50% 95.00%
LMCF -0.099 0.154 -0.183 0.183 0.078 0.083 93.50% 90.50% % 94.50%
J2R (P-) -0.122 0.164 0.0002 0.016 0.092 0.100 89.50% 95.00% 94.50%
CDR (P-) -0.074 0.134 0.0002 0.016 0.057 0.063 95.50% 95.00% 93.50%
CR (P-) -0.099 0.149 0.0002 0.016 0.073 0.075 94.50% 95.00% 94.50%
30%
ML -0.092 0.149 -0.052 0.055 0.043 0.051 94.30% 94.50% 95.10%
MI -0.050 136 -0.030 0.039 0.005 0.037 94.40% 95.20% 95.80%
LMCF -0.136 0.184 -0.279 0.280 0.081 0.086 89.10% 85.70% 90.20%
J2R (P-) -0.220 0.252 -0.059 0.062 0.138 0.141 85.20% 94.50% 87.40%
CDR (P-) -0.160 0.200 -0.059 0.062 0.094 0.098 90.50% 94.10% 95.30%
CR (P-) -0.197 0.216 -0.059 0.062 0.109 0.112 90.90% 93.20% 92.70%
50%
ML 0.036 0.123 0.0004 0.022 0.009 0.033 96.60% 95.30% 95.40%
MI 0.039 0.136 -0.006 0.031 0.026 0.051 95.30% 95.10% 94.60%
LMCF -0.045 0.129 -0.360 0.360 0.084 0.088 94.30% 89.10% 95.40%
J2R (P-) -0.112 0.159 0.0004 0.023 0.127 0.130 89.50% 95.10% 90.60%
CDR (P-) -0.045 0.121 0.0004 0.023 0.088 0.089 94.70% 95.20% 93.40%
Table 7MAR mechanism by missing rate
Missingness rates Treatment Time Treatment x Time Coverage probability
5% Analysis Bias RMSE Bias RMSE Bias RMSE Treatment Time Treatment x Time
ML -0.153 0.189 -0.0112 0.018 0.009 0.022 87.50% 95.30% 95.10%
MI -0.155 0.191 -0.008 0.017 0.004 0.022 86.90% 95.50% 94.50%
LMCF -0.155 0.190 -0.033 0.036 0.011 0.023 85.90% 95.10% 95.30%
J2R (P-) -0.172 0.205 -0.012 0.019 0.023 0.031 82.50% 94.90% 95.20%
CDR (P-) -0.160 0.195 -0.012 0.019 0.015 0.025 87.30% 95.10% 94.50%
CR (P-) -0.165 0.199 -0.012 0.018 0.019 0. 027 83.70% 94.30% 95.50%
10%
ML 0.062 0.125 0.003 0.015 0.011 0.024 94.50% 95.10% 94.20%
MI 0.059 0.125 -0.007 0.017 0.016 0.030 94.20% 95.10% 94.30%
LMCF 0.031 0.11 -0.087 0.088 0.034 0.040 95.10% 93.30% 95.20%
J2R (P-) 0.013 0.110 -0.004 0.016 0.044 0.050 94.50% 95.20% 96.60%
CDR (P-) 0.036 0.115 -0.004 0.016 0.032 0.040 95.69% 95.90% 95.20%
CR (P-) 0.022 0.111 -0.004 0.016 0.040 0. 045 95.30% 95.10% 95.60%
20%
ML -0.043 0.012 -0.0061 0.018 0.009 0.025 94.10% 94.50% 95.30%
MI -0.036 0.125 -0.013 0.026 0.013 0.033 95.00% 94.50% 95.30%
LMCF -0.127 0.175 -0.180 0.180 0.066 0.070 87.90% 84.40% 94.50%
J2R (P-) -0.131 0.177 -0.002 0.017 0.078 0.083 86.80% 95.30% 95.10%
CDR (P-) -0.102 0.155 -0.002 0.017 0.054 0.059 85.30% 96.10% 95.50%
CR (P-) -0.115 0.163 -0.002 0.017 0.063 0. 067 89.60% 95.10% 95.40%
30%
ML 0.062 0.125 0.003 0.015 0.011 0.024 94.50% 95.40% 96.30%
MI 0.059 0.125 -0.007 0.017 0.016 0.030 95.10% 94.50% 96.20%
LMCF 0.031 0.11 -0.087 0.088 0.034 0.040 94.30% 95.50% 94.70%
J2R (P-) 0.013 0.110 -0.004 0.016 0.044 0.050 94.50% 96.10% 95.90%
CDR (P-) 0.036 0.115 -0.004 0.016 0.032 0.040 95.10% 94.30% 95.50%
CR (P-) 0.022 0.111 -0.004 0.016 0.040 0.045 94.50% 95.60% 96.20%
50%
ML 0.153 0.193 0.055 0.059 -0.071 0.077 87.80% 94.50% 96.10%
MI 0.144 0.195 0.050 0.059 -0.063 0.077 86.30% 95.40% 96.10%
LMCF 0.066 0.143 0.374 0.374 0.090 0.094 93.10% 67.80% 92.50%
J2R (P-) 0.142 0.185 0.054 0.060 0.122 0.125 87.70% 96.10% 89.50%
CDR (P-) -0.039 0.124 0.054 0.060 0.056 0.061 95.50% 94.80% 96.40%
Abbreviations
ART: Anti-retroviral therapy; CDR (P+): Copy difference in reference active arm; CDR (P-): Copy difference in reference placebo arm; CR (P+): Copy reference active arm; CR (P-): Copy reference placebo arm; J2R (P+): Jump to reference active arm; J2R (P-): Jump to reference placebo arm; LMCF: Last mean carried forward; MAR: Missing at random; MCAR: Missing completely at random; MI: Multiple imputation under MAR; NMAR: Not missing at random; PM-MI: Pattern-mixture model with multiple imputation
Acknowledgments
AI would like to thank South African Center for Epidemiological Modeling and Analysis (SACEMA) for funding the project. The authors would also like to thank The Academy of Medical Sciences and the National Research Foundation for partially funding this research. We thank the Mayosi Research Group, Department of Medicine, University of Cape Town for providing the data for the study. The authors would like to thank the following for their invaluable comments: Prof James Carpenter of London School Hygiene and Tropical Medicine, UK and Prof Jane Hutton, University of Warwick, Department of Statistics, UK. The authors would also like to thank Suzie Cro of London School of Hygiene and Tropical Medicine, UK, for making software available as well as offering valuable suggestions for software’s implementation.
Availability of data and materials
We do not have permission to distribute the data.
Authors’ contributions
AI carried out the literature review, statistical analyses, and wrote the manuscript. FG also contributed to the writing and the reviewing of the manuscript and also provided consultation regarding analysis and
interpretation of findings. Both authors read and approved the final version of the manuscript.
Ethics approval and consent to participate
Not applicable.
Consent for publication
Not applicable.
Competing interests
The author declares that he has no competing interests.
Publisher’s Note
Springer Nature remains neutral with regard to jurisdictional claims in published maps and institutional affiliations.
Received: 3 June 2018 Accepted: 6 December 2018
References
1. Carpenter JR, Roger JH, Kenward MG. Analysis of longitudinal trials with protocol deviation: A framework for relevant, accessible assumptions, and inference via multiple imputation. Biopharm Stat. 2013;23(6):1352–71. 2. Little R, Yau L. Intent-to-treat analysis for longitudinal studies with
drop-outs. Biometrics. 1996;52(4):1324–33.
3. Council NR. The Prevention and Treatment of Missing Data in Clinical Trials, Panel on Handling Missing Data in Clinical Trials, Committee on National Statistics, Division of Behavioral and Social Sciences and Education. 2010.
4. Committee for medicinal products for human use (chmp) guideline on the choice of the non-inferiority margin. Stat Med. 2006;25(10):1628. 5. Little RJ, D’agostino R, Cohen ML, Dickersin K, Emerson SS, Farrar JT,
Frangakis C, Hogan JW, Molenberghs G, Murphy SA, et al. The prevention and treatment of missing data in clinical trials. N Engl J Med. 2012;367(14):1355–60.
6. O’neill R, Temple R. The prevention and treatment of missing data in clinical trials: an fda perspective on the importance of dealing with it. Clin Pharmacol Ther. 2012;91(3):550–4.
7. European Medicines Agency. Committee for Medicinal Products for Human Use (CHMP). Guideline on Missing Data in Confirmatory Clinical Trials. EMA/CPMP/EWP/1776/99 Rev.1.http://www.ema.europa.edu/
docs/en_GB/document_library/Scientific_guideline/2010/09/ WC500096793.pdf.PublishedJuly2,2010.
8. Rubin DB. Inference and missing data. Biometrika. 1976;63(3):581–92. 9. Diggle P, Kenward MG. Informative drop-out in longitudinal data
analysis. Appl Stat. 1994;43(1):49–93.
10. Wu MC, Carroll RJ. Estimation and comparison of changes in the presence of informative right censoring by modeling the censoring process. Biometrics. 1988;44(1):175–88.
11. Creemers A, Hens N, Aerts M, Molenberghs G, Verbeke G, Kenward MG. Generalized shared-parameter models and missingness at random. Stat Model. 2011;11(4):279–310.
12. Yuan Y, Little RJ. Mixed-effect hybrid models for longitudinal data with nonignorable dropout. Biometrics. 2009;65(2):478–86.
13. Ratitch B, O’Kelly M, Tosiello R. Missing data in clinical trials: from clinical assumptions to statistical analysis using pattern mixture models. Pharm Stat. 2013;12(6):337–47.
14. Mallinckrodt C, Roger J, Chuang-Stein C, Molenberghs G, O’Kelly M, Ratitch B, Janssens M, Bunouf P. Recent developments in the prevention and treatment of missing data. Therapeutic Innovation ands Regulatory Science. 2013.
15. Permutt T. Sensitivity analysis for missing data in regulatory submissions. Stat Med. 2016;35(17):2876–9.
16. Little RJ, Rubin DB. Statistical analysis with missing data. Wiley. 2014. 17. Rubin DB. Multiple imputation after 18+ years. J Am Stat Assoc.
1996;91(434):473–89.
18. Mayosi BM, Ntsekhe M, Bosch J, Pogue J, Gumedze F, Badri M, Jung H, Pandie S, Smieja M, Thabane L, et al. Rationale and design of the investigation of the management of pericarditis (impi) trial: A 2×2 factorial randomized double-blind multicenter trial of adjunctive prednisolone and mycobacterium w immunotherapy in tuberculous pericarditis. Heart J. 2012;165:109–15.
19. Mayosi BM, Ntsekhe M, Bosch J, Pandie S, Jung H, Gumedze F, Pogue J, Thabane L, Smieja M, Francis V, et al. Prednisolone and mycobacterium indicus pranii in tuberculous pericarditis. N Engl J Med. 2014.
20. Rubin DB. The calculation of posterior distributions by data augmentation: Comment: A noniterative sampling/importance resampling alternative to the data augmentation algorithm for creating a few imputations when fractions of missing information are modest: The sir algorithm. J Am Stat Assoc. 1987;82(398):543–6.
21. Heckman JJ. The common structure of statistical models of truncation, sample selection and limited dependent variables and a simple estimator for such models. Natl Bur Econ Res. 1976;5(4):475–92.
22. Wu MC, Bailey K. Analysing changes in the presence of informative right censoring caused by death and withdrawal. Stat Med. 1988;7(1-2):337–46. 23. Wu MC, Bailey KR. Estimation and comparison of changes in the
presence of informative right censoring: conditional linear model. Biometrics. 1989;45(3):939–55.
24. Laird NM, Ware JH. Random-effects models for longitudinal data. Biometrics. 1982;38(4):963–74.
25. Dempster AP, Laird NM, Rubin DB. Maximum likelihood from incomplete data via the em algorithm. J R Stat Soc Ser B. 1977;39(1):1–38.
26. Rubin DB. Formalizing subjective notions about the effect of
nonrespondents in sample surveys. J Am Stat Assoc. 1977;72(359):538–43. 27. Molenberghs G, Beunckens C, Sotto C, Kenward MG. Every missingness
not at random model has a missingness at random counterpart with equal fit. J R Stat Soc Ser B. 2008;70(2):371–88.