RESEARCH
Using hyperspectral analysis as a potential
high throughput phenotyping tool in GWAS
for protein content of rice quality
Dawei Sun
1,2, Haiyan Cen
1,2,3*, Haiyong Weng
1,2, Liang Wan
1,2, Alwaseela Abdalla
1,2, Ahmed Islam El‑Manawy
1,2,
Yueming Zhu
1,2, Nan Zhao
1, Haowei Fu
4, Juan Tang
6, Xiaolong Li
6, Hongkun Zheng
6, Qingyao Shu
5, Fei Liu
1,2and Yong He
1,2,3Abstract
Background: The advances of hyperspectral technology provide a new analytic means to decrease the gap of phenomics and genomics caused by the fast development of plant genomics with the next generation sequencing technology. Through hyperspectral technology, it is possible to phenotype the biochemical attributes of rice seeds and use the data for GWAS.
Results: The results of correlation analysis indicated that Normalized Difference Spectral Index (NDSI) had high corre‑ lation with protein content (PC) with R2
NDSI= 0.68. Based on GWAS analysis using all the traits, NDSI was able to identify the same SNP loci as rice protein content that was measured by traditional methods. In total, hyperspectral trait NDSI identified all the 43 genes that were identified by biochemical trait PC. NDSI identified 1 extra SNP marker on chromo‑ some 1, which annotated extra 22 genes that were not identified by PC. Kegg annotation results showed that traits NDSI annotated 3 pathways that are exactly the same as PC. The cysteine and methionine metabolic pathway identi‑ fied by both NDSI and PC was reported important for biosynthesis and metabolism of some of amino acids/protein in rice seeds.
Conclusion: This study combined hyperspectral technology and GWAS analysis to dissect PC of rice seeds, which was high throughput and proven to be able to apply to GWAS as a new phenotyping tool. It provided a new means to phenotype one of the important biochemical traits for the determination of rice quality that could be used for genetic studies.
Keywords: Genome‑wide association study (GWAS), Spectrology, Protein content, Phenotyping, Rice (Oryza sativa)
© The Author(s) 2019. This article is distributed under the terms of the Creative Commons Attribution 4.0 International License (http://creat iveco mmons .org/licen ses/by/4.0/), which permits unrestricted use, distribution, and reproduction in any medium, provided you give appropriate credit to the original author(s) and the source, provide a link to the Creative Commons license, and indicate if changes were made. The Creative Commons Public Domain Dedication waiver (http://creat iveco mmons .org/ publi cdoma in/zero/1.0/) applies to the data made available in this article, unless otherwise stated.
Background
Cultivated rice (Oryza sativa L.) is one of the major staple food in the world feeding over half of the world’s popu-lation [1]. It is becoming more challenging for crop sci-ence to feed the world’s fast growing population, which is expected to be over 9 billion by 2050, under the con-dition of less land, water and more fluctuating climate conditions [2, 3]. Enhancing major crop quality through
breeding programs, such as breeding elite varieties with increased yield, improved nutrition and strengthened resistance, is critical for a sufficient, reliable and sustain-able world food supply [4, 5]. Therefore, to identify and characterize genes related to these important traits is important for understanding the genetic basis that causes the different phenotypes and breeding modern rice culti-vars with higher yield, stress/disease resistance and rice qualities.
The advance of next generation sequencing (NGS) technologies has greatly improved the speed and accu-racy of resequencing a large number of genomes, which facilitated the study of rice functional genomics and
Open Access
*Correspondence: [email protected]
1 College of Biosystems Engineering and Food Science, Zhejiang
molecular breeding [6, 7]. In addition, Genome-wide association study (GWAS) is becoming a powerful tool to bridge genotyping and phenotyping, since it rapidly identifies genes associated with phenotypic traits based on SNP markers, which has been applied extensively to dissect rice phenotypic traits [8, 9]. However, there is still a huge gap between phenotyping and genotyping, because the development of phenotyping is much slower compared to genotyping. There are mainly three reasons: Firstly, acquiring traditional agronomic traits is time-con-suming and labor-intensive [10]. Secondly, these traits are biased due to a lack of international standards for the phenotypic trait measurement [11]. Thirdly, it is challeng-ing to obtain high-quality phenotypic data, select suitable population size and study the extent of linkage disequi-librium (LD), as long as low structured populations are provided [12, 13]. Rice has different phenotypic traits, such as physical and bio-chemical characteristics, growth performances and biotic/abiotic stress tolerance [13–15]. Many agronomic traits have been applied to investi-gate rice phenotypes, including physical characteristics such as size, color, shape and texture, or the biochemi-cal attributes such as protein, starch, gel consistency, and aroma [16]. Traditionally, phenotyping methods for rice varieties, like High Performance Liquid Chromatogra-phy (HPLC), Gas ChromatograChromatogra-phy–Mass Spectrometer (GC–MS), and other biochemical processes provided by the national rice identification facilities are expensive, time consuming and labor intensive [17–19]. As a con-sequence, these methods can only be applied to a small number of samples unless a great amount of labor, time and funding is invested, which has limited the develop-ment of the phenotyping process. Therefore, developing a rapid method for high throughput phenotyping is neces-sary for both phenomics and genomics. Compared with traditional methods of acquiring phenotypic traits, high throughput non-destructive phenotyping is of higher effi-ciency, accuracy and more standardized. In addition, it is more cost-effective compared with traditional means of acquiring agronomic traits in the long run.
Hyperspectral technology has been greatly applied in plant phenotyping including biochemical attributes such as estimating the canopy water content [20], assessing rice leaf growth [21], determining the rice panicle con-dition [22] and detecting the severity of damage caused by insects and bacteria [23–25]. It was also applied for evaluating physical characteristics of plants such as the firmness, elasticity, touch resistance of grapes [26]. Feng et al. used a High-throughput hyperspectral imaging sys-tem (HHIS) to acquire hyperspectral data for the evalua-tion of the growth of plants [14]. However, hyperspectral imaging system are usually heavy, large in size, compli-cated to operate and the data acquired was redundant.
Furthermore, the indices they obtained were agronomical traits, including Dry weight, Green leaf area and Chloro-phyll content, instead of biochemical attributes of rice quality. The ASD FieldSpec4 Hi-Res spectroradiometer is faster and has wider spectrum range (350–2500 nm), which has been commonly used for soil mineral condi-tions [27], discriminating different plant species [28], rice crop phenology [29] and biochemical content quantifica-tion [30] etc.
Biochemical contents are one essential rice seed parameter that is used for grading rice quality, and it was time-consuming, labor intensive and expensive to meas-ure, so in order to achieve high throughput phenotyping for genetic studies on rice seed quality, such as molecu-lar breeding programs and functional genome study, we attempted to investigate the possibility of using hyper-spectral traits extracted from an ASD FieldSpec4 Hi-Res spectroradiometer for GWAS analysis to identify SNP markers and genes that are related to the represented biochemical traits in this research. To our knowledge, there are no published studies that have applied hyper-spectral indices of any biochemical contents related to rice quality in GWAS.
In our study, we attempt to extract hyperspectral indi-ces representing biochemical contents that could be used for GWAS analysis, which had never been reported in any published research. The objects of this study were (1) to select hyperspectral indices that could represent the according biochemical trait, (2) using the selected hyperspectral variables as substitutions of biochemi-cal measurements of rice to achieve high-throughput phenotyping for genetic studies and verify the results of GWAS on the extracted hyperspectral indices by com-paring the identified SNP markers, Genes and pathways with those of biochemical traits. Eventually through this study, we hope to introduce a possible high throughput plant phenotyping method of biochemical contents that could be used in genetic studies based on hyperspectral technology.
Methods Plant materials
paper sample bags and sent to Key Laboratory of Spec-troscopy Sensing (KLSS) at Zhejiang University. All rice seed varieties were listed in Additional file 1: Table S1.
Biochemical components measurement
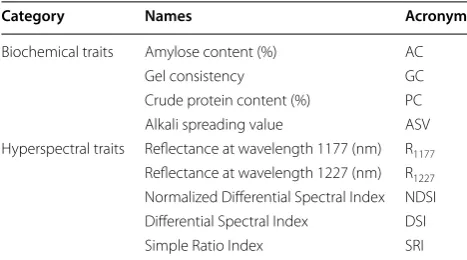
Air-dried rice seeds were sent to China National Rice Research Institute (CNRRI), Zhejiang province, China, to measure 4 biochemical components that were impor-tant for rice quality determination basted on national rice standards NY/T593, including Crude Protein Con-tent (PC), Amylose ConCon-tent (AC), Gel consistency (GC) and Alkali Spreading Value (ASV) (Table 1). The detailed description of the analytical workflow chart for this study was summarized in Fig. 1. In order to verify the valida-tion of the dataset during statistical analysis, the follow-ing criterion was applied: if the data was not normally distributed, the dataset was not accepted. The biochemi-cal components that didn’t meet the aforementioned criterion will not be used for further correlation analy-sis. Eventually, the traits with an acceptable coefficient covariant and normalized distribution were subjected to hyperspectral trait extraction and Pearson correlation analysis for GWAS analysis.
Table 1 Summary of trait categories
Category Names Acronym
Biochemical traits Amylose content (%) AC
Gel consistency GC
Crude protein content (%) PC
Alkali spreading value ASV
Hyperspectral traits Reflectance at wavelength 1177 (nm) R1177
Reflectance at wavelength 1227 (nm) R1227 Normalized Differential Spectral Index NDSI Differential Spectral Index DSI
Simple Ratio Index SRI
Hyperspectral data acquisition
An ASD FieldSpec4 Hi-Res Spectroradiometer (Serial number 18577, Analytical Spectral Devices, Inc., Boul-der, Colorado, USA) with a range of 350–2500 nm was used to acquire hyperspectral data. The spectral resolu-tion is 3 nm @ 700 nm, 8 nm @ 1400/2100 nm with sam-pling intervals (bandwidths) of 1.4 nm @ 350–1000 nm 1.1 nm @ 1001–2500 nm. Rice grains were put in a petri dish (diameter: 8 cm). The sensor of spectroradiometer was fixed vertically down to the opposite to the center of the sample by a detachable rack system and the height between the spectroradiometer sensor and rice sample in petri dish was 20.7 cm. The light source was a 50 W halo-genate lamp, which was 27.4 cm in height and 60 degree from the sample surface. The details of the hyperspectral data acquisition system and the spectral data acquisi-tion process are shown in Addiacquisi-tional file 2: Fig. S1. For each rice variety, rice seeds of 5 plants were collected and pooled together. Around 3 grams of rice seeds were used to collected hyperspectral data. Each sample was manu-ally loaded to acquire spectral data by spectroradiometer. The reflectance of all rice seeds from each sample that were within the vision field of spectroradiometer was acquired during each reading. For each sample, the tral acquisition process was repeated 3 times by the spec-troradiometer automatically, before they were averaged to represent the sample’s mean spectral reflectance. The data was analyzed on the Matlab software 2014a platform (Matlab works, USA).
Hyperspectral data process and analysis
The hyperspectral data process followed published pro-tocols with minor changes [31–33]. The acquired hyper-spectral data was calibrated by the following equation:
Here, Ical, Iraw, Iwhite and Idark represented calibrated reflectance intensity, original intensity, white reference intensity and dark current, respectively. Idark was col-lected by the spectroradiometer automatically; Iwhite was measured using a white Teflon tile with reflectance close to 100%. Data before 400 nm and after 2450 nm was removed due to the low signal-to-noise ratio before they were used for further analysis.
After calibration, the data were applied for the follow-ing analysis. The average spectrum of all samples was extracted. Three indices including Simple Ratio Index (SRI), Normalized Difference Spectral Index (NDSI) and Differential Spectral Index (DSI) were induced for the correlation analysis and as a means to select the optimal wavelength combination for biochemical components.
(1) Ical=
Iraw−Idark
Iwhite−Idark
These three indices were used because a number of research had reported normalized difference vegetation index derived indices could be used to estimate biochem-ical components such as protein content of rice based on the hyperspectral data from rice canopy [34–37]. The for-mulas are listed below:
Here, Ra and Rb stand for reflectance of two different wavelengths in each formula, respectively. The optimal wave lengths were selected by the following procedure. Reflectance of two random wavelengths was used in the aforementioned formulas to calculate the value of SRI, NDSI and DSI respectively, until all the wavelength com-binations were applied. The resulting SRI, NDSI and DSI were then subjected to Pearson correlation analysis. The index of the best performance (the highest the determi-nation coefficient) was selected as the hyperspectral trait for the according biochemical component.
Sampling, re‑sequencing and sequencing data process
One fresh leaf from each rice variety was collected for next generation sequencing. Leaf samples were wrapped in aluminum foil and put in liquid nitrogen for 2 h, prior to being stored at − 80 °C overnight before re-sequenc-ing. Sample Re-sequencing was performed on the Illu-mina HiSeq X Ten platform (IlluIllu-mina, Inc., San Diego, CA, USA). Raw sequencing data was first processed with software Illumina Casava 1.8. Raw data was filtered for cleaner reads before further analysis. The filtering pro-cess includes the deletion of the adapter sequences, reads with over 10% N contents and reads with over 50% nucle-otides whose quality score was lower than 10. The quality score of nucleotides was calculated using the following formula:
where e stands for the sequencing error rate, Qphred rep-resents the quality score of nucleotides.
The BWA software [38] was used for the alignment of resulted clean reads. Oryza sativa_IRGSP_1.0 was used as the reference genome which is available on the web-site of National Center for Biotechnology Information (NCBI). The sequencing depth, genome coverage, and other information of each sample were collected through the alignment process, and mutations were called.
(2) SRI= Ra
Rb
(3) NDSI= Ra−Rb
Ra+Rb
(4)
DSI =Ra−Rb
SNP detection and annotation
The detection of SNPs was achieved mainly using GATK [39] software toolkit. Briefly, the main detection process includes: (1) Picard’s Mark Duplicate tool was used to remove duplicates and mask the effects of PCR-duplica-tion of the resulted clean reads. (2) InDel Realignment was performed using GATK. During this process, local re-alignment was performed to correct the errors caused by the insertion deletion during the aliment process. (3) Base recalibration was performed using GATK to cali-brate the SNP quality. (4) Variant calling using GATK, mainly includes SNP and InDel. (5) Strict SNP filtration was performed based on the following criteria: SNP clus-ter filclus-tering (if there were 2 SNPs within 5 bp, they were filtered out), SNP filtering near Indel (SNPs within 5 bp near Indel were filtered out); and adjacent InDel filtering (if two Indels’ distance is less than 10 bp, they were fil-tered out) [40].
Phylogenetic analysis and population‑structure study
A neighbor-joining tree of all rice accessions was con-structed using MEGA5 software [41] based on the SNP markers and neighbor-joining algorithm (p-distance model with 1000 bootstrap). Based on the high-consist-ent SNP, the population structure of the samples was analyzed using admixture software [42]. A population structure map was constructed with the hypothesized K-value set from 1 to 15. A clustering process was per-formed, and the clustering results were cross-validated. The optimal clustering number was determined accord-ing to the minimum value of the cross-validation error rate. Based on SNPs, EIGENSOFT software [43] was used to perform Principal components analysis (PCA) analysis to cluster samples based on the first three prin-cipal components. The SPAGeDi software [44] was used to estimate the relative kinship of populations. Link-age disequilibrium analysis was performed using Plink2 software [45] to calculate the linkage disequilibrium between SNPs within a distance of 1000 kb on the same chromosome.
Genome‑wide association study (GWAS)
The resulted SNPs (minor allele frequency (MAF) ≥ 0.05) was used for the following GWAS with the selected bio-chemical and hyperspectral traits. The GWAS analysis was performed using the mixed linear model (MLM) of TASSEL software [46]. The formula for the mixed linear model is as follows:
Here, Q stands for the population structure calculated using admixture software, K stands for kinship of samples
(6)
y=Xα+Qβ+Kµ+e
from SPAGeDi software. X is the genotype while y stands for phenotype. The genome-wide significance thresh-olds of all tested traits were evaluated with Bonferroni correction:
Here, n stands for the effective number of independent SNPs. Bonferroni correction was applied here to control the type I error genome-wide. The P value threshold for significance in the Oryza sativa population was set to be p = 3.788e−09 and p = 3.788e−09 (suggestive and sig-nificant, respectively) for the studied population. In this study, only the associations that exceeded the significant P-value threshold were considered. The extent of local LD was evaluated for each selected significant SNP to determine the interval of each locus.
Gene annotation and comparison
Functional annotation analysis of genes in the associ-ated regions was performed using different databases including NCBI non-redundant (NR), The Gene Ontol-ogy (GO), Clusters of Orthologous Groups (COG), Kyoto Encyclopedia of Genes and Genomes (KEGG) Pathway analysis. A gene was annotated based on the principle that at least 2 databases provided the annotation descrip-tion. Further validation of candidate genes was obtained by manually screening based on published research and gene function descriptions of the aforementioned databases.
Results and discussion Biochemical traits acquisition
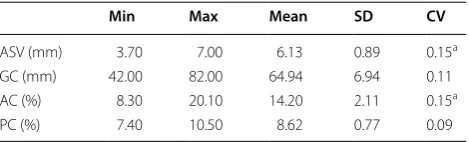
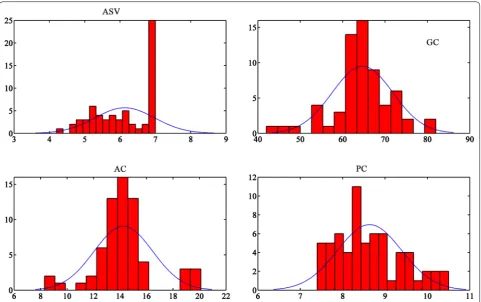
Table 2 shows the summary of the statistics of the phe-notypic trait data. Figure 2 shows the frequency distribu-tions of the phenotypic traits. Most of these traits were quantitative and continuous, which suggested that there might be a complex genetic influence, except ASV, which was not continuous (Fig. 2). Based on the general trends of other traits, almost all the other traits were roughly normally distributed.
(7)
P =
0.01
n
Table 2 Summary statistics for biochemical traits
a CV of ASV and AC are high (≥ 15%)
Min Max Mean SD CV
ASV (mm) 3.70 7.00 6.13 0.89 0.15a
GC (mm) 42.00 82.00 64.94 6.94 0.11
AC (%) 8.30 20.10 14.20 2.11 0.15a
ASV and AC are two of the multidimensional charac-teristics relating to rice grain quality that has been used worldwide in rice breeding and process technologies. The degree of degradation test was evaluated visually by inspectors which was graded by a range of scores from 1 to 7. Since a number of the ASV scores of the rice collection reached maximum measurement limit, which was 7, the distribution of ASV value was not nor-malized and heavily skewed, thus not suitable for Pear-son Correlation analysis. Therefore, it was not selected for the following Pearson correlation analysis. ASV is the inverse indicator of the gelatinization tempera-ture (GT) of rice starch granules [47], which is closely related to rice cooking behavior and sensory properties due to crystalline melting and starch solubilisation dur-ing cookdur-ing process. ASV is also related to AC, there-fore, it can be observed in Table 2 that AC has a similar high CV (≥ 15%) as ASV. The CV of ASV and AC were very high (≥ 15%), which means these data sets had a higher dispersion. It could be caused by severe differ-ences between the content of these biochemical traits. A Pearson Correlation analysis was conducted for hyperspectral traits and biochemical traits including PC, AC and GC.
Hyperspectral data analysis and hyperspectral traits extraction
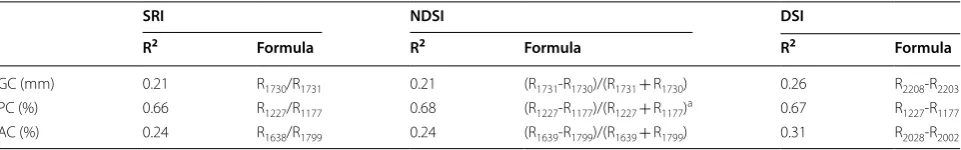
Overall, the data size of hyperspectral data from the spectrometer was 6.5 MB. Based on the summary of Pearson correlation analysis of GC, AC and PC with all three hyperspectral indices shown in Table 3, GC and AC had low determination coefficient with all three hyperspectral indices (R2
SRI = 0.21, R2NDSI = 0.21 and R2
DSI = 0.26 for GC; R2SRI = 0.24, R2NDSI = 0.24 and R2
DSI = 0.31 for AC), while PC showed high determina-tion coefficient with all three indices, especially NDSI R2
NDSI = 0.68. Therefore, NDSI was selected for the final GWAS analysis as a hyperspectral trait for PC. The cor-relation between hyperspectral data and biochemical traits of AC and GC were low (R2 < 0.6). This might be because that due to a relatively small sample size and large dispersed data set of AC, the correlation between hyperspectral traits and AC became low. In order to construct a hyperspectral index that could be applied for AC, a bigger sample size would be selected in the future. In addition, because the GC is a complex trait and the nature of the GC data set was not a measure-ment of the content of a certain chemical/compound, but the length of flow distance [48], which makes it not
suitable for hyperspectral technology, because hyper-spectral signal was relating to the resonance of cer-tain chemical bonds [25]. There is not any published research on using hyperspectral technology to dissect GC of rice seeds. In addition, it was reported that the accuracy of the algorism developed for the extraction of phenotypic traits using phenotyping platforms is greatly affected by the sample size [49, 50]. At the same level of other effects, as the sample size increased, the degree of freedom of the test increased and the result-ing P-value became more significant [51–53].
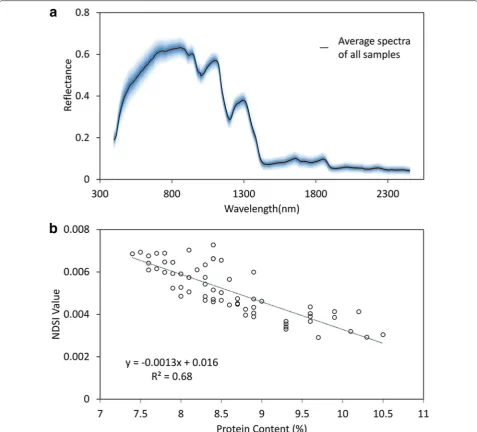
Eventually, PC was selected for hyperspectral analysis and GWAS. Two optimal wavelengths were selected for the biochemical trait PC based on formula 3. Figure 3a shows the mean spectra all rice accessions. The results of correlation analysis indicated that NDSI had high correlation with PC (R2
NDSI = 0.68) (Fig. 3b).
Genome sequencing and assembly
Sequencing results showed that approximately 12-fold coverage was achieved, generating a total of 419.53 Gbp clean data, with Q30 up to 94.65%. Detailed sequencing data statistics was listed in Additional file 3: Table S2. The average matching ratio between the sample and the reference genome was 98.81%, and the genome coverage was 96.79% (at least one base coverage) when mapped on the reference genome. Only SNP mark-ers with minimum allele frequency (MAF) higher than 0.05 were selected for further analysis. Eventually, a total of 3,398,019 SNP loci and 773,337 Indel loci were identified in this study. The multiple test corrections get more severity as the number of sequencing cases increases. Due to the increase in the depth of sequenc-ing, the marker density is continuously increassequenc-ing, and the severity of the test is also increasing [51]. Here, the sequencing depth reached 12 × which relatively improved the chance of accurate SNP loci identifica-tion. Together with strict SNP and gene screening, fil-tering and gene function profiling, the resulted SNP/ gene loci using hyperspectral traits extracted from hyperspectral data in the GWAS analysis could be more specific and accurate.
Phylogenetic analysis and population‑structure study
The neighbor-joining tree of all rice varieties is shown in Fig. 4a. Figure 4b shows the result of PCA analysis using 2 principle components PC1 and PC3. No Clear separa-tion of subgroups was observed based on components PC1 and PC3 (Fig. 4b), which might be due to the pos-sible complexity of the studied population and potential gene flow of each rice variety due to natural and artifi-cial selection. Therefore, a population structure analysis using ADMIXTURE software was employed to calculate the optimum subgroups for GWAS analysis [54]. Based on the population structure map (Fig. 4d) and cross-val-idation (CV) errors, the optimum cluster group number in this population was determined to be 6 (Fig. 4c). For better visualization of each subgroup and their position on the phylogenic tree, each rice variety subgroup on the tree was marked by different colors based on the result of population analysis. The linkage disequilibrium decay distance (LDD) of all samples was shown in Fig. 4e. The LD50, which was the LDD when the pairwise coefficient of determination (r2) dropped to half its maximum value, was applied to evaluate the linkage disequilibrium. The longer LD50 indicated a smaller chance of gene recom-bination [55]. On average, it was observed that LD50 of all the rice samples was longer than 100 kb, which indi-cated a small chance of LD [56]. However, the difference in LDD between each rice chromosomes suggested com-plicated gene recombination events within this rice culti-var population (data shown in Additional file 4: Fig. S2). The frequency of kinship-value in all the rice accessions were shown in Fig. 4f. As the kinship value increases, the frequency decreases rapidly, indicating a relatively high complexity of population structure, and relatively less kinship within this population.
GWAS analysis and candidate gene annotation
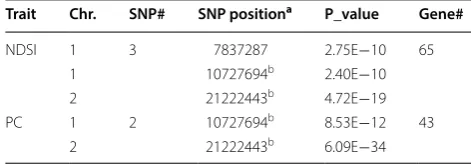
The threshold of p = 3.788e−09 was used to identify SNPs relating to selected traits PC and NDSI. Manhat-tan plots and quantile–quantile plots for other traits were shown in Additional file 5: Fig. S2. The summary of iden-tified associated gene numbers for 5 traits were listed in Table 4. The results of hyperspectral trait NDSI and bio-chemical trait PC in GWAS were compared to evaluate Table 3 Pearson correlation analysis of extracted indices with selected wavelengths
a NDSI was selected for correlation analysis and GWAS
SRI NDSI DSI
R2 Formula R2 Formula R2 Formula
GC (mm) 0.21 R1730/R1731 0.21 (R1731‑R1730)/(R1731+ R1730) 0.26 R2208‑R2203
PC (%) 0.66 R1227/R1177 0.68 (R1227‑R1177)/(R1227+ R1177)a 0.67 R1227‑R1177
the effects of using hyperspectral traits as phenotyping tool for biochemical traits (Fig. 5). The Manhattan plots and quantile–quantile plots of biochemical attributes of rice crude protein contents represented by PC and NDSI as a substitute of PC in GWAS were shown in Fig. 5.
As it was shown in the Manhattan plots and quantile– quantile plots, by biochemical trait PC, we identified top peaks located on chromosomes 1 and 2, which were posi-tions correlating with known loci SAS3 and EL5, respec-tively (Fig. 5a, b). These two loci were also detected by
Fig. 3 The mean spectra of rice accessions and Pearson correlation analysis. a The average spectra of all rice samples. The blue shade indicates 3 times of standard deviation. b The correlation analysis of hyperspectral index NDSI and PC used for GWAS, with correlation coefficients of R2= 0.68
Fig. 4 The population structure analysis based on all rice accessions. a Neighbor‑joining tree of all rice accessions which was constructed from simple matching distance based on whole‑genome SNP studies. Branch and circle block colors indicate different subgroup distributions. b Principal component (PCA) analysis plots of first and third components for all rice accessions, using the same colors as in a. c Cross‑validation (CV) errors graph. d Population structure based on c (K = 6). e Genome‑wide average LD decay analysis estimated from all rice accessions. f Histogram of kinship
hyperspectral index NDSI (Fig. 5b), indicating hyper-spectral index NDSI, could be used for GWAS analysis and identifying the all the gene loci as by biochemical trait PC. NDSI index also detected one SNP position 7837287 located on chromosome 1 (Table 4), which was not identified by PC trait. Hu et al. [57], reported that in their study of doubled haploid lines, there were quantita-tive loci located on chromosome 1. In addition, according to Zhang et al. [58] four protein fractions and crude pro-tein contents were located on chromosome 1 and 2 based on their study on seventy-one recombinant inbred lines, including, Albumin, Globulin, Prolamin, Glutelin and crude protein, which is similar to our results.
SAS3 (OsSAMS3) for S-adenosyl-l-methionine syn-thetases (SAMS) on chromosome 1 was previously recorded to be important for histone H3K4me3 in rice, because it regulates the expression of genes related to flowering development by DNA methylation. By knock-ing down SAS3, the expression of the flowerknock-ing key genes including Early heading date 1 (Ehd1), Hd3a and RFT1 (rice FT-like genes) were greatly decreased, which lead to severe late flowering. This might cause decreasing of rice milking stage, which was important for the accu-mulation of seed nutrition including rice protein con-tent [59]. Meanwhile, rice EL5 belongs to an ATL family gene, which is characterized by a transmembrane domain at the N-terminal and a RING-H2 finger domain (RFD). Koiwai et al. [60, 61] reported that EL5, function as a membrane-anchored E3, was important for the mainte-nance of cell viability after root primordial formation was initiated. It was a ubiquitously expressed protein in rice, which could affect rice plant growth status by affect the
development of root initiation, thus influence the accu-mulation of rice nutrition including protein content.
LD block heatmaps based on the LD of each identified SNP loci are shown in Fig. 5c–e. The LD analysis of the three loci showed that these markers had relatively low LD parameter (R2 < 0.6) which indicates a relatively low correlation with each other. These LD regions indicated relatively strong inheritability with their traits accord-ingly, which might not be due to LD block effects.
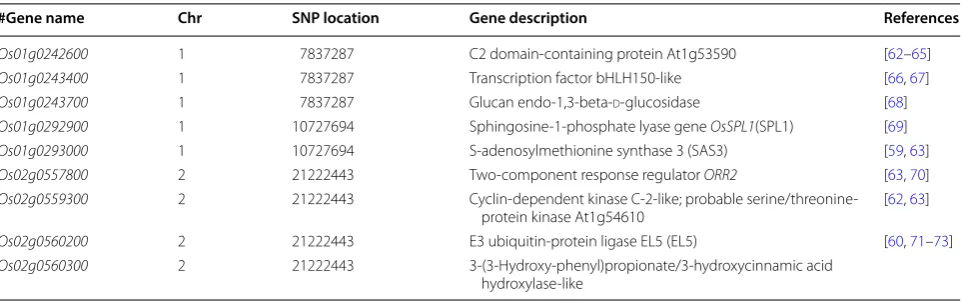
Potential candidate gene loci that could be related to PC content based on KEGG annotation, GO annota-tion and NR annotaannota-tion (NCBI) were summarized in Table 5. These gene loci were identified in a number of studies that have reported functions that might directly or indirectly be related to protein content variation. One research reported that glx-1, a glyoxalase gene, could express protein OsGlyI, which might be relating to improving abiotic stress tolerance and grain yield in rice [74]. During the past few years, more research has reported the function of non-coding RNAs and histone modifications on the regulation of transcription, flower-ing periods, rice reproduction, and development of rice seeds. Two-component response regulator ORR2 was reported to cause rice morphology variation and cyto-kinin metabolism [70].
The basic helix-loop-helix (bHLH) proteins, a super-family of TFs, are one of the largest TF families in plants, which includes 177 bHLH genes in the rice genome. These conserved TFs have a diverse variety of func-tions in many plant signaling processes that regulates the expression of functional proteins involved in differ-ent biological processes including cell proliferation and differentiation [75], root development, anthocyanin bio-synthesis, plant morphology and fruit pigment accumu-lation [76], mineral uptake [77], abiotic stress response [78] and seed morphology [79], etc. In the study of pol-len development regulation conducted by Ko et al. [64] it was found that bHLH142 played an important role in pollen development, which could potentially affect the flowering date and the development of grains. According to Liu, the flowering time was associated with rice seed protein content [80]. Most interestingly, one research on the wheat grain storage proteins (GSPs) in response to nitrogen application reported that 26 differentially expressed genes (DEGs) were related to the accumulation Table 4 A subset of associated loci and candidate genes
numbers according to GWAS analysis for PC and NDSI
a Position in bp; Chr. Chromosome
b Hyperspectral index NDSI could locate the exact SNP positions as PC
Trait Chr. SNP# SNP positiona P_value Gene#
NDSI 1 3 7837287 2.75E−10 65
1 10727694b 2.40E−10
2 21222443b 4.72E−19
PC 1 2 10727694b 8.53E−12 43
2 21222443b 6.09E−34
(See figure on next page.)
of GSPs. In their study, with an increasing level of nitro-gen, the GSPs were remarkably increased, while three bHLH genes including TFs bHLH-150 were evidently down-regulated 10–25 and 15–35 days after anthesis [67]. This research suggests the function of bHLH-150 in regulating the accumulation of rice storage protein. It indicates that SNP locus sf017837287 identified by NDSI but not PC is related to rice protein content. To further validate this result, a gene function analysis of bHLH-150 in rice would be conduct in the future studies. However, this further illustrates the promising potential of hyper-spectral traits in GWAS study which is rapid to acquire and can identify promising genes while biochemical traits could not. The detailed gene annotations were listed in Additional file 6: Table S3.
Comparison of gene loci identified by biochemical trait PC and hyperspectral trait NDSI
Kegg annotation histogram shows that traits PC (Fig. 6a) and NDSI (Fig. 6b) annotated exactly 3 same pathways including Cysteine and methionine metabolism, homol-ogous recombination and plant hormone signal trans-duction. These three pathways are included in three biological processes including, metabolism, genetic information processing and environmental informa-tion processing. The cysteine and methionine metabolic pathway was reported important for biosynthesis and metabolism of some of amino acids/protein, because results of the reported research showed an increase of cysteine and glutathione, which was accompanied by an increasing level of free methionine and methionine that was incorporated into water-soluble protein fractions in rice seeds. It was noted that there were more isoleu-cine, leuisoleu-cine, and valine contents in the transgenic lines of rice with high activity of cysteine and methionine metabolic pathway [81, 82]. The top hits of the SNP locus (Os01g0293000) in NCBI gene bank was annotated to be
related to the biosynthesis of amino acids. Gene function analysis of genes identified by NDSI but not detected by PC on chromosome 1 position 7837287 was able to iden-tify annotated gene bHLH-150 which was reported to be involved in the regulation of grain storage protein, which indicates that NDSI could possibly serve as a substitute of PC and identify more genes than PC involved in rice protein content in GWAS.
The distribution of pathways and gene loci that were identified by PC and NDSI based on Kegg database were summarized in the Venn diagrams in Fig. 6c, d, respec-tively. It can be observed from Kegg pathway annota-tion, that NDSI was able to locate the same biological pathway as PC. Meanwhile, in terms of gene numbers, NDSI located 65 genes, which covered all the 43 genes that were identified by PC. This result further proofed the accuracy and feasibility of hyperspectral index NDSI as a hyperspectral trait that could be used in GWAS as a substitute of PC. Since the acquisition of NDSI was cheaper, less biased from manual measurement, accurate in identifying SNPs, and much more rapid, this method is potentially a high throughput phenotyping tool in GWAS for protein content of rice quality.
Rapid acquisition of biochemical data by hyperspectral technology for genetic studies
Traditionally, it is time-consuming and labor-intensive to acquire most of the biochemical component traits, but using spectroradiometer we not only obtained stand-ardized phenotypic traits accurately but achieved high-through, which could be applied to keep up with the advancing speed of genotyping [2, 10]. Since the gap between the development of phenotyping and genotyp-ing are mainly caused by the lackgenotyp-ing of standards as well as low efficiency of current phenotyping method [83]. The study of high throughput phenotyping method using different sensors, computers and integrated platforms Table 5 Subset of potential candidate gene loci related to PC
#Gene name Chr SNP location Gene description References
Os01g0242600 1 7837287 C2 domain‑containing protein At1g53590 [62–65]
Os01g0243400 1 7837287 Transcription factor bHLH150‑like [66, 67]
Os01g0243700 1 7837287 Glucan endo‑1,3‑beta‑d‑glucosidase [68]
Os01g0292900 1 10727694 Sphingosine‑1‑phosphate lyase gene OsSPL1(SPL1) [69]
Os01g0293000 1 10727694 S‑adenosylmethionine synthase 3 (SAS3) [59, 63]
Os02g0557800 2 21222443 Two‑component response regulator ORR2 [63, 70]
Os02g0559300 2 21222443 Cyclin‑dependent kinase C‑2‑like; probable serine/threonine‑
protein kinase At1g54610 [62, 63]
Os02g0560200 2 21222443 E3 ubiquitin‑protein ligase EL5 (EL5) [60, 71–73] Os02g0560300 2 21222443 3‑(3‑Hydroxy‑phenyl)propionate/3‑hydroxycinnamic acid
could improve the phenotyping speed, the standardiza-tion of phenotypic traits, as well as incorporate pheno-typing methods/traits that could not be measured or identified by human being [84, 85]. Optimize the criteria for phenotypic measurement and identification systems is of great importance for the advancing of phenotyping. Plant phenotypes are determined by the combination of plant genotypes and different environment conditions where the plant grows. Changes of environment condi-tions are difficult to control and will cause great interfer-ence. Coupled with the phenotypic measurement bias due to human interference, it will reduce the significance
of the test. A good solution is to use an automatic phe-notype identification system that can effectively reduce the error of manual operation. Strictly following the cri-teria of processing and selection of phenotypic data set is important during the extraction of feasible hyperspec-tral indices. In order to get the best results, CVs lower than 0.15 and normal data distribution are applied in this study for the best performance of Pearson correlation analysis and index extraction.
In the future study, more hyperspectral traits rep-resenting different biochemical traits, such as starch, components relating to rice fragrance and texture, need
to be extracted for GWAS analysis to improve applica-tion of the SNP identificaapplica-tion process. Meanwhile, more gene function analysis of GWAS on hyperspectral traits are needed to fully address the effect of hyperspectral traits in genetic studies. Other information related to this research is listed in Additional files 7, 8, 9, 10.
Conclusions
In this study, we tried to apply high through-put spectro-radiometer hyperspectral data to extract hyperspectral traits that were highly related to biochemical attributes for rice quality. One resulted hyperspectral trait NDSI was used for GWAS as an alternative for rice protein content to investigate the possibility of using hyperspec-tral trait for genetic study. The results showed that the application of hyperspectral trait NDSI had the potential to identify the same genes/pathways as PC and in addi-tion, NDSI detected one more SNP locus that is related to grain protein content which could not be identified by PC. In conclusion, hyperspectral traits have the potential to be applied to GWAS as an alternative to traditional time-consuming and labor-intensive biochemical com-ponent measurements, which could greatly improve the phenotyping speed and decrease bias caused by human operation for genetic study. This research provides a potential new method to phenotype biochemical traits of rice for genetic studies based on the hyperspectral technology.
Additional files
Additional file 1: Table S1. Information of all rice accessions. Additional file 2: Fig. S1. The setting of the hyperspectral data acquisi‑ tion system.
Additional file 3: Table S2. Summary of re‑sequencing results. Additional file 4: Fig. S2. LD decay of all rice accessions. Additional file 5: Fig. S3. GWAS results of other traits. Additional file 6: Table S3. Summary of gene annotation. Additional file 7: Table S4. Measurements of biochemical traits. Additional file 8: Table S5. MAF of all identified SNPs.
Additional file 9: Fig. S4. Distribution of reflectance for signal‑to‑noise ratio.
Additional file 10: Fig. S5. The distribution of accumulative SNP depth.
Abbreviations
GWAS: genome‑wide association study; CV: coefficient of variance; STDEV: standard deviation; SNP: single nucleotide polymorphism; MLM: mixed linear model; InDel: insertion or deletion of bases; PCA: principal components analysis; LDD: linkage disequilibrium decay distance; LD: linkage disequilib‑ rium; NCBI: National Center for Biotechnology Information Search database; NR: RefSeq non‑redundant proteins; KEGG: Kyoto Encyclopedia of Genes and Genomes; GO: gene ontology; COG: clusters of orthologous groups; GSPs: grain storage proteins; DEGs: differential expressed genes.
Acknowledgements
Not applicable.
Authors’ contributions
All authors have made significant contributions to this research. DS and HC conceived and designed the experiments. DS, AA, AIE‑M, YZ, NZ performed the experiment. DS, HC, HW, LW and JT conducted data analysis. DS and HC interpreted data analysis. XL, HF, QS, FL and YH provided suggestions on the experiment design. DS drafted the manuscript. All authors read and approved the final manuscript.
Funding
This research was funded by Key Research & Development Program from Department of Science and Technology of Zhejiang Province (2015C02007), National Key R&D Program supported by Ministry of Science and Technol‑ ogy of the P.R. China (2016YFD0200600, 2016YFD0200603) and Key Research Program of Jiaxing city (2018AY11025).
Availability of data and materials
ll the rice varieties included in the study are available from the corresponding author on reasonable request. All the sequencing raw data were deposited in Sequence Read Archive (SRA) database in a BioProject under the SRA acces‑ sion ID “PRJNA491628” on The National Center for Biotechnology Information (NCBI). All generated or analyzed data during this study are included in this published article and its supplementary information files. This article is not published nor is under publication elsewhere.
Ethics approval and consent to participate
Not applicable.
Consent for publication
Not applicable.
Competing interests
The authors declare that they have no competing interests.
Author details
1 College of Biosystems Engineering and Food Science, Zhejiang University,
Hangzhou 310058, People’s Republic of China. 2 Key Laboratory of Spectros‑
copy Sensing, Ministry of Agriculture and Rural Affairs, Hangzhou 310058, People’s Republic of China. 3 State Key Laboratory of Modern Optical
Instrumentation, Zhejiang University, Hangzhou 310058, People’s Republic of China. 4 Jiaxing Academy of Agricultural Sciences, Jiaxing 314016, China. 5 State Key Laboratory of Rice Biology, Institution of Crop Science, Zhejiang
University, Hangzhou 310058, China. 6 Biomarker Technologies Corporation,
Beijing 101300, China.
Received: 18 December 2018 Accepted: 2 May 2019
References
1. Duan L, Yang W, Huang C, Liu Q. A novel machine‑vision‑based facility for the automatic evaluation of yield‑related traits in rice. Plant Methods. 2011;7(1):44.
2. Li L, Zhang Q, Huang D. A review of imaging techniques for plant pheno‑ typing. Sensors. 2014;14(11):20078–111.
3. Wang W, Mauleon R, Hu Z, Chebotarov D, Tai S, Wu Z, Li M, Zheng T, Fuentes RR, Zhang F, et al. Genomic variation in 3,010 diverse accessions of Asian cultivated rice. Nature. 2018;557(7703):43.
4. Chen W, Gao Y, Xie W, Gong L, Lu K, Wang W, Li Y, Liu X, Zhang H, Dong H. Genome‑wide association analyses provide genetic and biochemi‑ cal insights into natural variation in rice metabolism. Sci Found China. 2014;46(2):714–21.
5. Gong L, Chen W, Gao Y, Liu X, Zhang H, Xu C, Yu S, Zhang Q, Luo J. Genetic analysis of the metabolome exemplified using a rice population. Proc Natl Acad Sci USA. 2013;110(50):20320–5.
related to domestication and improvement in soybean. Nat Biotechnol. 2015;33(4):408–14.
7. Yang W, Guo Z, Huang C, Wang K, Jiang N, Feng H, Chen G, Liu Q, Xiong L. Genome‑wide association study of rice (Oryza sativa L.) leaf traits with a high‑throughput leaf scorer. J Exp Bot. 2015;66(18):5605–15.
8. Zhao K, Tung CW, Eizenga GC, Wright MH, Ali ML, Price AH, Norton GJ, Islam MR, Reynolds A, Mezey J. Genome‑wide association mapping reveals a rich genetic architecture of complex traits in Oryza sativa. Nat Commun. 2011;2(1):467.
9. Mackay I, Powell W. Methods for linkage disequilibrium mapping in crops. Trends Plant Sci. 2007;12(2):57–63.
10. Yang W, Duan L, Chen G, Xiong L, Liu Q. Plant phenomics and high‑ throughput phenotyping: accelerating rice functional genomics using multidisciplinary technologies. Curr Opin Plant Biol. 2013;16(2):180–7. 11. Furbank RT, Tester M. Phenomics–technologies to relieve the phenotyp‑
ing bottleneck. Trends Plant Sci. 2011;16(12):635.
12. Yano K, Yamamoto E, Aya K, Takeuchi H, Lo PC, Hu L, Yamasaki M, Yoshida S, Kitano H, Hirano K. Genome‑wide association study using whole‑ genome sequencing rapidly identifies new genes influencing agronomic traits in rice. Nat Genet. 2016;48(8):927.
13. Wang Y, Wang D, Shi P, Omasa K. Estimating rice chlorophyll content and leaf nitrogen concentration with a digital still color camera under natural light. Plant Methods. 2014;10(1):36.
14. Hui F, Guo Z, Yang W, Huang C, Chen G, Wei F, Xiong X, Zhang H, Wang G, Xiong L. An integrated hyperspectral imaging and genome‑wide associa‑ tion analysis platform provides spectral and genetic insights into the natural variation in rice. Sci Rep. 2017;7(1):4401.
15. Pantalião GF, Narciso M, Guimarães C, Castro A, Colombari JM, Breseghe‑ llo F, Rodrigues L, Vianello RP, Borba TO, Brondani C. Genome wide asso‑ ciation study (GWAS) for grain yield in rice cultivated under water deficit. Genetica. 2016;144(6):651–64.
16. Jaradat AA, Goldstein W. Diversity of maize kernels from a breeding pro‑ gram for protein quality: I. Physical, biochemical, nutrient, and color traits. Crop Sci. 2013;53(3):956–76.
17. Sakunpak A, Suksaeree J, Pathompak P, Charoonratana T, Sermkaew N. Antioxidant individual γ‑oryzanol screening in cold pressed rice bran oil of different Thai rice varieties by HPLC‑DPPH method. Int J Pharm Pharm Sci. 2014;6(6):592–7.
18. Daygon VD, Prakash S, Calingacion M, Riedel A, Ovenden B, Snell P, Mitchell J, Fitzgerald M. Understanding the Jasmine phenotype of rice through metabolite profiling and sensory evaluation. Metabolomics. 2016;12(4):63.
19. Lupotto E, Cavagna B, Corana F, Mellerio CG, Lanzanova C, Cavigiolo S, Greppi D. Quality evaluation and high throughput analysis of aromatic Italian rice varieties through HS‑SPME/GC–MS analysis. In: Consumer Driven Cereal Innovation. AACC International Press; 2008. pp. 78–82. 20. Yi QX, Bao AM, Qiang W, Jin Z. Estimation of leaf water content in
cotton by means of hyperspectral indices. Comput Electron Agric. 2013;90(1):144–51.
21. Gupta RK, Vijayan D, Prasad TS. The relationship of hyper‑spectral vegeta‑ tion indices with leaf area index (LAI) over the growth cycle of wheat and chickpea at 3 nm spectral resolution. Adv Space Res. 2006;38(10):2212–7. 22. Liu ZY, Wu HF, Huang JF. Application of neural networks to discriminate
fungal infection levels in rice panicles using hyperspectral reflec‑ tance and principal components analysis. Comput Electron Agric. 2010;72(2):99–106.
23. Mei H, Deng X, Hong T, Luo X, Deng X. Early detection and grading of citrus huanglongbing using hyperspectral imaging technique. Trans Chin Soc Agric Eng. 2014;30(9):140–7.
24. Sabatier DR, Moon CM, Mhora TT, Rutherford RS, Laing MD. Near‑infrared reflectance (nir) spectroscopy as a high‑throughput screening tool for pest and disease resistance in a sugarcane breeding programme. Int Sugar J. 2014;116(1388):580–3.
25. Weng H, Lv J, Cen H, He M, Zeng Y, Hua S, Li H, Meng Y, Fang H, He Y. Hyperspectral reflectance imaging combined with carbohydrate metabolism analysis for diagnosis of citrus Huanglongbing in different seasons and cultivars. Sens Actuators B Chem. 2018;275:50–60. 26. Moigne ML, Maury C, Bertrand D, Jourjon F. Sensory and instrumental
characterisation of Cabernet Franc grapes according to ripening stages and growing location. Food Qual Prefer. 2008;19(2):220–31.
27. Robertson KM, Milliken RE, Li S. Estimating mineral abundances of clay and gypsum mixtures using radiative transfer models applied to visible‑ near infrared reflectance spectra. Icarus. 2016;277:171–86.
28. Lehmann JRK, Grossestoltenberg A, Römer M, Oldeland J. Field spectros‑ copy in the VNIR‑SWIR region to discriminate between Mediterranean native plants and exotic‑invasive shrubs based on leaf tannin content. Remote Sens. 2015;7(2):1225–41.
29. Zheng H, Cheng T, Yao X, Deng X, Tian Y, Cao W, Zhu Y. Detection of rice phenology through time series analysis of ground‑based spectral index data. Field Crops Res. 2016;198:131–9.
30. Zhao C, Wang Z, Wang J, Huang W. Relationships of leaf nitrogen concen‑ tration and canopy nitrogen density with spectral features parameters and narrow‑band spectral indices calculated from field winter wheat (L.) spectra. Int J Remote Sens. 2012;33(11):3472–91.
31. Kong W, Zhang C, Liu F, Nie P, He Y. Rice seed cultivar identification using near‑infrared hyperspectral imaging and multivariate data analysis. Sen‑ sors. 2013;13(7):8916–27.
32. Yan S, Wang X, Huang J, Liu J, Wang L. Study on the method and model of rice quality monitoring based on hyperspectral data. In: Fifth interna‑ tional conference on agro‑geoinformatics; 2016, p. 1–4.
33. Liu M‑B, Li X‑L, Liu Y, Huang J‑F, Tang Y‑L. Detection of crude protein, crude starch, and amylose for rice by hyperspectral reflectance. Spectrosc Lett. 2014;47(2):101–6.
34. Kumar T, Ryu CS, Kang JG, Kang YS, Kim SH, Jeon SR, Kim WJ, Kim SK, Kim HJ. Predicting grain protein content of rice using remote sensing technol‑ ogy. Ksam Autumn Precis Agric Conf. 2016;21(2):199.
35. Onoyama H, Ryu C, Suguri M, Iida M. Estimation of rice protein content before harvest using ground‑based hyperspectral imaging and region of interest analysis. Precis Agric. 2017;5:1–14.
36. Suhama T, Takeda T, Onodera H. Study for estimation of rice grain protein contents using hyperspectral data. J Jpn Soc Photogramm. 2012;49(6):358–67.
37. Tang Y, Huang J, Wang R, Rong X. Estimating the crude protein contents in rice grains using hyperspectral data. Trans Chin Soc Agric Eng. 2006;22(7):114–8.
38. Li H, Durbin R. Fast and accurate short read alignment with Burrows– Wheeler transform. Bioinformatics. 2009;25(14):1754–60.
39. Kanehisa M, Goto S, Kawashima S, Okuno Y, Hattori M. The KEGG resource for deciphering the genome. Nucleic Acids Res. 2004;32(Database issue):D277.
40. Reumers J, Rijk PD, Zhao H, Liekens A, Smeets D, Cleary J, Loo PV, Bossche MVD, Catthoor K, Sabbe B. Optimized filtering reduces the error rate in detecting genomic variants by short‑read sequencing. Nat Biotechnol. 2012;30(1):61–8.
41. Tamura K, Peterson D, Peterson N, Stecher G, Nei M, Kumar S. MEGA5: molecular evolutionary genetics analysis using maximum likelihood, evolutionary distance, and maximum parsimony methods. Mol Biol Evol. 2011;28(10):2731.
42. Alexander DH, Novembre J, Lange K. Fast model‑based estimation of ancestry in unrelated individuals. Genome Res. 2009;19(9):1655–64. 43. Price AL, Patterson NJ, Plenge RM, Weinblatt ME, Shadick NA, Reich D.
Principal components analysis corrects for stratification in genome‑wide association studies. Nat Genet. 2006;38:904.
44. Hardy OJ, Vekemans X. spagedi: a versatile computer program to analyse spatial genetic structure at the individual or population levels. Mol Ecol Resour. 2010;2(4):618–20.
45. Purcell S, Neale B, Todd‑Brown K, Thomas L, Ferreira MAR, Bender D, Maller J, Sklar P, Bakker PIWD, Daly MJ. PLINK: a tool set for whole‑genome association and population‑based linkage analyses. Am J Hum Genet. 2007;81(3):559–75.
46. Cingolani P, Platts A, Wang LL, Coon M, Nguyen T, Wang L, Land SJ, Lu X, Ruden DM. A program for annotating and predicting the effects of single nucleotide polymorphisms, SnpEff: SNPs in the genome of Drosophila melanogaster strain w1118; iso‑2; iso‑3. Fly (Austin). 2012;6(2):80–92. 47. Delwiche SR, Mckenzie KS, Webb BD. Quality characteristics in rice by
near‑infrared reflectance analysis of whole‑grain milled samples. Cereal Chem. 1996;73(2):257–63.
49. Halperin O, Gebremedhin A, Wallach R, Moshelion M. High‑throughput physiological phenotyping and screening system for the charac‑ terization of plant–environment interactions. Plant J Cell Mol Biol. 2017;89(4):839–50.
50. Sun S, Li C, Paterson AH, Jiang Y, Xu R, Robertson JS, Snider JL, Chee PW. In‑field high throughput phenotyping and cotton plant growth analysis using LiDAR. Front Plant Sci. 2018;22(9):16.
51. Gatsonis C, Sampson AR. Multiple correlation: exact power and sample size calculations. Psychol Bull. 1989;106(3):516–24.
52. Kareev Y, Lieberman I, Lev M. Through a narrow window: sample size and the perception of correlation. J Exp Psychol Gen. 1997;126(126):278–87. 53. Zou GY. Sample size formulas for estimating intraclass correlation coef‑
ficients with precision and assurance. Stat Med. 2012;31(29):3972–81. 54. Myles S, Boyko AR, Owens CL, Brown PJ, Grassi F, Aradhya MK, Prins B, Reynolds A, Chia J‑M, Ware D. Genetic structure and domestication his‑ tory of the grape. Proc Natl Acad Sci. 2011;108(9):3530–5.
55. Flint‑Garcia SA, Thornsberry JM. Structure of linkage disequilibrium in plants. Annu Rev Plant Biol. 2003;54(4):357–74.
56. Gupta PK, Rustgi S, Kulwal PL. Linkage disequilibrium and association studies in higher plants: present status and future prospects. Plant Mol Biol. 2005;57(4):461–85.
57. Hu ZL, Li P, Zhou MQ, Zhang ZH, Wang LX, Zhu LH, Zhu YG. Mapping of quantitative trait loci (QTLs) for rice protein and fat content using dou‑ bled haploid lines. Euphytica. 2004;135(1):47–54.
58. Zhang W, Bi J, Chen L, Zheng L, Ji S, Xia Y, Xie K, Zhao Z, Wang Y, Liu L. QTL mapping for crude protein and protein fraction contents in rice (Oryza sativa L.). J Cereal Sci. 2008;48(2):539–47.
59. Li W, Han Y, Tao F, Chong K. Knockdown of SAMS genes encoding S‑adenosyl‑l‑methionine synthetases causes methylation alterations of DNAs and histones and leads to late flowering in rice. J Plant Physiol. 2011;168(15):1837–43.
60. Koiwai H, Tagiri A, Katoh S, Katoh E, Ichikawa H, Minami E, Nishizawa Y. RING‑H2 type ubiquitin ligase EL5 is involved in root develop‑ ment through the maintenance of cell viability in rice. Plant J. 2010;51(1):92–104.
61. Mochizuki S, Jikumaru Y, Nakamura H, Koiwai H, Sasaki K, Kamiya Y, Ichi‑ kawa H, Minami E, Nishizawa Y. Ubiquitin ligase EL5 maintains the viability of root meristems by influencing cytokinin‑mediated nitrogen effects in rice. J Exp Bot. 2014;65(9):2307–18.
62. Consortium FLC, Kikuchi S, Satoh K, Nagata T, Kawagashira N, Doi K, Kishimoto N, Yazaki J, Ishikawa M, Yamada H. Collection, mapping, and annotation of over 28,000 cDNA clones from japonica rice. Science. 2003;301(5631):376.
63. Wang H, Niu QW, Wu HW, Liu J, Ye J, Yu N, Chua NH. Analysis of noncod‑ ing transcriptome in rice and maize uncovers roles of conserved lncRNAs associated with agriculture traits. Plant J. 2015;84(2):404–16.
64. Ko SS, Li MJ, Sun‑Ben KM, Ho YC, Lin YJ, Chuang MH, Hsing HX, Lien YC, Yang HT, Chang HC. The bHLH142 transcription factor coordinates with TDR1 to modulate the expression of EAT1 and regulate pollen develop‑ ment in rice. Plant Cell. 2014;26(6):2486.
65. Fu Z, Liang W. The rice basic helix‑loop‑helix transcription factor TDR INTERACTING PROTEIN2 Is a central switch in early anther development. Plant Cell. 2014;26(4):1512.
66. Sakai H, Lee SS, Tanaka T, Numa H, Kim J, Kawahara Y, Wakimoto H, Yang C, Iwamoto M, Abe T. Rice Annotation Project Database (RAP‑DB): an integrative and interactive database for rice genomics. Plant Cell Physiol. 2013;54(2):E6.
67. Zheng T, Qi PF, Cao YL, Han YN, Ma HL, Guo ZR, Wang Y, Qiao YY, Hua SY, Yu HY. Mechanisms of wheat (Triticum aestivum) grain storage proteins in response to nitrogen application and its impacts on processing quality. Sci Rep. 2018;8(1):11928.
68. Sasaki T, Matsumoto T, Yamamoto K, Sakata K, Baba T, Katayose Y, Wu J, Niimura Y, Cheng Z, Nagamura Y. The genome sequence and structure of rice chromosome 1. Nature. 2002;420(6913):312–6.
69. Zhang H, Jin X, Huang L, Hong Y, Zhang Y, Ouyang Z, Li X, Song F, Li D. Molecular characterization of rice sphingosine‑1‑phosphate lyase gene OsSPL1 and functional analysis of its role in disease resistance response. Plant Cell Rep. 2014;33(10):1745–56.
70. Hirose N, Makita N, Kojima M, Kamadanobusada T, Sakakibara H. Over‑ expression of a type‑A response regulator alters rice morphology and cytokinin metabolism. Plant Cell Physiol. 2007;48(3):523.
71. Takai R, Matsuda N, Nakano A, Hasegawa K, Akimoto C, Shibuya N, Minami E. EL5, a rice N‑acetylchitooligosaccharide elicitor‑responsive RING‑H2 finger protein, is a ubiquitin ligase which functions in vitro in co‑operation with an elicitor‑responsive ubiquitin‑conjugating enzyme, OsUBC5b. Plant J. 2010;30(4):447–55.
72. Katoh S, Tsunoda Y, Murata K, Minami E, Katoh E. Active site residues and amino acid specificity of the ubiquitin carrier protein‑binding RING‑H2 finger domain. J Biol Chem. 2005;280(49):41015.
73. Yoko N, Shizue K, Hanae K, Etsuko K. EL5 is involved in root devel‑ opment as an anti‑cell death ubiquitin ligase. Plant Signal Behav. 2008;3(2):148–50.
74. Zeng Z, Xiong F, Yu X, Gong X, Luo J, Jiang Y, Kuang H, Gao B, Niu X, Liu Y. Overexpression of a glyoxalase gene, OsGly I, improves abiotic stress tolerance and grain yield in rice (Oryza sativa L.). Plant Physiol Biochem. 2016;109:62–71.
75. Hao W, Yongyou Z, Shozo F, Tadao A, Jiayang L, Jianming L. Regulation of Arabidopsis brassinosteroid signaling by atypical basic helix‑loop‑helix proteins. Plant Cell. 2009;21(12):3781–91.
76. Zhu Z, Chen G, Guo X, Yin W, Yu X, Hu J, Hu Z. Overexpression of SlPRE2, an atypical bHLH transcription factor, affects plant morphology and fruit pigment accumulation in tomato. Sci Rep. 2017;7(1):5786.
77. Ogo Y, Itai RN, Nakanishi H, Kobayashi T, Takahashi M, Mori S, Nishizawa NK. The rice bHLH protein OsIRO2 is an essential regulator of the genes involved in Fe uptake under Fe‑deficient conditions. Plant J Cell Mol Biol. 2010;51(3):366–77.
78. Zhou J, Li F, Wang JL, Ma Y, Chong K, Xu YY. Basic helix‑loop‑helix tran‑ scription factor from wild rice (OrbHLH2) improves tolerance to salt‑ and osmotic stress in Arabidopsis. J Plant Physiol. 2009;166(12):1296–306. 79. Heang D, Sassa H. Antagonistic actions of HLH/bHLH proteins are
involved in grain length and weight in rice. PLoS ONE. 2012;7(2):e31325. 80. Liu B. Study on the characteristics of protein accumulation in rice grain. J
Southwest Agric Univ. 1992;14:66–9.
81. Lee TT, Wang MM, Hou RC, Chen LJ, Su RC, Wang CS, Tzen JT. Enhanced methionine and cysteine levels in transgenic rice seeds by the accumula‑ tion of sesame 2S albumin. J Agric Chem Soc Jpn. 2003;67(8):1699–705. 82. Nguyen HC, Hoefgen R, Hesse H. Improving the nutritive value of rice
seeds: elevation of cysteine and methionine contents in rice plants by ectopic expression of a bacterial serine acetyltransferase. J Exp Bot. 2012;63(16):5991–6001.
83. Zhang Y, Guo X, Du J, Zhao C. Review on characterization of maize phenotypic diversity: from genome and genotyping to phenomics and high‑throughput phenotyping. Res Crops. 2015;16(2):351.
84. Fiorani F, Schurr U. Future scenarios for plant phenotyping. Annu Rev Plant Biol. 2013;64(1):267.
85. Korte A, Farlow A. The advantages and limitations of trait analysis with GWAS: a review. Plant Methods. 2013;9(1):29.
Publisher’s Note