To Optimize Maximum Tensile Strength & Analysis of
Microstructure of FSW on Magnesium Alloy by
ANOVA Techniques
I
Krishan Kant,
IILalit Kumar,
IIIKanika Verma,
IVUmesh Gupta,
VNaveen Kumar
I,II,III,IV,VAssistant Prof. in Mechanical Engineering Department, Chandigarh University, Gahuran, Mohali
Introduction
Friction Stir Welding is a solid-state process, which means that the objects are joined before reaching the melting point.A good quality friction stir weld requires a proper tool material selection for the desired application. All friction stir tools contain features
desired for specific function. The tool material used for friction stir
welding should have following characteristics if the tool wear is excessive it changes the shape of the tool thus changing the weld quality and the probability of defects is also increased. During the friction stir welding process tool wear can occur by adhesive, abrasive or chemical wear mechanisms.
Tool fracture toughness plays a significant role during tool plunge and dwell. The local stresses and strain produced when the tool touches the work piece are sufficient to break a tool. Therefore
the material of the tool used for friction stir welding should have
high fracture toughness. The surface properties of the tool get
changed if the tool reacts with the work piece or the environment.
Titanium is well known for its reaction at elevated temperature
tool properties. Therefore material of the tool is selected in such
a way that it must not react with work piece or the environment in order to maintain its properties. If pin and shoulder material
has a large difference in coefficient of thermal expansion it leads
to either expansion of the shoulder relative to pin or expansion of pin relative to shoulder. In both of the situations there is an increase in the stresses between the pin and shoulder which can
lead to failure of the tool. Tools consist of a shoulder and a probe
which can be integral with the shoulder or as a separate insert
possibly of a different material. The design of the shoulder and of the probe is very important for the quality of the weld. The
probe of the tool generates the heat and stirs the material being welded but the shoulder also plays an important part by providing additional frictional treatment as well as preventing the plasticised material from escaping from the weld region..
Final Experimentation
After conducting the pilot experimentation it has been observed that input parameters like tool rotational speed, tool feed rate and
tool pin profiles have some significant effect on the mechanical
properties of the weld samples. For the optimization of process,
design of final experiments was made according to Taguchi’s L9
orthogonal array.
Abstract
In this paper, Friction Stir Welding is a solid-state process, which means that the objects are joined before reaching the melting point.A good quality friction stir weld requires a proper tool material selection for the desired application. After conducting the pilot
experimentation it has been observed that input parameters like tool rotational speed, tool feed rate and tool pin profiles have some significant effect on the mechanical properties of the weld samples. For the optimization of process, design of final experiments was
made according to Taguchi’s L9 orthogonal array. The S/N ratios available depending on type of characteristic: lower is better (LB), nominal is best (NB), larger is better (LB). Larger is better S/N ratio was used here. Analysis of variance (ANOVA) test was performed
to identify the average performance of process parameters that are statistically significant and The joining of magnesium alloy was successfully carried out using FSW technique. The samples were characterized by mechanical properties like tensile strength,
impact strength, Vicker hardness. The following conclusions were made from the present investigation. Observed that the speed is
500 R.P.M and Feed is 50 mm/min with a cylindrical threaded tool was best to maximize the tensile strength, The fine structure in the weld may be divided into three regions: fine re-crystallized grains around the weld centre, the grains in the base metal highly elongated and pancake shaped and grain having great deformation in TMAZ. Compared with the BM, very fine grains were present in the SZ, due to dynamic recrystalization.
Keyword
Taguchi’s L9 orthogonal array
SR. NO. TOOL
ROTATION WELDING SPEED TOOL PIN PROFILE
1 1 1 1
2 1 2 2
3 1 3 3
4 2 1 2
5 2 2 3
6 2 3 1
7 3 1 3
8 3 2 1
9 3 3 2
Tensile Test
Observation table for tensile test Sr.
No Tool rotation (RPM)
Welding Speed (mm/ min)
Tool pin
profile Tensile strength (TS) (MPa)
TS1 TS2 TS3
1 400 50 Taper
threaded 87.40 89.40 86.50
2 400 60 Cylindrical
threaded 148.90 147.28 145.36
3 400 70 Grooved
threaded 106.40 105.20 104.10
4 500 50 Cylindrical
threaded 172.10 169.17 170.40
5 500 60 Grooved
threaded 114.80 112.54 111.74
6 500 70 Taper
threaded 101.143 102.20 102.27
7 600 50 Grooved
threaded 118.85 117.93 119.13
8 600 60 Taper
threaded 141.9 143.01 142.02
9 600 70 Cylindrical
threaded 128.92 131.56 130.40
Results and Discussions
ANALYSIS OF TENSILE STRENGTH
S/N Ratio Analysis
The term “Signal” represents the desirable value (mean) for the output characteristics and the term “noise” represents the undesirable value for the output characteristic. The S/N ratio is uses to measure the quality characteristic deviating from the desired value in Taguchi method.
Experimental results for tensile strength, S/N ratios, mean ratio of FSW welds Sr. No. Tool rotational speed
(RPM) Tool feed rate (MM/MIN) Threaded tool pin profile Tensile strength S/N Ratio Mean ratio
1 400 50 Taper 87.8 38.87 87.77
2 400 60 Cylindrical 147.2 43.36 147.18
3 400 70 Grooved 105.2 40.44 105.23
4 500 50 Cylindrical 170.6 44.64 170.56
5 500 60 Grooved 113.0 41.06 113.03
6 500 70 Taper 101.9 40.16 101.87
7 600 50 Grooved 118.6 41.48 118.64
8 600 60 Taper 142.3 43.06 142.31
9 600 70 Cylindrical 130.3 42.30 130.29
From the above signal to noise ratios of each level of factor it is concluded that the optimum factor level to achieve Optimum tensile strength is 170.6 MPa which are having maximum s/n ratios and maximum mean ratio i.e. speed is 500 R.P.M and Feed is 50 mm/min with a cylindrical threaded tool
Response table for S/N ratio Larger is better
Level Tool rotational
speed (RPM) Tool feed rate (MM/MIN) Tool pin profile
1 40.89 41.66 43.43 2 41.95 42.50 41.00
3 42.28 40.97 40.70
DELTA 1.39 1.53 2.73
The S/N ratios available depending on type of characteristic: lower is better (LB), nominal is best (NB), larger is better (LB). Larger
is better S/N ratio was used here. From the delta values it assigns
the rank to each factor which are having more influence on the
mean of percentage of elongation, from the results of S/N ratio
also it is observed that tool pin profile is the dominant factor for
tensile behaviour. 600 500 400 43 42 41 70 60 50 Taper threaded Groov ed threaded
C y lindrical threaded
43
42
41
Tool rotation (RPM)
M ea n of S N ra ti os
Welding Speed (mm/min)
Tool pin profile
Main Effects Plot for SN ratios Data Means
Signal-to-noise: Larger is better
Main effects plot for S/N ratio
Based on the above graph, the optimum conditions for the tensile
strength are (a) 600 rpm speed (b) 60 mm/min feed (c) cylindrical threaded
Response table for mean Larger is better
Level
no Tool rotational speed(RPM) Tool feed rate (MM/MIN) Tool pin profile
1. 113.4 125.7 149.3
2. 128.5 134.2 112.3
3. 130.4 112.5 110.6
DELTA 17.0 21.7 38.7
RANK 3 2 1
From the delta values it assigns the rank to each factor which are
having more influence on the mean of % of elongation, from the results of mean ratio also it is observed that tool pin profile is the
dominant factor for tensile strength.
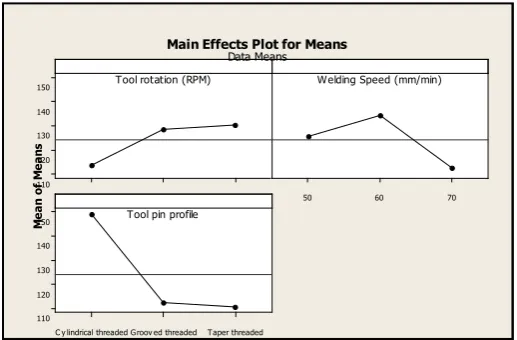
600 500 400 150 140 130 120 110 70 60 50 Taper threaded Groov ed threaded C y lindrical threaded
150
140
130
120
110
Tool rotation (RPM)
M ea n of M ea ns
Welding Speed (mm/min)
Tool pin profile
Main Effects Plot for Means Data Means
Fig 5.2 : Main effects plot for mean ratio
Based on the above graph, the optimum conditions for the tensile
threaded
5.1.2 Analysis Of Variance (ANOVA)
Analysis of variance (ANOVA) test was performed to identify the average performance of process parameters that are statistically
significant
Table 5.4 : One-way ANOVA: Tensile strength versus Tool
rotation
Source DOF SS MS F P
Tool rotation (rpm) 2 521 261 0.32 0.037
Error 6 4862 810
Total 8 5384
S=98.47 R-Sq. = 96.68% R-Sq. (adj.) = 95.97%
Table 5.5 : One-way ANOVA: Tensile strength versus Welding
speed
Source DOF SS MS F P
We l d i n g Speed(mm/ min)
2 59.4 29.7 0.46 0.04
Error 6 389.6 64.9
Total 8 449.0
S=98.058 R-Sq. = 93.22% R-Sq.(adj.)=96.54%
Table 5.6 : One-way ANOVA: Tensile strength versus Tool pin Profile
Source DOF SS MS F P
Tool pin
Profile 2 521 261 0.32 0.034
Error 6 4862 810
Total 8 5384
S=98.47 R-Sq. = 94.68% R-Sq. (adj.)=95.056%
DOF─Degrees of freedom,SS─Sequencial sum of squares,SS─Adjusted sum of square,MS─Adjusted mean square,SS’─Pure sum of squares, F─Fisher ratio, P─Probability that exceeds the 95 % confidence level. In addition, larger F-value
indicates the variation of process parameters makes big change
on performance. The Smaller p-value, P<0.05(1-0.95), greater the significance of the process parameter. The purpose of the ANOVA test is to investigate the significance of the process parameters which affect the tensile strength of FSW joints. The ANOVA
results for tensile strength v/s tool rotation, welding speed, tool
pin profile of means and S/N ratio are given in Tables 5.4, 5.5
and 5.6 respectively. In addition, the F-test named after Fisher
can also be used to determine which process has a significant effect on tensile strength. The results of ANOVA indicate that the considered tool pin profile are highly significant factors affecting
the tensile strength of FSW joints in the order of rotational speed, traverse speed.
Confirmation Experiment
value is 169.4 MPa.
5.4 Analysis of Microstructure Testing
Picral etchant was used to etch AZ 91 Mg alloy of the weld. A
solution of 1.5 g picric acid, 1.25 ml acetic acid, 2.5 ml distilled water,25 ml ethnol was used to bring out the lamellar-like shear
bands and fine microstructure in the intercalated weld zone. Shows
an overview of the cross-section of joint, and the microstructure in
the base metal (BM), thermo mechanically affected zone (TMAZ)
and stir zone (SZ) are shown in Figs. 8.1–8.9, respectively. The BM exhibits a typical solidification microstructure formed in the casting process. The grains in the TMAZ were greatly deformed
due to the friction heat and mechanical deformation, and the
grains have an obvious orientation along the metal-flow direction induced by stirring. The SZ contains fine recrystallized grains
Weld sample 9
Microstructure of fusion metal (100X)
After FSW, the microstructures of the SZ, consisting almost entirely of dynamically recrystallized Mg grains and intermetallic compounds, tend to disappear, due to their dissolution at elevated temperature.
Conclusion
The joining of magnesium alloy was successfully carried out using FSW technique. The samples were characterized by
mechanical properties like tensile strength, impact strength,
Vicker hardness. The following conclusions were made from the
present investigation
1. Observed that the tool pin profile having more influence
on the mean of tensile strength, impact strength, vicker Hardness.
2. Observed that the speed is 500 R.P.M and Feed is 50 mm/ min with a cylindrical threaded tool was best to maximize the tensile strength.
3. The fine structure in the weld may be divided into three regions: fine re-crystallized grains around the weld center, the
grains in the base metal highly elongated and pancake shaped
and grain having great deformation in TMAZ. Compared with the BM, very fine grains were present in the SZ, due to
dynamic recrystalization.
Rferences
Ahmadi H, Arab M.N.B, Ghasemi F.A, Farsani R.E (2012), [1].
“Influence of Pin Profile on Quality of Friction Stir Lap Welds
in Carbon Fiber Reinforced Polypropylene Composite”. International Journal of Mechanics and Applications, Vol.2, pp. 24-28.
Bahemmat P, Rahbari A, Haghpanahi M, Besharati M.K [2].
(2008), “Experimental Study on the Effect of Rotational
Speed and Tool Pin Profile on AA2024 Aluminium Friction
Stir Welded Butt Joints”. ASME Early Career Technical Conference, pp. 1.1-1.7.
Balamurugan K.G, Mahadevan K, Pushpanathan D.P [3].
(2012), “Investigations on the Effect of Tool Types on the Mechanical Properties of Friction Stir Processed AZ31B Magnesium Alloy”.Journal of Mechanical and Civil Engineering, Vol. 2, pp. 44-47.
Bilici M.K, (2012), “Effect of Tool Geometry on Friction Stir [4].
Spot Welding of Polypropylene Sheets.” Express Polymer Letters, Vol.6, pp. 805–813.
Bishnoia R.N, Saprab P.K, Bhambhu (2013),“Effect [5].
of Tool Pin Profile on Mechanical Properties of Single
and Double Sided Friction Stir Welded Aluminium Alloy AA19000.” International Journal of Current Engineering and Technology, Vol.3, pp.138-1341.
Choi D H, Ahn B.W, Lee C.Y, Yeon Y.M, Song K , Jung [6].
S.B (2010), “Effect of Pin Shapes on Joint Characteristics of Friction Stir Spot Welded AA5J32 Sheet Materials Transactions”. Vol. 51, pp. 1028- 1032.
Dalu S.G, Shete M. T (2013), “Effect of Various Process [7].
Parameters on Friction Stir Welded Joint a Review.” International Journal of Research in Engineering and Technology, Vol.2, pp.555-558.
Ding R.J, Athens, Oelgoetz P.A, Huntsville (1998),
“Auto-[8].
Adjustable Pin Tool for Friction Stir Welding”. United States Patent, patent number 5,893,507, pp.1-7.
Devana R.J, Anilkumar S.H, Biju S (2015),“Numerical [9].
studies on effect of welding tool geometry and welding force on friction stir welding of AL2221.”pp. 1-9.
Elangovan K, Balasubramanian V, Valliappan M (2008), [10].
“Influences of tool pin profile and axial force on the formation of friction stir processing zone in AA6061 aluminum alloy”.