InTrans Project Reports Institute for Transportation
11-2014
Guidance for Improving Foundation Layers to
Increase Pavement Performance on Local Roads
Jerod Gross
Snyder & Associates, [email protected]
Dale Harrington
Snyder & Associates, [email protected]
Paul Wiegand
Iowa State University, [email protected]
E. Thomas Cackler
Iowa State University, [email protected]
Follow this and additional works at:http://lib.dr.iastate.edu/intrans_reports Part of theCivil Engineering Commons
This Report is brought to you for free and open access by the Institute for Transportation at Iowa State University Digital Repository. It has been accepted for inclusion in InTrans Project Reports by an authorized administrator of Iowa State University Digital Repository. For more information, please [email protected].
Recommended Citation
Gross, Jerod; Harrington, Dale; Wiegand, Paul; and Cackler, E. Thomas, "Guidance for Improving Foundation Layers to Increase Pavement Performance on Local Roads" (2014).InTrans Project Reports. 78.
Guidance for Improving Foundation Layers to Increase Pavement
Performance on Local Roads
Abstract
This document is the second of two deliverables for the project Optimizing Pavement Base, Subbase, and Subgrade Layers for Cost and Performance on Local Roads (TR-640). The first deliverable is the 454-page Final Field Data Report. The field data report describes test results and comparative analysis from 16 different portland cement concrete (PCC) pavement sites on local city and county roads in Iowa. At each site the surface conditions of the pavement (i.e., crack survey) and foundation layer strength, stiffness, and hydraulic conductivity properties were documented. The field test results were used to calculate in situ parameters used in pavement design methodologies for AASHTO (1993) and Iowa’s Statewide Urban Design and
Specifications (SUDAS). Overall, the results of the study demonstrate how in situ and lab testing can be used to assess the support conditions and design values for pavement foundation layers and how the measurements compare to the assumed design values. This guide summarizes the study results and outlines general
guidelines for applying them to optimize pavement bases, subbases, and subgrade layers of local roads with PCC pavements and thus their performance.
Keywords
Base course (Pavements), Pavement layers, Pavement performance, Portland cement concrete, Public roads, Subbase (Pavements), Subgrade (Pavements), PCC
Disciplines
Civil Engineering
Comments
Guidance for Improving Foundation
Layers to Increase Pavement
Performance on Local Roads
NOVEMBER 2014
Sponsored by
About the National Concrete Pavement Technology Center
The mission of the National Concrete Pavement Technology (National CP Tech) Center is to unite key transportation stakeholders around the central goal of advancing concrete pavement technology through research, tech transfer, and technology implementation.
Disclaimer Notice
The contents of this report reflect the views of the authors, who are responsible for the facts and the accuracy of the information presented herein. The opinions, findings and conclusions expressed in this publication are those of the authors and not necessarily those of the sponsors.
The sponsors assume no liability for the contents or use of the information contained in this document. This report does not constitute a standard, specification, or regulation.
The sponsors do not endorse products or manufacturers. Trademarks or manufacturers’ names appear in this report only because they are considered essential to the objective of the document.
ISU Non-Discrimination Statement
Iowa State University does not discriminate on the basis of race, color, age, ethnicity, religion, national origin, pregnancy, sexual orientation, gender identity, genetic information, sex, marital status, disability, or status as a U.S. veteran. Inquiries regarding non-discrimination policies may be directed to Office of Equal Opportunity, Title IX/ADA Coordinator, and Affirmative Action Officer, 3350 Beardshear Hall, Ames, Iowa 50011, 515-294-7612, email [email protected].
Iowa Department of Transportation Statements
Federal and state laws prohibit employment and/or public accommodation discrimination on the basis of age, color, creed, disability, gender identity, national origin, pregnancy, race, religion, sex, sexual orientation or veteran’s status. If you believe you have been discriminated against, please contact the Iowa Civil Rights Commission at 800-457-4416 or the Iowa Department of Transportation affirmative action officer. If you need accommodations because of a disability to access the Iowa Department of Transportation’s services, contact the agency’s affirmative action officer at 800-262-0003.
The preparation of this report was financed in part through funds provided by the Iowa Department of Transportation through its “Second Revised Agreement for the Management of Research Conducted by Iowa State University for the Iowa Department of Transportation” and its amendments.
Technical Report Documentation Page
1. Report No. 2. Government Accession No. 3. Recipient’s Catalog No. IHRB Project TR-640
4. Title and Subtitle 5. Report Date
Guidance for Improving Foundation Layers to Increase Pavement Performance on Local Roads
November 2014
6. Performing Organization Code
7. Author(s) 8. Performing Organization Report No.
Jerod Gross, Dale Harrington, Paul Wiegand, Tom Cackler InTrans Project 11-422 9. Performing Organization Name and Address 10. Work Unit No. (TRAIS) National Concrete Pavement Technology Center
2711 S. Loop Drive, Suite 4700 Ames, IA 50010-8664
11. Contract or Grant No.
12. Sponsoring Organization Name and Address 13. Type of Report and Period Covered Iowa Highway Research Board
Iowa Department of Transportation 800 Lincoln Way
Ames, IA 50010
Guide
14. Sponsoring Agency Code IHRB Project TR-640
15. Supplementary Notes
Visit www.cptechcenter.org for PDFs of this and other research-related publications 16. Abstract
This document is the second of two deliverables for the project Optimizing Pavement Base, Subbase, and Subgrade Layers for Cost and Performance on Local Roads (TR-640). The first deliverable is the 454-page Final Field Data Report. The field data report describes test results and comparative analysis from 16 different portland cement concrete (PCC) pavement sites on local city and county roads in Iowa. At each site the surface conditions of the pavement (i.e., crack survey) and
foundation layer strength, stiffness, and hydraulic conductivity properties were documented. The field test results were used to calculate in situ parameters used in pavement design methodologies for AASHTO (1993) and Iowa’s Statewide Urban Design and Specifications (SUDAS). Overall, the results of the study demonstrate how in situ and lab testing can be used to assess the support conditions and design values for pavement foundation layers and how the measurements compare to the assumed design values. This guide summarizes the study results and outlines general guidelines for applying them to optimize pavement bases, subbases, and subgrade layers of local roads with PCC pavements and thus their performance.
17. Key Words 18. Distribution Statement
local roads—optimizing foundation layers—pavement base—pavement subbase—pavement subgrade—PCC pavements
No restrictions
19. Security Classification (of this report)
20. Security Classification (of this page)
21. No. of Pages 22. Price
Unclassified. Unclassified. 43 pages N/A
Jerod Gross, Snyder & Associates, Inc.
Dale Harrington, Snyder & Associates, Inc.
Tom Cackler, National Concrete Pavement Technology Center, Iowa State University Paul Wiegand, Iowa Statewide Urban Design and Specifications, Iowa State University
Gordon Smith, Iowa Concrete Paving Association John Cunningham, Iowa Concrete Paving Association
Melisse Leopold
Sharon Prochnow, National Concrete Pavement Technology Center, Iowa State University Marcia Brink, National Concrete Pavement Technology Center, Iowa State University
Iowa Department of Transportation and Iowa Highway Research Board
(IHRB Project TR-640)
Preparation of this document was financed in part
through funds provided by the Iowa Department of Transportation through its Research Management agreement with the
The National Concrete Pavement Technology Center (CP Tech Center) and the authors wish to thank the Iowa Department of Transportation and the Iowa Highway Research Board (TR-640) for their support of this project. In addition, we appreciate the knowledgeable experts, both public and private, who served on the technical advisory committee for this guide. The
committee consists of the following people: Bob Schiesl, City of Dubuque, Iowa Chris Brakke, Iowa Department of
Transportation
Ed Bartels, Johnson County, Iowa
Greg Reeder, City of Council Bluffs, Iowa Jack Moellering, Pocahontas County, Iowa Mark Dunn, Iowa Department of Transportation Mark Rahm, City of Mason City, Iowa
Paul Moritz, City of Ankeny, Iowa
Jerry Long, French-Reneker Associates, Inc. Steve Hausner, French-Reneker Associates, Inc.
In addition, we thank the following entities for their roles in and support of the development of this guide:
City of Ankeny, Iowa City of Ames, Iowa City of Knoxville, Iowa City of Council Bluffs, Iowa City of Burlington, Iowa Story County, Iowa Winneshiek County, Iowa
Center for Earthworks Engineering Research, Iowa State University
The mission of the National Concrete Pavement Technology Center is to unite key transportation stakeholders around the central goal of
advancing concrete pavement technology through research, technology transfer, and technology implementation.
This publication is intended solely for use by professional personnel who are competent to evaluate the significance and limitations of the information provided herein and who will accept total responsibility for the application of this information. Any opinions, findings, and conclusions or recommendations expressed in this material do not necessarily reflect the views of Iowa State University.
Iowa State University and the authors, editors, designers, and illustrators make no
representations or warranties, expressed or implied, as to the accuracy of any information herein and disclaim liability for any
inaccuracies.
Neither Iowa State University nor the authors endorse products or manufacturers. Trade or manufacturers’ names appear herein solely because they are considered essential to the objective of this document.
Iowa State University does not discriminate on the basis of race, color, age, ethnicity, religion, national origin, pregnancy, sexual orientation, gender identity, genetic information, sex, marital status, disability, or status as a U.S. veteran. Inquiries can be directed to the Director of the Office of Equal Opportunity, 3350 Beardshear Hall, 515-294-7612.
Tom Cackler, Director Marcia Brink, Senior Editor
National Concrete Pavement Technology Center Iowa State University Research Park
2711 S. Loop Drive, Suite 4700 Ames, IA 50010-8664
515-294-9480
PROJECT OBJECTIVES ... 1
INTRODUCTION ... 1
WHAT WAS UNDERSTOOD BEFORE THE IHRB TR-640 STUDY ... 2
Subgrade Soils ... 2
Subgrade Soil Key Factors... 2
Stabilized Subgrades ... 3
Unstabilized Aggregate Subbases ... 5
Subdrains... 7
Measuring Pavement Performance ... 7
Pavement Thickness Design ... 8
WHAT WAS LEARNED FROM THE IHRB TR-640 STUDY ... 9
Test Sites ... 9
Testing Data ... 11
Test Results ... 11
Pavement Performance ... 12
Aggregate Subbases Thickness Impact on kc (Modulus of Subgrade Reaction) ... 12
CBR and Subgrade Weak Zones Impact Modulus of Subgrade Reaction ... 12
Pavement Performance - Pavement Condition Index ... 15
PCI Prediction Model ... 15
Summary of TR-640 Testing ... 17
GUIDANCE FOR IMPROVING PCC PAVEMENT PERFORMANCE ... 19
Geotechnical Investigation... 19
Pre-Design Testing Options to Characterize Foundation Layers ... 21
Foundation Treatment ... 22
Treatment Options ... 22
Dry Out the Subgrade ... 22
Blend the Soils ... 23
Stabilize with Macadam Stone... 23
Remove Unsuitable Soils and Replace with Select Fill ... 23
Construction Testing ... 23
Benefits of Aggregate Subbase and a Drainage System ... 23
Aggregate Subbase Thickness ... 24
Separation Barrier Using Geotextiles ... 25
Non-woven Geotextiles ... 27
Woven Geotextiles ... 28
Cost Comparison ... 28
Quality Assurance ... 29
Increased Performance ... 29
Increased Reliability ... 31
SUMMARY ... 32
AREAS OF FUTURE STUDY ... 36
IMPLEMENTATION PLAN ... 36
Figure 1. Subgrade reaction ... 2
Figure 2. Cement slurry application ... 3
Figure 3. Rectangular geogrid placed in Boone County, Iowa ... 4
Figure 4. Woven geotextile placed in Boone County, Iowa ... 5
Figure 5. Unstabilized aggregate subbase ... 5
Figure 6. Rural subdrain outlet ... 7
Figure 7. Clogged subdrain outlet ... 7
Figure 8. Urban subdrain outlet ... 7
Figure 9. PCI rating scale ... 8
Figure 10. Permeability test ... 9
Figure 11. IHRB TR-640 test sites ... 10
Figure 12. kc vs. Subbase thickness ... 13
Figure 13. CBR profile ... 13
Figure 14. IHRB TR-640 CBR and k values ... 14
Figure 15. PCI vs. Age, IHRB TR-640 test sites ... 15
Figure 16. PCI prediction model equation ... 16
Figure 17. PCI prediction model ... 16
Figure 18. IHRB TR-640 multivariate analysis (IHRB TR-640 Field Data Report)... 17
Figure 19. Sample soil boring log ... 20
Figure 20. Drilling prior to DCP test ... 21
Figure 21. CHP test ... 21
Figure 22. IRI failure mode from Pavement ME Design ... 24
Figure 23. Cracking failure mode from Pavement ME Design ... 24
Figure 24. Moist subgrade conditions ... 25
Figure 25. Migration of fines into aggregate subbase... 27
Figure 26. Non-woven geotextile ... 27
Figure 27. Woven geotextile ... 28
Figure 28. Typical section with aggregate subbase and geotextile separation ... 28
Figure 29. PCI vs. age 500 AADT (PCI prediction model) ... 30
Figure 30. PCI vs. age 1000 AADT (PCI prediction model) ... 30
Figure 31. Increased Cd results in increased performance (from linear PCI prediction model) ... 31
Figure 32. Pavement performance curve with improved foundation layers ... 35
Table 1. Unstabilized Aggregate Subbase Gradations ... 6
Table 2. PCC Design Parameters ... 10
Table 3. TR-640 Test Site Data ... 11
Table 4. Testing Options to Characterize Foundation Layers ... 21
The purpose of the Iowa Highway Research Board-sponsored research project TR-640 was to better understand how to optimize local pavement foundation support layers in order to
understand pavement performance. The project consisted of a field study and the development of a user guide based on the information from the field study. Although the study focused on
concrete pavements, the findings and conclusions apply also to asphalt pavements—perhaps even more so, since asphalt pavements depend on a strong subbase system. The site field research and design options covered in this study are for concrete pavements.
The project’s objectives were to do the following:
1. Determine the level of increased performance when Portland Cement Concrete
(PCC) is placed on granular subbase or treated subgrade and quantify the performance and cost effectiveness. Field data was collected on 16 existing PCC pavements to measure in situ foundation parameters and compare them to design assumptions. The 16 Iowa sites, ranging in age from 1 to 42 years, were tested using a falling weight deflectometer, dynamic cone penetrometer, along with permeability testing, physical sampling and pavement condition assessments. The TR-640 field study was completed in May 2014 by the Center for Earthworks Engineering with assistance from the National Concrete Pavement Technology Center, both located at the Institute for Transportation at Iowa State University.
2. Develop a user guide for various traffic, soils and pavement factors for optimized performance and financial benefits. This user guide, utilizing the information from the TR-640 field study, was developed to fulfill the second objective of TR-640.
It is common for local street and highway pavements to be constructed from PCCsupported on a natural subgrade without considering or using a subgrade stabilized treatment or support layer such as an aggregate subbase. When support layers are considered, they typically serve as a construction platform and improve the level of stability and uniformity for the pavement foundation which can result in increased performance and thus increased pavement life. An aggregate subbase can also improve the drainage under the pavement, minimizing the deterioration caused by water entrapment. The question is how much do they benefit the pavement and is the benefit worth the costs, particularly if the pavement is meeting the design life.
To find answers, field research was conducted on 16 local road sites across the state of Iowa to better understand the effects of aggregate subbases. Before recommendations could be
Flexible Pavement Rigid Pavement
The pavement design life for local roadways (not including heavily traveled arterials or trunk highways) is normally based on the pavement thickness and less concern is typically given to the support system. Unless there are material related distress failures in concrete pavement (ie. freeze-thaw damage, ASR, D-cracking) the normal mode of failure is the vertical distortions of the pavement surface from subgrade movement. The degradation is normally faulting, slab movement, joint failures, cracking, etc. and is represented by the dropping of the pavement condition index (PCI).
Concrete pavement is relied upon for its durability and strength. In order for a concrete pavement to provide long term performance, its foundation needs to have uniform support. Typically in Iowa, the foundation includes the natural subgrade and in some instances, an aggregate subbase. If the pavement is placed directly on the natural subgrade, preparation is needed to provide uniformity. At a minimum this includes, topsoil removal, scarification of the underlying subgrade to a depth of one foot and compaction to a specified depth, density and moisture content. For additional information see Statewide Urban Design and Specifications (SUDAS) Design Manual Chapter 6.
When constructing any pavement (rigid or flexible) on natural subgrade that is subject to poor drainage and/or has poor soils, there will likely be measurable soil breakdown and movement due to freeze-thaw conditions and/or traffic loading.
The need to stabilize subgrades is primarily due to excessive moisture in the subgrade itself. High moisture in soils may be encountered during construction for reasons ranging from a naturally high water table to seasonal rainfall and even to changes in drainage conditions during construction. Regardless of the cause, in situ wet soils must be addressed before constructing an aggregate subbase or placement of the pavement on the subgrade. Placing subdrains before construction or letting the soil dry out through a natural process is not normally a practical approach because of time constraints. The two most commonly used methods are chemical modification of the soils, particularly in high moisture conditions, and reinforcement/separation.
A stabilized subgrade such as soil cement or fly ash stabilization will help to dry out excessive moisture soils and develop the uniformity needed to provide a construction platform and reduce delays during construction. When using chemical stabilizers, such as cement or fly ash, the percent of the stabilizer needs to be stipulated when the water content, soil type and freeze- thaw performance are considered. Recent research on the use of fly ash at the Boone County Expo is available for reference in the May 2013 Tech Brief entitled “Fly Ash Stabilization of Subgrade.”
Cement Modified Soils. Cement Modified Soils (CMS) are soils and/or manufactured aggregates mixed with a small portion of Portland Cement. CMS are normally used to improve material properties in the subgrade. Also, CMS helps prevent migration of subgrade soil and water into the aggregate subbase and provides some additional strength to the subgrade. CMS are principally used to modify fine grained soils such as silts and clays having high plasticity
content. Some specifications require enough cement content to reduce the Plastic Index (PI) within a range of 12 to 15. Typically a CMS amount equivalent to 3 to 5 percent of the soil’s dry weight is incorporated into the mix to achieve the desired strength.
Fly Ash. A successful chemical stabilization can be achieved by incorporating approximately 10 to 15 percent fly ash (measured by dry weight of the native soil) into the existing subgrade. Fly ash can improve the subgrade CBR from 2 to 3 to as much as 25 to 30. It can also improve the unconfined compressive strength from 50 psi to 400 psi. Fly ash stabilized subgrades can also reduce the shrink-swell potential of clay soils and upgrade the condition of marginal soils. It is also a good drying agent for wet soils and provides a working platform during construction.
Reinforced subgrade treatment is typically used when subgrades have an unstable (soft) but not an extremely high moisture content. This may be accomplished through the use of geosynthetics such as geogrids and woven geotextiles.
Geogrid. Geogrid reinforcement of aggregate subbases can help prevent localized shear failure of the subgrade and therefore increase its effective bearing capacity. In addition, geogrids reinforce the granular fill through confinement of the particles, stiffening the base layer for improved load distribution. Figure 3 shows a rectangular geogrid placed at the interface of subgrade and limestone subbase layers in Boone County, Iowa.
Suppliers of geogrids should be contacted to assist in determining in situ soil moisture limits for the use of a geogrid. Under measurable wet conditions of the subgrade, a geogrid may not
Geotextiles. Woven geotextiles also help reduce localized shear failure of the subgrade through increased tensile strength and therefore increased bearing capacity. Woven geotextiles have higher tensile strength than nonwoven geotextiles and with smaller openings (less
[image:15.612.197.409.169.326.2]drainable) serve as an excellent separation layer between the subgrade and aggregate subbase. Figure 4 shows a woven geotextile placed at the interface of the subgrade and limestone subbase layer in Boone County, Iowa.
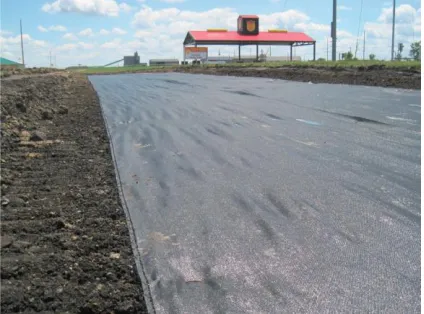
Unstabilized aggregate subbases are appropriate when a stable and uniform construction platform will benefit construction. (ACPA 2007) An aggregate subbase support layer can
provide a working platform during construction as well as provide uniformity as a support layer. A granular support layer will also serve as a drainage system to help drain surface water away from the pavement as well as provide a cutoff layer from subsurface moisture. If an aggregate subbase is used, a subdrain and outlet will be needed to complete the drainage system due to the poor drainage properties of Iowa soils. Figure 5 illustrates the compaction of an unstabilized aggregate subbase.
The preferred unstabilized aggregate subbase materials should meet the requirements of
Maximum particle size of no more than one third the subbase thickness*
Less than 15 percent passing through the number 200 sieve
Plasticity index of 6 or less
Liquid limit of 25 or less
Los Angeles abrasion resistance of 50 percent or less
Target permeability of about 150 ft/day, but no more than 350 ft/day in laboratory tests *Macadam stone may not meet the 1/3 aggregate subbase thickness criteria. Note that a 1 to
1½ inch aggregate choke layer is often placed on top of the macadam stone to provide stability.
Commonly used Iowa DOT aggregate subbase materials include modified subbase, granular subbase and special backfill. Table 1 lists the gradation for each of these aggregate subbases as compared to Class A crushed stone along with their relative permeability and stability. Class A crushed stone is not considered a drainable base due to the amount of fines (material passing the number 200 sieve). The Iowa DOT specifications for modified subbase and special backfill allow for crushed stone, gravels, and recycled pavement materials meeting material IM210 or
uniformly blended combinations of these materials with a maximum of 50 percent RAP (Reclaimed Asphalt Pavement).
Percent Passing
Sieve
Class A Crushed Stone (Iowa DOT Gradation 11) Special Backfill (Iowa DOT Gradation 29) Modified Subbase (Iowa DOT Gradation 14) Granular Subbase (Iowa DOT Gradation 12a)
1½″ 100 100 100
1.0″ 100
¾″ 95–100 70–90
½″ 70–90
⅜″ 40–80
# 4 30–55
# 8 15–40 10–40 10–40 5–25
# 200 6–16 0–10 3–10 0–6
Permeability Low Low to Moderate Moderate High
Stability High Moderate Moderate Low
The target permeability of approximately 150 feet per day provides the adequate drainage necessary for a pavement foundation layer. Although materials as coarse and open-graded as ASTM No. 57 stone have been used as draining layers, they are not recommended for concrete pavements due to their lack of adequate stability for construction operations and their
It is known that drainage is also important to the long term performance of concrete pavement. Drainage can be achieved with the use of an aggregate subbase with subdrain outlets. It is important to prepare the natural subgrade prior to the placement of the aggregate subbase to achieve the best performance.
When specifying the subdrain material it is very important to select a product that is durable. Consideration should be given to the use of a rigid plastic pipe. A rigid pipe should perform better than a flexible plastic pipe when subject to loading from construction equipment. Flexible, lightweight subdrain has been known to be crushed under normal construction traffic and thereby jeopardizing the entire function of the drainage system.
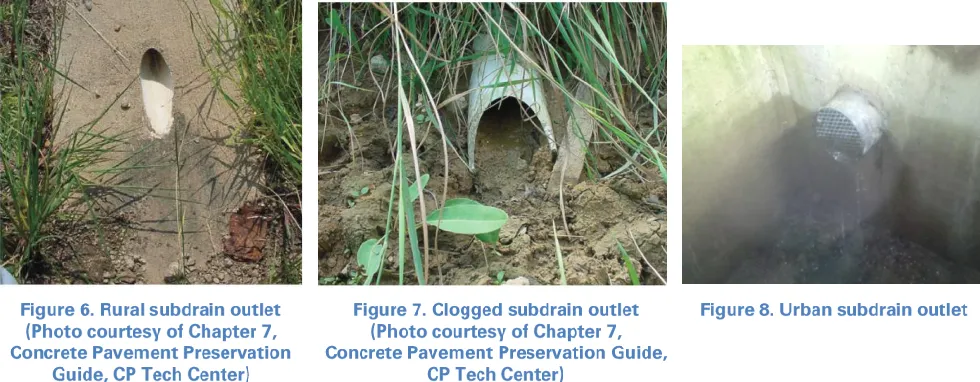
[image:17.612.76.566.329.520.2]In addition, proper maintenance of the subdrain system is imperative. It is important that the owner of the pavement pay attention to the performance of the subdrain over the life of the pavement. Subdrains should be reviewed and cleaned periodically to ensure proper performance. Figure 6 shows a proper rural subdrain outlet. Figure 7 shows a rural subdrain outlet that has become clogged and is no longer functional. Figure 8 shows a properly installed urban subdrain outlet in a storm intake structure that is properly functioning.
It is typical and current practice to use a pre-determined minimum pavement thickness for local roads. These minimum thicknesses are typically 6 or 7 inches.
Some current thickness design methodologies were developed for facilities with more traffic and may not be applicable for local roads with lower traffic volumes.
Because local roads do not carry significant levels of heavy traffic and because some thickness design methodologies revert to predetermined minimums, modifying the design parameters for improved foundations with geotextiles and aggregate subbases will not decrease the thickness design significantly.
On low traffic local roadways, including residential streets, the aggregate subbase is not needed to increase the structural capacity of the slab, but the benefit is a uniform
construction platform and base to improve the serviceability over time.
The purpose of the Iowa Highway Research Board TR-640 project was to better understand how to optimize concrete pavement foundation support layers on local roads. A field data report that summarizes in situ testing and analysis from 16 existing concrete pavement sites in Iowa and the summary section of this guide provides recommendations that were developed from this
research.
The study was needed to measure actual pavement design parameter values to determine if they were being met during construction and several years after construction. In addition, a measure of performance was needed on local roads to compare pavements placed on a natural subgrade against those placed on an aggregate subbase or other improved foundation such as geosythetics or subgrade stabilization. Figure 10 shows a permeability test on the support layers.
The study would then show if improved foundation layers over time provided better performance with better serviceability, good rideability and less maintenance. The tested parameter values for the good pavements would be compared with those of pavements that did not perform as well.
[image:19.612.219.386.320.447.2]To meet this objective, 16 existing Iowa PCC pavements at 15 different sites with ages ranging from less than 1 year to 42 years old were tested to measure in situ foundation parameters as a link to design assumptions. Figure 11 shows the map of Iowa with the test sites shown in red. The shaded counties are representative of the cities and counties that responded to the initial questionnaire. Field testing involved falling weight deflectometer, dynamic cone penetration, permeability, physical sampling, and pavement condition assessments.
Abbreviation Parameter
CBR California bearing ratio
CBRSG California bearing ratio of subgrade (averaged over the top 12 in. of subgrade)
CBRSG-Weak California bearing ratio of subgrade (averaged over a minimum 3 in. “weak” layer within the top 16 in. of subgrade)
DCP Dynamic cone penetrometer
ESB Elastic modulus of subbase determined from CBRSB
FWD Falling weight deflectometer
k Modulus of subgrade reaction
kFWD Modulus of subgrade reaction determined from FWD test
kcomp Composite modulus of subgrade reaction (determined based on Mr, ESB, and H)
kcomp-DCP Composite modulus of subgrade reaction (determined based on Mr estimated from CBRSG, ESB estimated from CBRSB, and H)
kcomp-DCP-Weak Composite modulus of subgrade reaction (determined based on Mr estimated from CBRSG-Weak, ESB estimated from CBRSB, and H)
kcomp-FWD-Corr Static modulus of subgrade reaction determined from FWD test that is corrected for slab size and converted to composite value based on Mr estimated from Static kFWD-Corr, ESB estimated from CBRSB, and H
LS Loss of support
Mr Resilient modulus of subgrade
The testing collected various information including age, current traffic, thickness, subgrade and aggregate subbase type, California Bearing Ratio (CBR), modulus of subgrade reaction (k) & composite modulus of subgrade reaction (kc), Coefficient of Drainage (Cd), and Loss of Support
(LS). Table 3 lists this information from the test sites. The test methods and approach for data analysis are discussed in the field report.
The results of the testing found that the pavement foundation conditions were generally variable between projects and non-uniform over the length of a given pavement evaluation section. Engineering analysis generally showed that the in situ modulus of subgrade reaction and
Site Location Year Constructed Traffic (ADT) Traffic (ADTT) PCC
Thickness Subgrade Subbase
Measured Subgrade CBR Measured Subbase CBR Calculated Static kc
(FWD)
Calculated Cd
(min.) LOS (Avg)
NW Greenwood & 3rd St.
Ankeny 1989 2000 30 8.5 A-2-6 none 5.9 - 39 0.71 1.8
NW Greenwood & 5th St.
Ankeny 1976 2000 30 8.3 A-7-6 none 1.5 - 33 0.71 1.0
E63 Story Co. 1990 1040 52 8 A-4 & A-7-6 none 9.9 - 53 0.77 1.6
175th St. Winneshiek Co. 1970 560 16.8 6 A-4 none 6.8 - 51 0.83 1.6
E23 Story Co. 1986 150 7.5 6.8 A-6 none 11 - 66 0.78 1.8
9th Ave. Council Bluffs 1989 7600 380 7.75
A-5 to
A-7-5, fly ash (1" sand) 8.8 - 29 0.7 1.9
Averages 7.6 7.32 45 0.75 1.6
Site Location Year Constructed Traffic (ADT) Traffic (ADTT) PCC
Thickness Subgrade Subbase
Measured Subgrade CBR Measured Subbase CBR Software Static kc
(FWD)
Calculated Cd
(min.) LOS (Avg)
Riverside Rd, Story Co. 1994 2910 582 11
-6"
limestone 20 78 73 0.88 1.3
SW Westlawn Ankeny 2008 1000 10 7.3
A-6, woven fabric
8.5" - 10"
limestone 11, 1.9 64, 54 38,25 0.84 1.3
SW Logan Ankeny 2012 500 5 7.5 A-4 , fly ash
3.5"
limestone 34 60 56 0.72 1.8
W. Main Knoxville 2007 500 15 7 fly ash
12"
limestone 11 46 52 0.71 1.2
S. 5th
Knoxville 2009 680 13.6 8 fly ash
12"
limestone 26 39 104 0.71 1.1
Valley View Dr. Council
Bluffs 1997 8900 712 9 A-6 to A-4
6"
limestone 24 122 74 0.7 1.5
Cliff Rd. A Burlington 1993 1120 56 6.5 A-4
5"
limestone 8.2 20 65 0.73 1.2
Cliff Rd B Burlington 1993 1120 56 7.5 A-7-6
4.5"
limestone 8.7 20 38 0.92 1.8
Meadowbrook Burlington 1994 300 4.5 6.5 A-6
4"
limestone 7.3 22 91 0.94 1.0
W38 Winneshiek Co. 1996 600 36 7
-12"
limestone 56 111 111 0.8 1.0
Averages 5 19 58 73.8 0.8 1.3
SITES WITH PAVEMENT ON SUBGRADE
drainage coefficient (Cd) were variable and lower than typically assumed in design. Analysis of
the Loss of Support (LS) values showed that the field values were higher than suggested in SUDAS design manual but were within range of the AASHTO (1993) design guidelines. These findings suggest that the field conditions do not always match the design values and that
foundation layers are not being designed or tested to ensure optimum performance.
Although field results showed that in situ parameter values were lower on the average than the assumed design values, some pavement sections showed satisfactory performance based on PCI. PCI predictions as a function of pavement age, however, showed that reliably predicting
performance is difficult (PCI error = ±12) for the range of pavements sections evaluated. More advanced statistical analysis were used to identify the link between PCI and foundation support values and drainage conditions. Findings from the advanced analysis support the concept that quality pavement foundation conditions and proper testing have the potential to improve long term performance while improving reliability in PCI predictions.
The TR-640 research data found that, on average, the composite modulus of subgrade reaction (kc) values increased with increasing aggregate subbase layer thickness. Figure 12 illustrates the
kc values of the test sites. The red data points represent the test sections without aggregate
subbase and the blue data points represent the test sections with aggregate subbase. The test sections include aggregate subbase layer thickness varying from 0 to 12 inches. Understandably, the kc values were higher for the test sites with aggregate subbase. Thicker aggregate subbase
layers are successful over the design life because they allow for the migration of soil into only a portion of the aggregate subbase without losing all of the aggregate subbase.
The TR-640 field study research showed that a majority of the soils had a “weak” layer in the subgrade at depths varying from 6 to18 inches below the pavement and/or subbase layer. An analysis was performed that calculated the CBRSG and the CBRSG-Weak based on DCP testing.
The CBRSG was calculated as the average CBR in the top 12 inches of the subgrade. The CBR SG-Weak was calculated as the average CBR of the subgrade within a minimum 3 inch thick layer
within the top 16 inches of subgrade. Figure 13 (from IHRB TR-640 field study) illustrates the “weak” zone within a typical CBR profile as well as the average CBRSG.
Examination of each of the CBR profiles showed that the weak layer in the subgrade did have an impact on the k values as determined by the DCP tests. A low CBRSG-Weak corresponds to a lower
k value and a higher CBRSG-weak value corresponds to a higher k value. This is illustrated in
k & CBR Relationship
1000
~ 667
~ "T1 iJ cQ. Q, c :i'
...
100 (1)....
~ i :II C::J -1 :II a, .jlo, 0 (') C::J :II I» ::I c.. ;;-< 10 e!.. c (1)!
V> 0:: cc u~
~
-~
/I~
--
I
'"'/
\
J,-6I
""'
-
~
/
...
"
\kL
~2
"'"
~
!
'\
i
""
....
- - - 1 · -1-- /
/ /
/_ ~ l74 /_
...,....ot ~ / \. ~ '\. /
n(
""'
~
~ 56 \ / '\. 5 )/
/
\ /
\.
/
/
~
~
I
I
·
~
~
"\.
/
38~
I
I
34
- k Values
:
;
.
~
-
~ ~5 - /26---
--r----i--
---
--I
.
--
--.
-
24 •'"'"--
-
-I
---~..-r-~~ -
--I
CBR ValuesI
'
I
\
I
/
1
\
\
I
/
- - 11
11 11.3
- -_ ____,_!_ ...
~ 8:8-
f
- \
::;;;;;! Fa;. _,
F/
-"
8~ l.6 \ \I ZJ ~ . / rlJ \ \ I ~ 1.7
I '\. CO.i
I \ \ I /
5:9
II \. I \ \ I /
~
~S.1 .L-II
\.
I"-.
/
"-.
I
\
\
I
4.6111
56
+ kcocPWeak
+ static kFWD
+ CBRso
16
"*'
CBR SG-Weak- - Division Line
_
\
I
I
~.6I
... ~/
... 3.6_
\
_
\
L
l_
-
-~
II
\
I
... 2.7"
\
1
/
I
0
\
I
\
v
1.4
In reference to Figure 9, the Pavement Condition Index (PCI) was determined for the pavement at each test site. The PCI from the IHRB TR-640 research shows that pavements with an
aggregate subbase are performing better than those placed on natural subgrade. The PCI vs. Age graph in Figure 15 shows the majority of the test sites with aggregate subbase have a better level of service based on the higher PCI values.
Although the sample size is small (16 sites), it does reflect the increase in PCI when an aggregate subbase is used. The blue and red dashed lines represent the linear trend lines of the 16 test sites. The solid red line is a linear trend line of the subgrade PCI using data from other pavements previously studied. The linear trend lines and their equations were established using Microsoft Excel software.
Highways. The figure shows that although the PCI of the TR-640 data is more variable, the general trend of values falls in line with the 2008 study.
From the model, two important conclusions can be drawn. First, the coefficient of drainage (Cd)
subbase, it will have the potential for a higher PCI. This is based on the “a” variable in the formula.
The TR-640 field study also presented a multivariate analysis of the IHRB TR-640 testing. The analysis shows the effect that various design parameters have on the pavement performance. In the graphs in Figure 18 the vertical axis is the PCI and the horizontal axis represents the design parameters. The multi-variate statistical analysis revealed that when improving drainage, a positive effect is made on the PCI. The analysis also shows that increasing age, and increasing the coefficient of variation of the k-value both have a negative effect on the PCI. An increase in the drainage has the largest effect on the PCI thereby improving performance and the level of service for the road user.
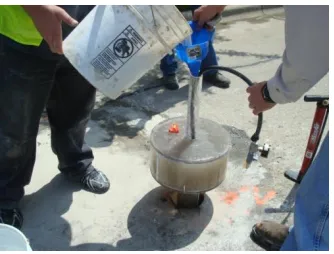
Core hole permeameter (CHP) tests were conducted to determine in situ hydraulic conductivity (KCHP) values. The Cd values were determined by estimating the time of drainage using the
KCHP values, pavement geometry (i.e., width and cross slope), and effective porosity of the drainage layer material.
In addition to these design input parameters, frost-heave susceptibility classification of the foundation materials was determined.
Previous research indicated that uniformity of pavement support conditions plays a critical role in long-term performance of PCC pavements (White et al. 2004). Uniformity of pavement support conditions was also evaluated in this study based on FWD test results. A uniformity classification matrix was developed to compare results from each site.
Following is a summary of key analysis results obtained from all field sites:
The joint LTE at 13 out of the 15 sites showed an average of ≥ 92% at the joints, irrespective of the foundation layer conditions. The remaining three projects showed average LTE < 50 percent.
It is found that modulus of subgrade reaction values determined from FWD test (Static
kFWD-Corr) correlate well with subgrade layer CBR, when the weakest layer CBR within
the top 16 in. of subgrade (CBRSG-Weak) is used. These correlations are also in line with
the data published previously by the U.S. Army Corps of Engineers (Barker and Alexander 2012), Thornton (1983), and Darter et al. (1995). There is significant variability in the k versus CBR relationships, however.
Composite k values determined that account for subbase layer modulus and thickness based on FWD tests (Static kcomp-FWD-Corr) were on average about 0.9 to 6.2 times lower
than the values determined from DCP test results using CBRSG-Weak (kcomp-DCP-Weak).
The kcomp-DCP-Weak values do not account for LS under the pavement in situ, while the kcomp-FWD-Corr values do as the measurement is directly on the pavement. The LS values
back-calculated by comparing the averages (per site) of these values ranged from about 0.7 to 1.7. These LS values are higher than the values currently suggested in the SUDAS design procedures (1 for natural subgrade and 0 for subbase). For sections with subbase, the LS values ranged from 0.7 to 1.3.
On average, the kcomp-FWD-Corr and kcomp-DCP values increased with increasing subbase layer
thickness. The Westlawn Dr. site (with 8.5 to 10 in. of subbase) was an exception because of poorly compacted backfill material in the subgrade at that site, which
contributed to LS and lower kcomp-FWD-Corr values. The W38/Locust Rd. section with 12 in.
of subbase (3 in. of subbase and 9 in. of macadam subbase) showed the highest k comp-FWD-Corr and kcomp-DCP values.
In situ hydraulic conductivity measurements (KCHP) values measured for the seven
different foundation layer support categories did not show improvement in Cd values with
increasing subbase layer thickness and were generally lower than suggested for design in SUDAS (Cd = 1.0 for natural subgrade and 1.1 when subbase is present).
Multi-variate statistical analysis performed on various parameters measured during this study revealed that improving subgrade strength/stiffness (within about the top 16 in. of the subgrade layer), improving drainage, providing a subbase layer, and reducing variability, can contribute to increasing the PCI value. Subgrade layer properties can be improved by stabilization, drainage can be improved by the presence of a relatively thin drainable subbase layer (note that subbase layer thickness was not statistically
significant), and variability can be reduced by adequate in situ testing. Some
The field investigation demonstrates that there can be several factors that affect pavement foundation performance including at least the following:
a. Poor support (due to low stiffness or CBR) b. Poor drainage
c. Seasonal variations (freeze-thaw and frost-heave) d. Shrink-swell due to moisture variations
e. Loss of support (due to erosion, non-uniform settlement, curling/warping) f. Poorly compacted utility trench backfill
g. Differential settlement of foundation layers h. Overall non-uniformity
Characterization of these problems can be determined from in situ testing. Options for field testing are summarized.
The PCI prediction model developed from multi-variate analysis in this study demonstrated a link between pavement foundation conditions and PCI. These results should be validated with data collected from more projects. The key aspect of this model is that by measuring properties of the pavement foundation, the engineer will be able to predict long term performance with higher reliability (by factor of 2.4 based on ratio of standard errors) than by considering age alone. This prediction can be used as motivation to then control the engineering properties of the pavement foundation for new or re-constructed PCC pavements to achieve some desired level of performance (i.e. PCI) with time.
In order to determine what soils are present and understand their characteristics, it is essential to complete a geotechnical investigation. It is very important that the conditions of the subgrade are known prior to design in order to select various treatments if necessary, and specify various materials and preparation to provide uniformity and support for the pavement section. The following information should be provided from a geotechnical investigation:
Soil classification – (USCS or AASHTO)
Soil profile from boring logs
Stratification lines and depths of the soil profile
Moisture or water content (measured as a percentage)
Groundwater level
Dry density or dry unit weight
Unconfined strength
Standard penetration resistance value (N)
The geotechnical investigation should identify potential problematic conditions such as highly plastic and expansive soils, areas of non-native fill, and amount of organic materials. Highly plastic and potentially expansive soils include lean to fat clay (USCS classification CL/CH and AASHTO classification A-7).
Soil boring sampling is typically completed using thin-walled, seamless steel tubes. A split barrel procedure is also typically performed using a specified process. The number of blows to advance the spoon the last 12 inches of an 18 inch penetration is known as the standard penetration resistance value (N). The Standard Penetration Test (SPT) estimates the relative density and approximate shear strength of the soil. From the sampling, the soil profile is determined. Figure 19 shows a typical soil boring log.
The geotechnical investigation should provide recommendations for proper roadway subgrade preparation as well as for treatment of potentially problematic conditions. This may include: Typical subgrade preparation
Strip vegetation, organics and unsuitable materials
Review of subgrade to identify expansive soils
Fill material with low plasticity, cohesive soils (LL of 45 or less and PI of 23 or less)
There are several types of in situ tests that can be performed to determine the characteristics and properties of the foundation layers. Table 4 lists common tests, design input parameters, and tested layers. This table was provided from the IHRB TR640 Field Data Report.
Once the pavement designer is familiar with the subgrade conditions, consideration should be given to subgrade treatment if necessary. There are several variations of treatments that can be performed on the subgrade to improve uniformity and strength and control movement for the pavement foundation. It is critical to manage or control the movement of the subgrade by
[image:32.612.71.536.349.546.2]uniform compaction, minimize the moisture in the subgrade and provide a uniform support layer. Non uniform soils will often have differing moisture contents and will behave differently when subjected to loading. Different moisture contents can cause differential deflections causing stress concentrations in the pavement which may then lead to cracking. Other than removing unsuitable soils and replacing with select fill, the treatments and control of subgrade movement can be done by any one or a combination of the treatments.
Table 5 provides foundation treatment options for various subgrade conditions. This information gives the pavement designer options to consider for cost effective treatments once the proper soil investigation has been completed. Subgrade stabilization treatments are discussed in the first section of this guide. This table is based on Table 25 from IHRB TR-640.
Subgrade Condition Foundation Treatment
Clayey soil (A-6, A-7) swell potential High PI
Dry out the subgrades by disking
Blending the soils
Compaction with M & D and lift thickness control
Portland Cement Stabilization of Subgrade (Cement Modified Soil)
Fly Ash Stabilization of Subgrade
Frost Heave (A-4) Thaw Softening
Dry out the subgrades by disking
Blending the soils
Cement + Fiber Stabilization of Aggregate subbase
Cement or Asphalt Stabilization of Aggregate subbase
Macadam Stone with Choke Stone Cover
Unstabilized aggregate subbase Wet Soft subgrade
Silty Soil (A-4,A-5) low LL Portland Cement Stabilization of Subgrade (Cement Modified Soils)
There are four typical subgrade treatment options:
Dry out the subgrade
Blend the soils
Stabilize with macadam stone
excessive moisture in wet soils can be completed by providing drainage through trenches, toe drains or a combination of a drainable support layer and subdrain. It can also be completed by compacting the subgrade using heavy compaction equipment to compress the soils and drive out the moisture; or adjusting the moisture content through chemical modification.
Proper compaction and consolidation can prevent settlement and differential deflections with non uniform soils. Subgrade preparation should include blending of the non-uniform soils in 8 inch lifts to near 2 ft. deep and compaction with moisture and density control. Compaction should be within 95 percent of the standard proctor density. Although this method is less expensive as compared to other methods, there have been mixed results with subgrade performance.
In some instances, aggregate stabilization can help to provide uniformity and support. In this method, unsuitable material is removed and replaced with Macadam stone (Iowa DOT gradation 13). This is a 3 inch nominal maximum size screened over a ¾ or 1 inch screen. The Macadam stone is then topped with a choke stone of nominal ¾ inch size. (Iowa DOT gradation 11).
Removal of unsuitable, unstable or excessively wet soils and replacement with select fill can be completed if acceptable materials are available. Although this method is very successful, the availability of quality fill can lead to higher costs. This method is typically more successful in the rural areas due to the availability of select fill and the ability for trucks hauling materials to and from the site.
It is very important to undertake field compaction testing to ensure that the design values assumed for the foundation support are being realized in the field. Traditionally this verification has involved determination of Proctor densities either by nuclear gauge by other means.
The benefits of an aggregate subbase and drainage system include the following:
Increases performance and service life
Provides a construction platform
Maintains uniform support
Provides drainage from water infiltration
Helps reduce shrink and swell of high volume-change soils
Controls excessive or differential frost heave
Minimizes mud-pumping of fine-grained soils
Prevents consolidation of subgrade
Current practice includes placing a thicker layer of aggregate subbase (8 to 9 inches for example); this additional thickness allows for the migration of soil into the aggregate subbase. Over the design life of the pavement, the effective thickness is likely reduced after soil
migration. Another option would be to place a layer less than 6 inches and provide separation between the aggregate subbase and subgrade in the form of a geotextile. This option may be more cost effective depending on the selection and availability of materials.
Therefore, it is reasonable and may be cost effective to consider a support system consisting of a relatively thin aggregate subbase with proper drainage to reduce the effects of soil variability as long as there is a mechanism to provide separation from the variations in the natural soil.
The TR-640 testing shows that over time, the aggregate subbase loses some of its drainage and support capabilities due to the migration of soils into the aggregate subbase. If the pavement designer chooses to maintain a uniform support platform and drainage system for an extended service life, an affordable and effective separation barrier between the granular material and the natural subgrade is an option. This barrier reduces the migration of soil into the aggregate subbase allowing the pavement system to perform at a higher level of service for not only the design life but also the rehabilitation life of the pavement. The barrier can be accomplished by either stabilizing the natural soil with cement or fly ash or the placement of a geotextile between the aggregate subbase and subgrade. Figure 24 shows a poor pavement with moist subgrade conditions.
An option to using a thicker aggregate subbase (8 inches or more) is a thinner aggregate subbase (4 to 5 inches) with a separation barrier. A thinner granular layer with a separation barrier, such as a geotextile, is typically a less costly option than a thicker granular layer.
According to research by product manufacturers, geotextiles provide the best performance when it comes to separation of soil particles from aggregate subbase. Geotextiles provide three
important functions:
1. Separation/stabilization 2. Drainage
3. Reinforcement
There are two types of geotextiles; non-woven and woven. Both types are permeable and allow water to pass through. When selecting the appropriate geotextile, the Apparent Opening Size (AOS) is critical. The selection of the geotextile should be based on the size of the fine-grained soil particles. The AOS of the material should be smaller than the surrounding soil particles, allowing he water to pass through, but not the soil particles.
Nonwoven geotextiles are geotextiles with greater than 50 percent elongation. Having tighter openings allows for decreased filtration over typical woven geotextiles, therefore allowing for greater separation between dissimilar materials. While non-woven geotextiles perform better for filtration, separation, and drainage, design between subgrade and base layers should be carefully examined before deciding on type of geotextile for separation/ stabilization.
Woven geotextiles are higher strength geotextiles with lower than 50 percent elongation, which are good for very poor soil properties in areas with high water tables. Soil properties such as allowable bearing pressure or CBR as well as the AOS play a very important role in the selection of the right geotextile for the design. Typical design considerations can be determined using the AASHTO property requirement tables for geotextiles.
Separation of dissimilar materials indicates greater stabilization properties by preventing
contamination of the subgrade and base materials. Figure 25 shows the migration of soils into the aggregate subbase.
Non-woven geotextiles resemble a felt material and are made of polypropylene. They are commonly referred to as “filter fabric”. Non-woven geotextiles typically have an AOS range from sieve size number 50 to 100. Figure 26 illustrates a non-woven geotextile.
Soils with CBR greater than 3 and lower water tables are good candidates for nonwoven geotextiles. Typical nonwoven geotextiles for roadway applications range from 6 to 10 ounces per square yard. Strengths range from 160 to 250 pounds per square yard.
The medium weight material is used for separation and drainage between aggregate subbases and subgrades. Weights range from 6 to 10 ounces per square yard with tensile grab strengths
ranging from 160 to 200 pounds. An 8 ounce per square yard is typically recommended for Iowa soils.
As suggested earlier, geotextile selection should be determined based on soil properties and geotextile specifications. Manufacturers have design software that can determine proper geotextile selection for reduced aggregate per the roadway design. Refer to the state qualified products list to ensure materials have been tested and meet AASHTO and state specifications for each geotextile. Figure 27 illustrates a woven geotextile. The use of geotextiles can increase performance of the pavement system by providing strength and separation between the aggregate subbase and subgrade. It is still important to properly prepare the subgrade by scarification, compaction and moisture treatment to gain the full benefit of the geotextile. Figure 28 illustrates a pavement section with aggregate subbase separating the subgrade with a geotextile material.
The geotextile option is less expensive with a range from approximately $1.75 to $2.50 per square yard. Geotextiles will provide the separation and drainage but also provide potential tensile reinforcement at the top of the subgrade. However, the nonwoven geotextile does need to have an outlet into the aggregate subbase subgrade system.
The cost for aggregate subbase is approximately $1.15 per square yard per inch of thickness based on recent bid history. If the aggregate subbase is reduced in thickness by 2 inches, this would represent the equivalent cost for the geotextile. For example, a pavement support system with 8 inches of aggregate subbase has approximately the same cost as a system with 6 inches of aggregate subbase and a geotextile.
Table 6 lists the average installation costs (labor plus materials) of various separation materials including the average costs of woven and non-woven geotextiles and Iowa DOT Modified Subbase. The values below are statewide averages and actual costs may vary depending on the project location and availability.
Separation Type Geotextile ($ per SY) Modified Subbase ($ per SY per inch)
Cost $1.75–$2.50 $1.10-$1.20
Even with a subgrade that has been stabilized, it is important to include an aggregate subbase layer to provide drainage away from the pavement support layers and to provide separation between the stabilized subgrade and the pavement.
Improvements to the pavement support system including subgrade treatments, the addition of an aggregate subbase layer, the addition of geotextile and a subdrain system will undoubtedly improve the pavement performance and provide an increased level of service to the roadway users. However without proper construction practices and materials, the benefit may be short-lived. Proper inspection is needed to provide oversight, assure conformity with the plans and specifications and also provide timely remedial action to problems that may occur in the field. The cost of inspection is minimal when spread out over the life of the pavement.
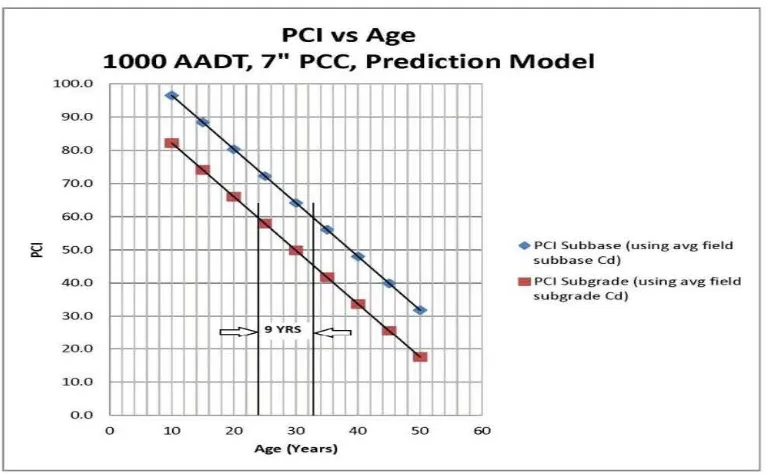
Using the PCI prediction model from the IHRB TR-640 study (see Figure 16), an analysis was conducted to determine the increase in performance on a sample pavement. Using average foundation layer values from the 16 test sites, it is shown that the service life of concrete pavements can be increased when a properly drained aggregate subbase is used as a support layer. Figures 29 and 30 illustrate the increase in performance using the PCI prediction model. These figures are based on a sample 7 inch PCC pavement and include the average Cd, average
Figure 31 was developed using the PCI prediction model and compared drainage coefficient values for a pavement on natural subgrade and a pavement on aggregate subbase. Other parameters used were based on the average values of the test sites in the IHRB TR-640 study.
0 Cl. l.OO.O 90.0 80.0 70.0 60.0
2 50.0
40.0 30.0 20.0 l.O.O 0.0 100.0 90.0 80.0 70.0
60.0
50.0 40.0 30.0 20.0 10.0 0.0
PCI vs Age
500 AADT, 7" PCC, Prediction Model
I ~
II
f"'
"'
I 1.,
I
~
I
I
I\.. II
~
I
> 10 YRSI<::J
j
!l
I I I II
0 10 20 30 40
Age (Years)
I
I
I
I
I
~
I.II
50 60
• PCI Subbase (using avg field
subbase Cd)
• PCI Subgrade (using avg field
[image:40.612.146.466.69.315.2]subgrade Cd)
Figure 29. PCI vs. age 500 AADT (PCI Prediction Model)
PCI vs Age
1000 AADT, 7" PCC, Prediction Model
0
1~11
I
I
I
J
.
'
rt
~
I
I
I
"'
~ liltI j)~ ~~
I
I I ~ ~""'
I~ II
I
~
~
~ 9YRS
R=+
•
II I
I
1
•
•
1
I I
I
I
II I Il.O 20 30 40 so
Age (Years)
II
II
I
I
60
+ PCI Subbase (using avg field
subbase Cd)
• PCI Subgrade (using avg field
[image:40.612.116.499.359.596.2]subgrade Cd)
drainage coefficient (0.8). The red line represents a 7 inch PCC pavement on aggregate subbase with an improvement in the drainage coefficient to 0.88. Using the model, the improved drainage coefficient predicts a PCI of approximately 68 at year 40.
An analysis using WinPAS 12 was completed to determine the increase in reliability between a PCC pavement placed on natural subgrade and a PCC pavement placed on a 5 inch aggregate subbase. A sample pavement with thicknesses of 6 inch and 7 inch was used along with varying
PCI Prediction Model (TR640 site averages)
CBR SGWeak = 3.5* (average
CBRSG-weak)
CBR Subgrade = 16
CBR Subbase = 58
COV SGWeak = 42.8
COV kFWD = 29
AADT = 1000
PCC = 7"
y = -1.615x + 117.28 y = -1.615x + 133.75
y = -1.615x + 103.5 0.0 10.0 20.0 30.0 40.0 50.0 60.0 70.0 80.0 90.0 100.0
0 10 20 30 40 50 60 70
PCI
Age (years)
PCI vs. Age - Using Linear PCI Prediction
Model
PCI Subbase (Cd=0.80)
PCI Subbase (Cd = 0.88)
levels of traffic from 1000 AADT to 5000 AADT. Standard design parameters were used for concrete strength, load transfer, and serviceability. A coefficient of drainage Cd value of 0.8 was
used for the pavement on subgrade based on the average Cd from the TR-640 site values. A
coefficient of drainage value of 0.9 was used for the pavement on 5 inch aggregate subbase based on using a geotextile interlayer that maintains an aggregate subbase for the pavement life. This value corresponds to the improved drainage coefficient as shown in the increased
performance above. The modulus of subgrade reaction values of 100 psi/in. and 194 psi/in. were used for the subgrade and aggregate subbase respectively. The analysis shows an increase of 15 to 31 percent in reliability based on the varying levels of traffic for a 40 year pavement thickness design and an increase of 8 to 23 percent in reliability for a 30 year pavement thickness design. Table 7 lists the design parameter values of the WinPAS analysis.
The following conclusions are made with respect to pavement design and improved foundation
40 Year Design
Natural Subgrade 5" subbase Natural Subgrade 5" subbase Natural Subgrade 5" subbase
PCC thickness 6" 6" 6" 6" 7" 7"
Rigid ESALS (5% trucks, 1% growth) 339,259 339,259 678,518 678,518 1,696,296 1,696,296
Overall Standard Deviation 0.35 0.35 0.35 0.35 0.35 0.35
Flexural Strength 650 psi 650 psi 650 psi 650 psi 650 psi 650 psi
Modulus of Elasticity 4,400,000 psi 4,400,000 psi 4,400,000 psi 4,400,000 psi 4,400,000 psi 4,400,000 psi
Load Transfer Coefficient 3.0 3.0 3.0 3.0 3.0 3.0
Modulus of Subgrade Reaction (k) 100 psi/in. 194 psi/in. 100 psi/in. 194 psi/in. 100 psi/in. 194 psi/in.
Drainage Coeffiecient 0.8 0.9 0.8 0.9 0.8 0.9
Initial Serviceability 4.5 4.5 4.5 4.5 4.5 4.5
Terminal Serviceability 2.0 2.0 2.0 2.0 2.0 2.0
Reliability 82% 97% 53% 84% 52% 82%
15% increase in Reliability 31% increase in Reliability 30% increase in Reliability
30 Year Design
Natural Subgrade 5" subbase Natural Subgrade 5" subbase Natural Subgrade 5" subbase
PCC thickness 6" 6" 6" 6" 7" 7"
Rigid ESALS (5% trucks, 1% growth) 241,398 241,398 482,797 482,797 1,206,992 1,206,992
Overall Standard Deviation 0.35 0.35 0.35 0.35 0.35 0.35
Flexural Strength 650 psi 650 psi 650 psi 650 psi 650 psi 650 psi
Modulus of Elasticity 4,400,000 psi 4,400,000 psi 4,400,000 psi 4,400,000 psi 4,400,000 psi 4,400,000 psi
Load Transfer Coefficient 3.0 3.0 3.0 3.0 3.0 3.0
Modulus of Subgrade Reaction (k) 100 psi/in. 194 psi/in. 100 psi/in. 194 psi/in. 100 psi/in. 194 psi/in.
Drainage Coeffiecient 0.8 0.9 0.8 0.9 0.8 0.9
Initial Serviceability 4.5 4.5 4.5 4.5 4.5 4.5
Terminal Serviceability 2.0 2.0 2.0 2.0 2.0 2.0
Reliability 91% 99% 69% 92% 68% 91%
8% increase in Reliability 23% increase in Reliability 23% increase in Reliability
1000 AADT 2000 AADT 5000 AADT