*Corresponding author:Selvanayagi D ISSN: 0976-3031
Research Article
RECOGNIZING LOCATION OF GRAPHICAL AND TEXT FOR RESTORATION AFTER
SEPARATION AND COMPRESSION IN PDF DOCUMENTS
*Selvanayagi D and Pannirselvam S
Department of Computer Science, Erode Arts and Science College,
Erode-638009, Tamil Nadu, India
DOI: http://dx.doi.org/10.24327/ijrsr.2017.0806.0388
ARTICLE INFO ABSTRACT
Portable Document Format (PDF) is ideal for electronic books due to its ability to preserve the appearance of the original documents. The PDF documents contain various components like text, images, charts, tables etc. There are various researches was carried out on recognition of text, images, charts and tables in PDF files. But there is no research has been carried out to locate the recognized components of PDF in same place of transmitted PDF file which has gained attention in the past few decades. Hence in this paper, proposed a technique that locates the recognized text, images, charts, tables in the same place of transmitted PDF files. The graphic region of PDF file is separated from text by making use of single pass connected components. In the graphic region chart and non chart part of PDF files are separated based on the Connected Component Labels (CCL) and the images in the chart part are recognized based on connectivity components. The text in the PDF file is recognized by using a whitespace analysis approach based on connected components. Finally the T-Recs table recognition system is used to recognize the tables in the PDF files. The location of recognized text, images, charts and tables are maintained in a matrix and it is located in the same place based on the matrix value. The experiments are conducted in number of PDF files to prove the effectiveness of the proposed method in terms of accuracy, precision, recall and F-measure.
INTRODUCTION
Nowadays an increasing number of documents are available in PDF format that can be greatly facilitated document exchange and printing (Agarwal and Kaushik 2015). The PDF format contains compound data containing a mixture of text and figures. Knowledge mining from PDF documents us frequently desired many applications. PDF file have become the de facto standard in many fields like websites and digital libraries. The increased use is mainly contributed by its independence of local formatting restrictions and its accurate reproducibility. The business and online users often demand conversion software to convert PDF files into either HTML formats or text. The main reason is that many devices such as embedded devices cannot handle PDF files and online users. Thus the current need of the market, are PDF converters that have highest recognition accuracy, retains format and is easy to use. PDF converter techniques are can be divided into text recognition (Bui et al 2016) and graphics recognition (Shao
and Futrelle 2005). Text recognition is involved with the
algorithms which work on the textual components of the PDF files. The graphic recognition focuses on the graphical part of
the PDF files. The graphical part consists of diagrams, charts, maps and engineering drawings. The various researches on PDF document analysis is receiving more and more attention and significant progress has been made in recognizing basic components of PDF documents.
Optical Character Recognition (OCR) (Ramiah et al 2015) is widely used for text recognition process. The OCR algorithm depends on the successful separation of text and graphical part of the PDF document. The task of separating graphics from the text is considered as important as they contain more important information that cannot be recognized effectively. The graphics segmentation from text is particularly difficult in the context of graphics made of small components which have many features similar to texts.
In this paper, the different components in PDF file are recognized by different efficient techniques. Initially the graphic region form text region is separated by using single pass connected components. The graphs in the PDF are recognized based on the height and weight of the PDF page, height and width of the PDF page graphical components and predefined weights. In the text recognition process, the page
International Journal of
Recent Scientific
Research
International Journal of Recent Scientific Research
Vol. 8, Issue, 6, pp. 17598-17603, June, 2017
Copyright © Selvanayagi D and Pannirselvam S, 2017, this is an open-access article distributed under the terms of the Creative Commons Attribution License, which permits unrestricted use, distribution and reproduction in any medium, provided the original work is properly cited.
DOI: 10.24327/IJRSR
CODEN: IJRSFP (USA)
Article History:
Received 20th March, 2017 Received in revised form 29th April, 2017
Accepted 30th May, 2017 Published online 28th June, 2017
Key Words:
Portable Document Format, Recognition, Connected Component Labels,
columns of PDF files are detected based on whitespace analysis approach in terms of maximal empty rectangles. Then the text lines in the page columns are clustered. The text elements are merged together based on the spatial distance between text lines. Text lines are grown into text blocks based on the feature similarity. Then the tables in the text are recognized by using T-Recs table recognition system. The location of images, charts, texts and tables are maintained in matrix form. The matrix values are used to locate the same place of transmitted PDF file.
Auer et al 2012 proposed optical graph recognition method
which extracts topological structure of a graph from its drawing. It is an adopted version of optical character recognition (Rao et al 2016). It extracts plain text from images for automatic processing. Initially it maps vertices to points and display by icons and it maps edges to Jordan curves connecting the endpoints. It converts the digital image into the topological structure. But the optical graph recognition method has high false positive rate.
Fang et al 2011 proposed a novel approach of paragraph
recognition with a main intend of reflowing the PDF format electronic book. The novel paragraph recognition approach analyzed physical structure and segments the logical paragraphs with the help of locally ordered characteristics of PDF documents. It recognized the paragraph in PDF files based on physical structure analysis, paragraph segmentation and reading order detection. But this approach doesn’t detect the reading order of images together with textual content.
Marinai et al 2010 described a tool for table content
recognition and identification from PDF books. It identified the table of content pages in the PDF files. Then add suitable links in the Epub table of content based on the determination of bounding boxes of table of content. The proposed tool is tolerated to discrepancies between the table of content text and their corresponding titles. It was based on the six main steps are identification of table of content pages, manual markup of table of content pages in case of missing pages, identification of potential titles in the table of content, search for potential titles in the book and identification of the target titles, actual title identification and user validation or editing of the automatic identification and export in Epub format. The major disadvantage of this approach is it is a semi automatic approach it needs a human operator for table of content extraction.
Lin et al 2011 proposed a novel method for recognizing
mathematical expressions in PDF documents. The proposed method is combination of combining rule based and learning based methods which detect both embedded and isolated mathematical expressions in PDF documents. Furthermore, different features of formulas such as character content, context content and geometric layout were utilized to adapt to a wide range of formula types. Initially the input PDF files are preprocessed and then the text line in PDF files is detected. The features are analyzed and the features are extracted using rule based extraction and the isolated formulas are recognized by SVM based extraction. The embedded formulas are recognized by rule based extraction. The precision and recall of the embedded formula identification is low which is the major disadvantage of this novel mathematical expression recognition method.
Siciare and Wiszniewski 2016 proposed a generic Reverse
Model-View-Controller for extraction of information from Born-Digital PDF Documents which is used for reproducible research. The proposed model enables to cope with that arbitrariness in a systematic way. It constitutes a component of a larger framework we have been developing for making executable papers out of PDF documents without injecting in the PDF file any extra data or code.
Ramakrishnan et al 2012 introduced layout aware PDF text
extraction (LA-PDF Text) system which facilitate accurate extraction of text from PDF files. It extracts the ext blocks from PDF formatted research article and those are classified as logical units based on rules which characterize the specific sections. The LA-PDF Text processed based on detecting continuous text blocks utilizing spatial layout processing to identify and locate blocks of continuous text, classifying text blocks rhetorical categories utilizing a rule-based method and Stitching classified text blocks together in the correct order resulting in the extraction of text from section-wise grouped blocks. This system has low recall value.
MATERIALS AND METHODS
In this section, the proposed methods for text, images, charts and tables recognition in PDF file and embedded in PDF files are described. The text in input PDF file is recognized by using a whitespace analysis approach where the text is detected and bottom up approach is used to merge the text elements into text lines. The charts in the PDF files are recognized by proposed connected component labels (CCL) that separates the graphics region from the text. The images in the PDF files are recognized based on the connectivity components. According to T-Recs table recognition system the tables in PDF files are recognized. The location of recognized text, images, charts, tables and forms are maintained in a matrix. Based on the location of text, images, charts, tables and forms, those are embedded in a PDF files.
Recognition of charts and images in PDF file
The graphic regions in the PDF files are separated from the text region by making use of single pass connected components. Then a box bounding algorithm is proposed to locate the chart from the graphics regions. Initially the connected component labels are constructed and add some additional steps with two pass algorithm to recognize the chart and non chart parts in PDF files. The following algorithm is the modified one pass connected component label algorithm:
Modified one pass connected component label algorithm
Input: PDF
Step 1: Initialize [X, Y] = size (PDF) //X denotes the height of PDF and Y denotes the width of PDF file
Step 2: Assign Connected to zeros (X, Y), Mark = value, index=[], =0
// denotes the number of objects Step 3: Set offsets as [-1; X; 1;-X] Step 4: initialize m =1
Step 5: while m< height of PDF Step 6: initially n=1
Step 9: Increment the by 1
Step 10: Set connected (index) to Mark Step 11: Set index to [((n-1)*X+m]; Step 12: while index!=0s
Step 13: Set the corresponding pixel to 0 of images in PDF ‘ Step 14: Updated vector (index) with the neighboring pixels of the currently set pixels
Step 15: Set the pixels indicated by index to 1 in the connected component matrix
Step 16: end while
Step 17: Increment the marker for another object in the PDF file
The above modified one pass CCL algorithm returns a set of components which are then classified as text and graphical components. The graphics in PDF files are separated using vectorization process and directed single connected chain [12]. The graphs in the PDF are recognized based on the height and weight of the PDF page, height and width of the PDF page graphical components and predefined weights.
The bounding of the figure is determined by using the following equation,
> × and > × (2)
In equation 2, and denotes the height and width of the graphical connected components, and denotes the height and width of the PDF page and and are the predefined weights ranges from 0 to 1. Two graphical components are grouped if the minimum distance between bounding boxes is smaller than a threshold value.
While recognizing the chart and non chart in PDF files care should be taken to differentiate from framed and borderless tables, halftones and non chart drawings. A binary classifier is utilized to group the chart and non chart figures. By calculating the portion of pixels from text components in a block’s bounding box tables are differentiated. The box is treated as a table when the calculated portion is higher than threshold value. The low standard deviation and high density of vertical black pixel histogram properties of half tone images is used to classify them as non chart figures. During the vectorization process the number of line segments is observed along with the number of perpendicular and parallel segments which is utilized to classify the chart from other drawings. These features are then used to train the classifier. Based on the results of trained classifier the chart and non charts images in PDF files are recognized. The location of their charts and non chart images are maintained in a matrix format.
Recognition of text in PDF file
The page columns in the PDF files are detected based on the whitespace analysis approach. This approach finds a cover of the background whitespace of a PDF file in terms of maximal empty rectangles. The maximal white rectangle represents the column of the PDF files. Assume = { , , … , } is the collection of rectangles within some given bounding rectangle . In layout analysis, represents the bounding boxes of the connected components on the page and the overall bounding rectangle denotes the whole page. An evaluation function for rectangles E is given: → satisfying, for any two rectangles x and ′ that
⊆ ′→ ( ) ≤ ( ′)
(3) where E function denotes the area of the rectangle.
The process of maximal rectangle is to determine a rectangle
⊆ which maximizes E (T) among all the possible rectangles ⊆ where x overlaps none of the rectangles in C. sit can be expressed in mathematical notation which is given as follows:
= ( , , ) = arg ∈ ( ) (4)
where = { ⊆ |∀ ∈ : ∩ = }.
For the text recognition, the maximum empty rectangle can be used with obstacles that are rectangles or points. The key idea is analogous to branch and bound or quicksort methods. The proposed text recognition algorithm, get an outer bound and a collection of rectangles otherwise called as obstacles. If none of the rectangles are contained within the bound, then the bound is itself the maximal rectangle given the obstacles. On the other hand if one or more rectangles are contained within the bound select the pivot from one of the available rectangles. The maximal rectangle cannot contain any of the obstacles in particular it cannot contain the pivot. Then compute the obstacles overlapping each of the sub rectangles within the bound and determine an upper bound on the quality of the maximal empty rectangles within each sub rectangle. The sub rectangles and their associated obstacles and qualities are inserted into a priority queue. The above process is repeated until the first obstacle-free rectangle appears at the top. This is determined based on the quality function E. Thus the page columns in the PDF files is detected in the first place, then the text lines in the page columns are clustered. Based on the spatial distance between text lines the text elements are merged based on the bottom up method. Text lines are grow into text blocks based on the feature similarity such as font size, inter text spacing, right alignment and left alignment of the text in the PDF files. Thus the texts in the PDF file are recognized and their locations of texts are maintained in a matrix.
Recognition of Tables
The tables in the PDF file are recognized by T-Recs table recognition system which is an integrated system covering block segmentation, table location and model free structural analysis of tables. T-Recs table recognition system consists of two subsystems block segmentation and the table locator. For the table recognition proper segmentation is the most challenging one. Furthermore, one of the post processing steps which are the correction of words in isolated lines already relied on a simple heuristics that determine the vertical region of a potential table structure. Subsequently such heuristics are adopted for the location task. The heuristics are wherever two or more block segments are placed in relative neighborhood then it is assumed that it faced a tabular structure.
The location of text, images, charts and tables are maintained in a matrix form. Then the text, images and charts are located in same place of transmitted PDF file based on the matrix value.
Text, image, chart and table recognition Algorithm
Input: PDF file
Step 1: Get the set of text and graphic components using modified one pass CCL algorithm briefly explained in 3.1. Step 2: Separate the graphic part using vectorization and directed single connected chain
Step 3: Graphs in PDF are recognized using equation 2
Step 4: Binary classifier is used to group chart and non chart images
Step 5: Determine the maximal empty rectangles which detects the page columns using equation 3 and 4
Step 6: Cluster the text lines in the page columns
Step 7: Merge the text lines into text elements based on the spatial distance between text lines
Step 8: Grow text lines into text blocks based on feature similarity
Step 9: T Rec table recognition system recognized the tables based on heuristics
EXPERIMENTAL RESULTS
In this section, the performance of the proposed technique is evaluated to determine its effectiveness compared with the original transmitted file. For the experimental purpose, 10 PDF files are collected from Google. From the collected PDF files, the text, images, charts and tables are recognized and located in the same location of transmitted PDF. The effectiveness of the proposed method is measured in terms of accuracy, precision, recall and F-measure.
Accuracy
Accuracy is the measure of correctly located all components of PDF files. It can be calculated by
= ( + )
( + + + )
The following table 1, shows the comparison of accuracy.
Figure 1 shows the comparison of accuracy of proposed recognition system text recognition using white space approach (Text Rec-whitespace),Text and Image Recognition (Text-Image Rec), Text, image and chart recognition (Text- Image-Chart Rec) and Text, image, chart and Table recognition (Text-Image-Chart-Table Rec) with the existing Text rec using background analysis (Text Rec- background analysis), Text based approach for indexing of image, Scientific chart recognition (SCR) and T-recs recognition system (T-recs). From the figure 1 and table 1, it s proved that the Text Rec-whitespace has high accuracy than the other proposed methods.
Precision
Precision value is evaluated according to the relevant information at true positive prediction, false positive.
=
( + )
The following table 2, shows the comparison of precision.
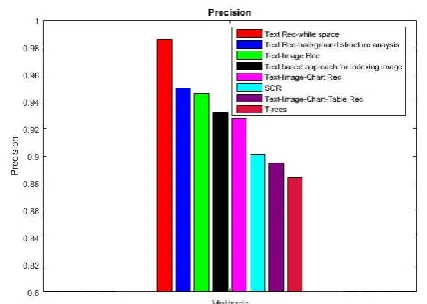
Figure 2 shows the comparison of precision of proposed recognition system text recognition using white space approach (Text Rec-whitespace),Text and Image Recognition (Text-Image Rec), Text, image and chart recognition (Text- Image-Chart Rec) and Text, image, chart and Table recognition (Text-Image-Chart-Table Rec) with the existing Text rec using background analysis (Text Rec- background analysis), Text based approach for indexing of image, Scientific chart recognition (SCR) and T-recs recognition system (T-recs). From the figure 2 and table 2, it is proved that the Text Rec-whitespace has high precision than the other proposed methods.
Recall
The Recall value is evaluated according to the location of components of PDF files at true positive prediction, false negative.
Table 1 Comparison of Accuracy
Text Rec-whitespace Text Rec-background
analysis Text-Image Rec
Text based approach for indexing image
Text-Image-Chart Rec SCR
Text-Image-Chart-Table Rec T-recs
Accuracy 99.2 97.4 95.2 94 93.5 91.5 90.17 89.1
Figure 1 Comparison of Accuracy
Table 2 Comparison of Precision
Text Rec-whitespace background analysis Text Rec- Text-Image Rec Text based approach for indexing image Text-Image-Chart Rec SCR Text-Image-Chart-Table Rec T-recs
Precision 0.986 0.95 0.946 0.932 0.928 0.901 0.895 0.884
=
( + )
The following table 3, shows the comparison of recall
Figure 3 shows the comparison of recall of proposed recognition system text recognition using white space approach (Text Rec-whitespace),Text and Image Recognition (Text-Image Rec), Text, image and chart recognition (Text- Image-Chart Rec) and Text, image, chart and Table recognition (Text-Image-Chart-Table Rec) with the existing Text rec using background analysis (Text Rec- background analysis), Text based approach for indexing of image, Scientific chart recognition (SCR) and T-recs recognition system (T-recs). From the figure 3 and table 3, it s proved that the Text Rec-whitespace has high recall than the other proposed methods.
F-Measure
F-measure is a measure of a test's accuracy. It considers both the precision and the recall of the test to compute the score. It is defined as follows:
= 2. Precision . Recall
Precision + Recall
The following table.4, shows the comparison of F-measure
Figure 4 shows the comparison of F-measure of proposed recognition system text recognition using white space approach (Text Rec-whitespace),Text and Image Recognition (Text-Image Rec), Text, image and chart recognition (Text- Image-Chart Rec) and Text, image, chart and Table recognition (Text-Image-Chart-Table Rec) with the existing Text rec using background analysis (Text Rec- background analysis), Text based approach for indexing of image, Scientific chart recognition (SCR) and T-recs recognition system (T-recs). From the figure 4 and table 4, it s proved that the Text
Rec-whitespace has high F-measure than the other proposed methods.
CONCLUSION
In this paper, different components in PDF files are recognized based on different techniques. Initially the graphic region is separated from text region based on single pass connected component labels. Then the charts and non charts parts in graphic regions are recognized based on the information of height and weight of the PDF page, height and width of the PDF page graphical components and predefined weights. The text in PDF files are recognized based on whitespace approach, bottom up approach and feature similarity approach. Then T-Recs table recognition system is used to recognize the tables in PDF files. The location of text, images, charts and tables are maintained in a matrix forma and located in the same location of transmitted PDF file. The experimental results prove that the proposed method has better accuracy, precision, recall and F-measure.
References
Agarwal, M., and Kaushik, B. (2015). Text recognition from image using artificial neural network and genetic algorithm. Green Computing and Internet of Things (ICGCIoT), IEEE 1610-1617.
Bui, D. D. A., Del Fiol, G., and Jonnalagadda, S. (2016). PDF text classification to leverage information extraction from publication reports. Journal of biomedical informatics, 61, 141-148.
Table 3 Comparison of Recall
Text Rec-whitespace Text
Rec-background analysis
Text-Image Rec
Text based approach for indexing image
Text-Image-Chart Rec SCR
Text-Image-Chart-Table
Rec
T-recs
Recall 0.976 0.964 0.952 0.942 0.931 0.928 0.902 0.89
Figure 3 Comparison of Recall
Table 4 Comparison of F-measure
Text Rec-whitespace Text
Rec-background analysis Text-Image Rec
Text based approach for indexing image
Text-Image-Chart Rec SCR
Text-Image-Chart-Table Rec T-recs
F-measure 0.98 0.957 0.949 0.937 0.929 0.914 0.898 0.887
Shao, M., and Futrelle, R. (2005). Graphics recognition in PDF documents. In Proc. of GREC.
Ramiah, S., Liong, T. Y., and Jayabalan, M. (2015). Detecting text based image with optical character recognition for English translation and speech using Android. Research and Development (SCOReD) IEEE, 272-277.
Auer, C., Bachmaier, C., Brandenburg, F. J., Gleißner, A., and Reislhuber, J. (2012). Optical graph recognition. International Symposium on Graph Drawing Springer Berlin Heidelberg, 529-540.
Rao, N. V., Sastry, A. S. C. S., Chakravarthy, A. S. N., and Kalyanchakravarthi, P. (2016). Optical Character Recognition Technique Algorithms. Journal of Theoretical and Applied Information Technology, 83, 2, 275.
Fang, J., Tang, Z., and Gao, L. (2011). Reflowing-driven paragraph recognition for electronic books in PDF. IS&T/SPIE Electronic Imaging. International Society for Optics and Photonics, 78740U-78740U.
Marinai, S., Marino, E., and Soda, G. (2010). Table of contents recognition for converting PDF documents in e-book formats. Proceedings of the 10th ACM symposium on Document engineering ACM, pp. 73-76.
Lin, X., Gao, L., Tang, Z., Lin, X., and Hu, X. (2011). Mathematical formula identification in PDF documents. Document Analysis and Recognition (ICDAR), 2011 International Conference on IEEE, 1419-1423.
Siciare, J., and Wiszniewski, B. (2016). Extraction of Information from Born-Digital PDF Documents for Reproducible Research. Journal of Advanced Management Science, 4, 3.
Ramakrishnan, C., Patnia, A., Hovy, E., and Burns, G. A. (2012). Layout-aware text extraction from full-text PDF of scientific articles. Source code for biology and medicine, 7, 1, 7.
Zheng, Y. F., Liu, C. S., Ding, X. Q., and Pan, S. Y. (2002). A form frame-line detection algorithm based on directional single-connected chain. Journal of Software, 13, 04, 790-796.
*******
How to cite this article:
Selvanayagi D and Pannirselvam S.2017, Recognizing Location of Graphical and Text for Restoration after Separation and Compression in Pdf Documents. Int J Recent Sci Res. 8(6), pp.17598-17603.