VOLUME NO. 2 (2012), ISSUE NO. 1 (JANUARY) ISSN2231-5756
A Monthly Double-Blind Peer Reviewed Refereed Open Access International e-Journal - Included in the International Serial Directories Indexed & Listed at:
Ulrich's Periodicals Directory ©, ProQuest, U.S.A., EBSCO Publishing, U.S.A., Index Copernicus Publishers Panel, Poland, Open J-Gage, India [link of the same is duly available at Inflibnet of University Grants Commission (U.G.C.)]
VOLUME NO. 2 (2012), ISSUE NO. 1 (JANUARY) ISSN2231-5756
CONTENTS
Sr.
No.
TITLE & NAME OF THE AUTHOR (S)
Page No.
1. THE INTERMEDIATE COMMUNITY: A BEHAVIORAL/BARGAINING APPROACH FOR CONFLICT RESOLUTION AT THE LOCAL LEVEL/BAYESIAN ANALYSIS
DR. LEONIDAS A. PAPAKONSTANTINIDIS
1
2. IMPACT OF NEW REFORM ON PRODUCTIVITY OF ETHIOPIAN COTTON TEXTILE INDUSTRY DR. BREHANU BORJI AYALEW
7
3. SIGNIFICANCE OF TOTAL QUALITY MANAGEMENT IN ORGANIZATIONAL PERFORMANCE: AN EMPIRICAL ANALYSIS FROM SMES SECTOR
FAROOQ ANWAR, IRFAN SALEEM & AYESHA ZAHID
13
4. INDEPENDENCE AND IMPARTIALITY OF AUDITORS FROME THR VIEWPOINTS OF INDEPENDENT AUDITORS AND INVESTMENT COMPANIES
MOHAMADREZA ABDOLI
17
5. COMPARATIVE ANALYSIS OF SELECTED HOUSING FINANCE COMPANIES IN INDIA DR. D. GURUSWAMY
20
6. MUNICIPAL SERVICE QUALITY IN SOUTHERN THAILAND: AN EMPIRICAL INVESTIGATION OF CUSTOMER PERCEPTIONS SAFIEK MOKHLIS
30
7. THE IMPERATIVES OF LEADERSHIP QUESTION IN MEDIA MANAGEMENT BELLO SEMIU & KASALI TAOFEEK
36
8. PERCEIVED PURCHASE RISK IN THE TECHNOLOGICAL GOODS PURCHASE CONTEXT: AN INSTRUMENT DEVELOPMENT AND VALIDATION
IMAM SALEHUDIN
41
9. STUDY ON TRADITIONAL VERSUS CONTINUOUS ACCREDIATION PROCESS & EXPLORING LEADERSHIP DISPARITY HARINI METHUKU & HATIM R HUSSIEN
49
10. VOLATILITY OF AGGREGATE MARKET INDICES NALINA K B & B SHIVARAJ
56
11. STUDENT FEED BACK: A TOOL TO ENHANCE QUALITY IN ENGINEERING EDUCATION VEERANNA.D.K & DR. ANAND.K.JOSHI
63
12. JOB SCHEDULING OF NURSE STAFFING: A DYNAMIC PROGRAMMING APPROACH KAVITHA KOPPULA & DR. LEWLYN L. RAJ RODRIGUES
66
13. INFLUENCE OF PERSONAL FACTORS ON ORGANISATIONAL CLIMATE IN IT COMPANIES R. DARWIN JOSEPH & DR. N. PANCHANATHAN
70
14. ANALYSIS OF CUSTOMER SATISFACTION OF THE HOTEL INDUSTRY IN INDIA USING KANO MODEL & QFD PARUL GUPTA & R. K. SRIVASTAVA
74
15. BEHAVIOUR OF STOCK MARKET VOLATILITY IN DEVELOPING COUNTRIES DR. S. S. CHAHAL & SUMAN
82
16. FINANCIAL DERIVATIVES IN INDIA: DEVELOPMENT PATTERN AND TRADING IMPACT ON THE VOLATILITY OF NSE E.V.P.A.S.PALLAVI & DR. P. S. RAVINDRA
89
17. CHANGING FACE OF CAR MARKET: A REVIEW OF MARKET GROWTH AND CHANGING SALES TRENDS IN INDIAN PASSENGER CAR MARKET
DEEPTHI SANKAR & DR. ZAKKARIYA K.A.
94
18. PERFORMANCE APPRAISAL: ALIGNING PERSONAL ASPIRATIONS TO ORGANIZATIONAL GOALS (A SPECIAL REFERENCE TO DAIRY SECTOR IN RAJASTHAN)
DR. SHWETA TIWARI (MISHRA)
99
19. INDIA’S BANKING SECTOR REFORMS FROM THE PERSPECTIVE OF BANKING SYSTEM RAJESH GARG & ASHOK KUMAR
103
20. INFORMATION TECHNOLOGY AND COMMUNICATION IN BUSINESS C. ARUL VENKADESH
108
21. IMPACT OF ORGANIZED RETAIL ON UNORGANIZED SECTOR: A STUDY IN JAMMU REGION URVASHI GUPTA
112
22. ISLAMIC BANKING IN INDIA: RELIGIOUS AND SOCIO-ECONOMIC PERSPECTIVES AFFECTING MUSLIM INVESTORS OF AHMEDABAD DISTRICT IN GUJARAT
URVI AMIN
116
23. ICT DEVELOPMENT IN INDIA: A CASE STUDY OF INFOSYS LTD. MUNISH KUMAR TIWARI
122
24. DATA WAREHOUSING AND TESTING
VENKATESH RAMASAMY & ABINAYA MURUGANANDHAN
130
25. POLITICAL IMPACT OF MICRO FINANCE ON RURAL POOR IN ANDHRA PRADESH DR. NANU LUNAVATH
135
VOLUME NO. 2 (2012), ISSUE NO. 1 (JANUARY) ISSN2231-5756
INTERNATIONAL JOURNAL OF RESEARCH IN COMMERCE, IT & MANAGEMENT
CHIEF PATRON
PROF. K. K. AGGARWAL
Chancellor, Lingaya’s University, Delhi
Founder Vice-Chancellor, Guru Gobind Singh Indraprastha University, Delhi
Ex. Pro Vice-Chancellor, Guru Jambheshwar University, Hisar
PATRON
SH. RAM BHAJAN AGGARWAL
Ex. State Minister for Home & Tourism, Government of Haryana
Vice-President, Dadri Education Society, Charkhi Dadri
President, Chinar Syntex Ltd. (Textile Mills), Bhiwani
CO-ORDINATOR
AMITA
Faculty, Government M. S., Mohali
ADVISORS
DR. PRIYA RANJAN TRIVEDI
Chancellor, The Global Open University, Nagaland
PROF. M. S. SENAM RAJU
Director A. C. D., School of Management Studies, I.G.N.O.U., New Delhi
PROF. M. N. SHARMA
Chairman, M.B.A., Haryana College of Technology & Management, Kaithal
PROF. S. L. MAHANDRU
Principal (Retd.), Maharaja Agrasen College, Jagadhri
EDITOR
PROF. R. K. SHARMA
Professor, Bharti Vidyapeeth University Institute of Management & Research, New Delhi
CO-EDITOR
DR. BHAVET
Faculty, M. M. Institute of Management, Maharishi Markandeshwar University, Mullana, Ambala, Haryana
EDITORIAL ADVISORY BOARD
DR. RAJESH MODI
Faculty, Yanbu Industrial College, Kingdom of Saudi Arabia
PROF. SANJIV MITTAL
University School of Management Studies, Guru Gobind Singh I. P. University, Delhi
PROF. ANIL K. SAINI
Chairperson (CRC), Guru Gobind Singh I. P. University, Delhi
DR. SAMBHAVNA
Faculty, I.I.T.M., Delhi
DR. MOHENDER KUMAR GUPTA
VOLUME NO. 2 (2012), ISSUE NO. 1 (JANUARY) ISSN2231-5756
DR. SHIVAKUMAR DEENE
Asst. Professor, Government F. G. College Chitguppa, Bidar, Karnataka
MOHITA
Faculty, Yamuna Institute of Engineering & Technology, Village Gadholi, P. O. Gadhola, Yamunanagar
ASSOCIATE EDITORS
PROF. NAWAB ALI KHAN
Department of Commerce, Aligarh Muslim University, Aligarh, U.P.
PROF. ABHAY BANSAL
Head, Department of Information Technology, Amity School of Engineering & Technology, Amity University, Noida
PROF. A. SURYANARAYANA
Department of Business Management, Osmania University, Hyderabad
DR. ASHOK KUMAR
Head, Department of Electronics, D. A. V. College (Lahore), Ambala City
DR. SAMBHAV GARG
Faculty, M. M. Institute of Management, Maharishi Markandeshwar University, Mullana, Ambala, Haryana
DR. V. SELVAM
Divisional Leader – Commerce SSL, VIT University, Vellore
DR. PARDEEP AHLAWAT
Reader, Institute of Management Studies & Research, Maharshi Dayanand University, Rohtak
S. TABASSUM SULTANA
Asst. Professor, Department of Business Management, Matrusri Institute of P.G. Studies, Hyderabad
SURJEET SINGH
Asst. Professor, Department of Computer Science, G. M. N. (P.G.) College, Ambala Cantt.
TECHNICAL ADVISOR
AMITA
Faculty, Government H. S., Mohali
MOHITA
Faculty, Yamuna Institute of Engineering & Technology, Village Gadholi, P. O. Gadhola, Yamunanagar
FINANCIAL ADVISORS
DICKIN GOYAL
Advocate & Tax Adviser, Panchkula
NEENA
Investment Consultant, Chambaghat, Solan, Himachal Pradesh
LEGAL ADVISORS
JITENDER S. CHAHAL
Advocate, Punjab & Haryana High Court, Chandigarh U.T.
CHANDER BHUSHAN SHARMA
Advocate & Consultant, District Courts, Yamunanagar at Jagadhri
SUPERINTENDENT
VOLUME NO. 2 (2012), ISSUE NO. 1 (JANUARY) ISSN2231-5756
INTERNATIONAL JOURNAL OF RESEARCH IN COMMERCE, IT & MANAGEMENT
CALL FOR MANUSCRIPTS
Weinvite unpublished novel, original, empirical and high quality research work pertaining to recent developments & practices in the area of Computer, Business, Finance, Marketing, Human Resource Management, General Management, Banking, Insurance, Corporate Governance and emerging paradigms in allied subjects like Accounting Education; Accounting Information Systems; Accounting Theory & Practice; Auditing; Behavioral Accounting; Behavioral Economics; Corporate Finance; Cost Accounting; Econometrics; Economic Development; Economic History; Financial Institutions & Markets; Financial Services; Fiscal Policy; Government & Non Profit Accounting; Industrial Organization; International Economics & Trade; International Finance; Macro Economics; Micro Economics; Monetary Policy; Portfolio & Security Analysis; Public Policy Economics; Real Estate; Regional Economics; Tax Accounting; Advertising & Promotion Management; Business Education; Business Information Systems (MIS); Business Law, Public Responsibility & Ethics; Communication; Direct Marketing; E-Commerce; Global Business; Health Care Administration; Labor Relations & Human Resource Management; Marketing Research; Marketing Theory & Applications; Non-Profit Organizations; Office Administration/Management; Operations Research/Statistics; Organizational Behavior & Theory; Organizational Development; Production/Operations; Public Administration; Purchasing/Materials Management; Retailing; Sales/Selling; Services; Small Business Entrepreneurship; Strategic Management Policy; Technology/Innovation; Tourism, Hospitality & Leisure; Transportation/Physical Distribution; Algorithms; Artificial Intelligence; Compilers & Translation; Computer Aided Design (CAD); Computer Aided Manufacturing; Computer Graphics; Computer Organization & Architecture; Database Structures & Systems; Digital Logic; Discrete Structures; Internet; Management Information Systems; Modeling & Simulation; Multimedia; Neural Systems/Neural Networks; Numerical Analysis/Scientific Computing; Object Oriented Programming; Operating Systems; Programming Languages; Robotics; Symbolic & Formal Logic and Web Design. The above mentioned tracks are only indicative, and not exhaustive.
Anybody can submit the soft copy of his/her manuscript anytime in M.S. Word format after preparing the same as per our submission guidelines duly available on our website under the heading guidelines for submission, at the email addresses: [email protected]or [email protected].
GUIDELINES FOR SUBMISSION OF MANUSCRIPT
1. COVERING LETTER FOR SUBMISSION:
DATED: _____________
THE EDITOR
IJRCM
Subject: SUBMISSION OF MANUSCRIPT IN THE AREA OF .
(e.g. Finance/Marketing/HRM/General Management/Economics/Psychology/Law/Computer/IT/Engineering/Mathematics/other, please specify)
DEAR SIR/MADAM
Please find my submission of manuscript entitled ‘___________________________________________’ for possible publication in your journals.
I hereby affirm that the contents of this manuscript are original. Furthermore, it has neither been published elsewhere in any language fully or partly, nor is it under review for publication elsewhere.
I affirm that all the author (s) have seen and agreed to the submitted version of the manuscript and their inclusion of name (s) as co-author (s).
Also, if my/our manuscript is accepted, I/We agree to comply with the formalities as given on the website of the journal & you are free to publish our contribution in any of your journals.
NAME OF CORRESPONDING AUTHOR:
Designation:
Affiliation with full address, contact numbers & Pin Code: Residential address with Pin Code:
Mobile Number (s): Landline Number (s): E-mail Address: Alternate E-mail Address:
NOTES:
a) The whole manuscript is required to be in ONE MS WORD FILE only (pdf. version is liable to be rejected without any consideration), which will start from the covering letter, inside the manuscript.
b) The sender is required to mention the following in the SUBJECT COLUMN of the mail:
New Manuscript for Review in the area of (Finance/Marketing/HRM/General Management/Economics/Psychology/Law/Computer/IT/ Engineering/Mathematics/other, please specify)
c) There is no need to give any text in the body of mail, except the cases where the author wishes to give any specific message w.r.t. to the manuscript. d) The total size of the file containing the manuscript is required to be below 500 KB.
e) Abstract alone will not be considered for review, and the author is required to submit the complete manuscript in the first instance.
f) The journal gives acknowledgement w.r.t. the receipt of every email and in case of non-receipt of acknowledgment from the journal, w.r.t. the submission of manuscript, within two days of submission, the corresponding author is required to demand for the same by sending separate mail to the journal. 2. MANUSCRIPT TITLE: The title of the paper should be in a 12 point Calibri Font. It should be bold typed, centered and fully capitalised.
3. AUTHOR NAME (S) & AFFILIATIONS: The author (s) full name, designation, affiliation (s), address, mobile/landline numbers, and email/alternate email address should be in italic & 11-point Calibri Font. It must be centered underneath the title.
VOLUME NO. 2 (2012), ISSUE NO. 1 (JANUARY) ISSN2231-5756
5. KEYWORDS: Abstract must be followed by a list of keywords, subject to the maximum of five. These should be arranged in alphabetic order separated by commas and full stops at the end.
6. MANUSCRIPT: Manuscript must be in BRITISH ENGLISH prepared on a standard A4 size PORTRAIT SETTING PAPER. It must be prepared on a single space and single column with 1” margin set for top, bottom, left and right. It should be typed in 8 point Calibri Font with page numbers at the bottom and centre of every page. It should be free from grammatical, spelling and punctuation errors and must be thoroughly edited.
7. HEADINGS: All the headings should be in a 10 point Calibri Font. These must be bold-faced, aligned left and fully capitalised. Leave a blank line before each heading.
8. SUB-HEADINGS: All the sub-headings should be in a 8 point Calibri Font. These must be bold-faced, aligned left and fully capitalised. 9. MAIN TEXT: The main text should follow the following sequence:
INTRODUCTION
REVIEW OF LITERATURE
NEED/IMPORTANCE OF THE STUDY
STATEMENT OF THE PROBLEM
OBJECTIVES
HYPOTHESES
RESEARCH METHODOLOGY
RESULTS & DISCUSSION
FINDINGS
RECOMMENDATIONS/SUGGESTIONS
CONCLUSIONS
SCOPE FOR FURTHER RESEARCH
ACKNOWLEDGMENTS
REFERENCES
APPENDIX/ANNEXURE
It should be in a 8 point Calibri Font, single spaced and justified. The manuscript should preferably not exceed 5000 WORDS.
10. FIGURES &TABLES: These should be simple, centered, separately numbered & self explained, and titles must be above the table/figure. Sources of data should be mentioned below the table/figure. It should be ensured that the tables/figures are referred to from the main text.
11. EQUATIONS: These should be consecutively numbered in parentheses, horizontally centered with equation number placed at the right.
12. REFERENCES: The list of all references should be alphabetically arranged. The author (s) should mention only the actually utilised references in the preparation of manuscript and they are supposed to follow Harvard Style of Referencing. The author (s) are supposed to follow the references as per the following:
•
All works cited in the text (including sources for tables and figures) should be listed alphabetically.•
Use (ed.) for one editor, and (ed.s) for multiple editors.•
When listing two or more works by one author, use --- (20xx), such as after Kohl (1997), use --- (2001), etc, in chronologically ascending order.•
Indicate (opening and closing) page numbers for articles in journals and for chapters in books.•
The title of books and journals should be in italics. Double quotation marks are used for titles of journal articles, book chapters, dissertations, reports, working papers, unpublished material, etc.•
For titles in a language other than English, provide an English translation in parentheses.•
The location of endnotes within the text should be indicated by superscript numbers.PLEASE USE THE FOLLOWING FOR STYLE AND PUNCTUATION IN REFERENCES: BOOKS
•
Bowersox, Donald J., Closs, David J., (1996), "Logistical Management." Tata McGraw, Hill, New Delhi.•
Hunker, H.L. and A.J. Wright (1963), "Factors of Industrial Location in Ohio" Ohio State University, Nigeria.CONTRIBUTIONS TO BOOKS
•
Sharma T., Kwatra, G. (2008) Effectiveness of Social Advertising: A Study of Selected Campaigns, Corporate Social Responsibility, Edited by David Crowther & Nicholas Capaldi, Ashgate Research Companion to Corporate Social Responsibility, Chapter 15, pp 287-303.JOURNAL AND OTHER ARTICLES
•
Schemenner, R.W., Huber, J.C. and Cook, R.L. (1987), "Geographic Differences and the Location of New Manufacturing Facilities," Journal of Urban Economics, Vol. 21, No. 1, pp. 83-104.CONFERENCE PAPERS
•
Garg, Sambhav (2011): "Business Ethics" Paper presented at the Annual International Conference for the All India Management Association, New Delhi, India, 19–22 June.UNPUBLISHED DISSERTATIONS AND THESES
•
Kumar S. (2011): "Customer Value: A Comparative Study of Rural and Urban Customers," Thesis, Kurukshetra University, Kurukshetra.ONLINE RESOURCES
•
Always indicate the date that the source was accessed, as online resources are frequently updated or removed.WEBSITE
VOLUME NO. 2 (2012), ISSUE NO. 1 (JANUARY) ISSN2231-5756
INTERNATIONAL JOURNAL OF RESEARCH IN COMMERCE, IT & MANAGEMENT
PERCEIVED PURCHASE RISK IN THE TECHNOLOGICAL GOODS PURCHASE CONTEXT: AN INSTRUMENT
DEVELOPMENT AND VALIDATION
IMAM SALEHUDIN
LECTURER
DEPARTMENT OF MANAGEMENT
FACULTY OF ECONOMICS
UNIVERSITY OF INDONESIA
UI-DEPOK CAMPUS
DEPOK-WEST JAVA
ABSTRACT
Each purchase decision is most likely to be a risky decision. Woodside and DeLozier (1976) proposed that consumer purchase-related behaviors correspond to the perceived level of risk in the purchase. Therefore, understanding consumer’s perceived purchase risk is paramount for marketers –especially marketers of high risk products. This study intends to develop a valid and reliable instrument in measuring consumer’s perceived purchase risk using the concept of perceived risk by Peter and Ryan (1976). This study does not intend to infer conclusions regarding the population of respondents used in the research, but only conclusions regarding the sample of items used in the instrument. The instrument was validated using two purchase context, smartphone and netbook purchase. An item is considered valid only if it tested valid in both contexts. The nomological validity of the instrument was tested using Confirmatory factor analysis as the primary method of analysis. Correlations between instruments were also tested to analyze convergent and concurrent validity of the instrument. This study employs LISREL for WINDOWS 8.51 Full Version (Jőreskog and Sőrbom, 2001) as software used for the analysis. The result of this study is that all instrument used in the study have good nomological validity. However, some item were found to be not valid in at least one purchase context, thus was excluded from the measurement model. The newly developed instrument has better convergent validity, even though with slightly weaker concurrent validity than existing instrument.
KEYWORDS
Instrument Validation, Perceived Purchase Risk, Technological Goods.
BACKGROUND
enerally in a planned purchase decision, rational buyers would only buy a certain product if the total benefit to be received from the purchase is greater than the total cost of the purchase. While for cases where there is more than one choice of products that offers the same functionality, the buyer would tend to choose the product with the greatest benefit/cost ratio (Perreault, Cannon and McCarthy, 2008).
However, in most cases the actual benefits of a product can only be known after the product is purchased and consumed. Meanwhile, the seller can promise a variety of benefits to prospective buyers that increase expectations but in reality might not be realized by the product. Therefore, in most purchase decision -especially for initial purchase decisions- consumers will generally face a certain degree of uncertainty whether the benefits to be received from the purchase will at least be equal to the benefit expected.
Simonson (1992) and Anderson (2003) concluded that when faced with purchasing situations perceived as uncertain or high-risk, potential buyers tends to delay or cancel their purchase to wait for other alternatives that are perceived to have lower risk. Simonson (1992) adds that consumers who experience greater anticipated regret will tend to choose a safe decision to purchase products that are already known and can be justified. One way for buyers justify a purchase is by looking at the brands or product prices as an indicator of quality or just buy the products sold in stores that have a high image quality (Tan, 1999).
Weber and Milliman (1997) concluded that a stable personality trait exists which influences how much risk a prospective buyer is willing to take. This personality trait determines the threshold of risk acceptable to the prospective buyer. If the perceived Purchase Risk by the prospective buyer is greater than the risk he is willing to bear, then he will not make the purchase. Conversely, if the Purchase Risk perceived by the prospective buyer is still within the limit he is willing to bear, then he would be willing to make the purchase. Thus it can be concluded that the consumer purchase decision is dependent to a certain level by how much risk (uncertainty) the consumer perceived (Weber and Milliman, 1997; Chuang and Lin, 2007).
Therefore, it is important for a marketer who wants to increase sales of its products to gain better understanding on how potential buyers perceive the uncertainty or the risk of purchasing the products being sold. With this understanding, a marketer can develop communication strategies that reduce the perceived purchase risk of prospective buyers, thereby reducing the likelihood of a prospective buyer to postpone or cancel the purchase.
LITERATURE REVIEW
The construct of perceived risk has several fundamental differences with the construct of consumer satisfaction, which have been more commonly used in market surveys and included in purchase decision-making models. Although both can be regarded as a factor influencing consumer purchasing decisions, the construct of consumer satisfaction is the result of cognitive and affective evaluation of the consumers towards their past experience of a certain purchase (Dube-Rioux, 1990). On the other hand, the construct of risk perception is basically a consumer expectation of a future purchase not yet experienced (Ha, 2002). Therefore, the construct of perceived risk can be used to predict purchase decisions for consumers who have never purchased a product (initial purchase) as well as consumers with prior experience of purchasing the product (repeat purchase), while customer satisfaction can not be used to predict the initial purchase of potential buyer. Thus, the construct of risk perception would be very beneficial for manufacturers who want to launch a new product and need information on the potential purchase of a target market that has never had the experience of buying a similar product.
Existing measurement instruments for Perceived Purchase Risk are generally composed of a number of questions that directly ask the overall perceived risk perception prospective buyers, although there has been some instruments that measures more than one dimension of risk perception (Jacoby and Kaplan, 1972). However, these measurements tend to be done with the limited theoretical assessment process and only measures perceptions as a unidimensional construct (Dowling, 1985; Tan, 1999, Corbitt, 2003; Tiangsoongnern, 2007). Meanwhile, only few recent studies uses multidimensional approach by doing the operational definition of constructs based on the findings of Jacoby and Kaplan (1972) to identify the dimensions of Perceived Purchase Risk (Chang and Chen, 2008; Kim, Kim and Hwang, 2009).
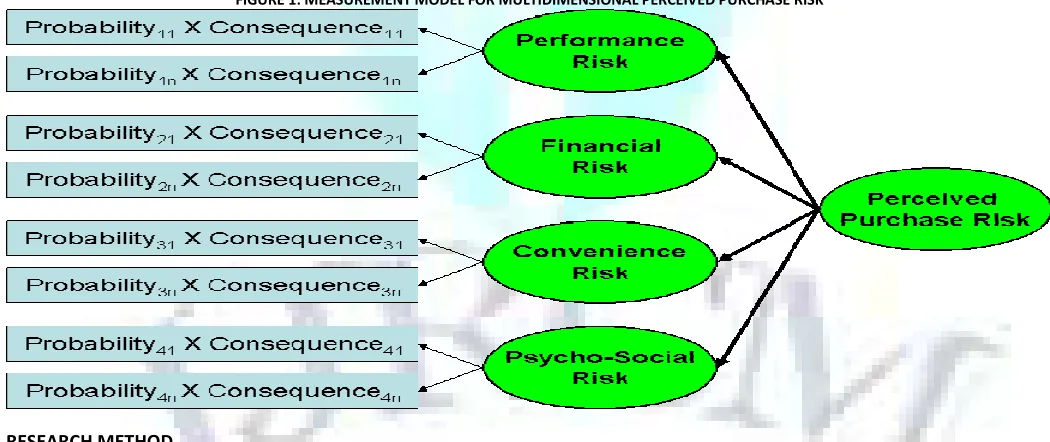
Jacoby and Kaplan (1976) identified at least six dimensions of consumers’ perceived purchase risk. Their finding has been confirmed by the findings of other researchers, thus obtained the following six dimensions of risk (Jacoby and Kaplan, 1976; Laroche et al., 2004; Chang and Chen, 2008; Kim, Kim and Hwang, 2009):
1. Performance Risk: Consumer perceptions of risks that the functional attributes of the product can not satisfy their needs. 2. Financial Risk: Consumer perceptions of risks that the purchase of the product will cause financial losses.
3. Physical Risk: Consumer perceptions of risks that the product purchased can injure their physical wellbeing.
4. Convenience Risk: Consumer perceptions of risks that the product purchased takes a lot of time and effort to repair and adjust before it can be used. 5. Social Risk: Consumer perceptions of risks that the product purchased may adversely affect the views of others towards them.
VOLUME NO. 2 (2012), ISSUE NO. 1 (JANUARY) ISSN2231-5756 6. Psychological Risk: Consumer perceptions of risks that the product purchased will interfere with their view of themselves.
Each dimension of Perceived Purchase Risk may have different significance for different products or purchase context. For example, the perception of physical risk is more dominant than the social and financial risk in the purchase of over the counter medicinal products, while social risk perception is more dominant than physical and financial risks in the purchase of fashion products (Jacoby and Kaplan, 1976).
In certain purchase situation, some risk dimensions may not be needed to be measured. This is because each dimension is product-specific and independent among each other (Laroche et al, 2004). Focused Group Discussions conducted to explore the purchase decision in the context of laptops, netbooks and smartphones purchase discovered that prospective buyers does not place much importance in the dimension of physical risk as the products are perceived to have less impact on physical safety (Fuziah et al., 2010; Pratama et al., 2010). Meanwhile, the dimensions of Psychological and Social Risk can be combined into a single dimension as the Psycho-Social Risk dimension (Gewald et al, 2006). Thus, four dimensions identified above are included in this research as sub-factors for the construct of Perceived Purchase Risk.
Various measurement approaches have been used by in previous researches, thus selecting the measurement approach used in the study is also an important decision. Peter and Ryan (1976) developed the concept of expected utility of Bernoulli (1938) to formulate the concept of risk. He defines risk as a function of multiplying the probability of occurrence of an event with undesirable consequences to the expected magnitude of the undesirable consequence, thus obtained the following equation:
PR = Σ (PLi * ECi) (1)
PR = Perceived Risk PL = Probability of Loss EC = Expected Consequence i = Risk Dimension
Based on the above formula, a prospective buyer will perceive that there is a substantial risk only if: (1) there is a great likelihood that losses will occur, and (2) the consequences of these losses are perceived important by prospective buyers. Conversely, if at least one component is perceived as insubstantial, then the Purchase Risk will also be perceived by the potential buyers as insubstantial.
This formulation of risk concept can be considered as more comprehensive in explaining the perception and behavior of buyers than the concept of risk perception that only considered the perceived probability of loss without taking into account the level of the subjective importance of the consequences of a loss. Therefore, measurement approach of risk perception using two components of risk -probability perceptions and expectations of the consequences- should be more valid in measuring risk perceptions and explain the behavior of potential buyers. However, no research using this approach to measure perceptions of risk have been observed. Therefore, this research is interested in developing the measurement of Perceived Purchase Risk based on the approach by Peter and Ryan (1976) and comparing it with measurements based on the approach that has been used previously.
Newly developed instruments should be tested first for its validity before it can be used in practical applications such as market surveys. The validation test consists of construct, convergent and concurrent validity (Anastasi and Urbina, 1997; Domino and Domino, 2006). Meanwhile, the purchase contexts selected for the validation is the purchase context of technological items or gadgets, such as: laptops, netbooks, and smartphones. The purchase context selection is based the characteristic of the product category in which technological products have a lot of product variety, with new products introduced regularly and rapidly, and usually is quite expensive. Thus, purchase decision for technological items, such as netbooks and smartphones, can be considered as risky decisions in which Perceived Purchase Risk may play a significant role in the purchase decision.
In order to develop valid measurement for Perceived Purchase Risk for all contexts of products and purchases, it is necessary to test the validity of the instrument in more than one the contexts of different products. Therefore, two product contexts were selected for the validation, which are Netbook and Smartphones. Thus, the in order to be considered valid, the items would have to be valid in both product contexts. Accordingly, based on the literature reviews above, the following measurement model of Perceived Purchase Risk was obtained:
FIGURE 1: MEASUREMENT MODEL FOR MULTIDIMENSIONAL PERCEIVED PURCHASE RISK
RESEARCH METHOD
The validity of an instrument can be seen by more than one approach. The first approach to validity is the content validity, which sees the validity of an instrument as whether the instrument covered sufficient dimensions of the construct to be measured. Two components of content validity are the representativeness and relevance of the measurement instrument’s contents.
The second approach to validity is the construct validity, in which the validity of an instrument in seen as whether the results obtained from the tested instrument corresponds with the pattern of a particular theory about the construct intended to be measured (Domino and Domino, 2006). One method commonly used in analyzing this type of validity is by using a statistical method called confirmatory factor analysis. This method tests whether the data obtained from measurements can support the model developed from the theory of the construct to be measured (Chadha, 2009).
VOLUME NO. 2 (2012), ISSUE NO. 1 (JANUARY) ISSN2231-5756
INTERNATIONAL JOURNAL OF RESEARCH IN COMMERCE, IT & MANAGEMENT
While the fourth approach of validity is the criterion validity, which sees the validity of an instrument as the correlation between its result to the measurement result of other instruments which measure different constructs, but in theory corresponds to the construct intended to be measured (Anastasi and Urbina, 1997). If the result of the corresponding instruments is obtained simultaneously, then the validity is called concurrent validity.
Data collection process yields 159 respondents for Smartphone purchase and 141 respondents for Netbook purchase. Data was collected from undergraduate students, with an age range between 19 and 23 and monthly expenditures between Rp.500.000 and Rp.1.000.000. Gender proportion between respondents of Smartphone is 36% male and 64% female, while proportion for Netbook is 44% males and 56% females. Ownership proportion between respondents of Smartphone is 58% owners and 42% non-owners, while proportion for Netbook is 73% owners and 27% non-owners.
Purchase Intention was selected as validation construct for testing concurrent validity of Unidimensional and Multidimensional Perceived Purchase Risk instrument. Selection is based on the results of previous studies which concluded that significant relationship exists between risk perceptions and purchasing decisions (Weber and Milliman, 1997; Chuang and Lin, 2007; Simonson, 1992; Anderson, 2003).
Purchase Intention is defined as the propensity of consumers to buy a particular item. In the context of a planned purchase, purchase intention is the result of consumer evaluation of the elements of consideration, whether is favorable and unfavorable towards the purchase. The following is a summary of the operational definition of the measurement variables used in this study:
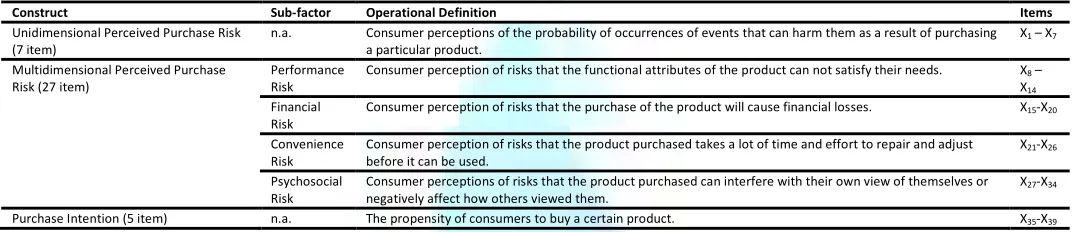
TABLE 1: OPERATIONAL DEFINITION OF RESEARCH VARIABLES
Construct Sub-factor Operational Definition Items
Unidimensional Perceived Purchase Risk (7 item)
n.a. Consumer perceptions of the probability of occurrences of events that can harm them as a result of purchasing
a particular product.
X1 – X7
Multidimensional Perceived Purchase Risk (27 item)
Performance Risk
Consumer perception of risks that the functional attributes of the product can not satisfy their needs. X8 –
X14
Financial Risk
Consumer perception of risks that the purchase of the product will cause financial losses. X15-X20
Convenience Risk
Consumer perception of risks that the product purchased takes a lot of time and effort to repair and adjust before it can be used.
X21-X26
Psychosocial Risk
Consumer perceptions of risks that the product purchased can interfere with their own view of themselves or negatively affect how others viewed them.
X27-X34
Purchase Intention (5 item) n.a. The propensity of consumers to buy a certain product. X35-X39
Note: item contents is shown in the Appendix
Confirmatory factor analysis (CFA) was used in this study to test the hypotheses and answering the research questions. This CFA is a multivariate statistical method that aims to deductively test the existence of certain structures or intercorrelated patterns between variables in a set of data, based on certain hypotheses set prior to the testing. The hypothesis tested might be obtained from existing models and theories. ‘LISREL 8:51 for WINDOWS Full Version’ (Jőreskog and Sőrbom, 2001) software was used to run the confirmatory factor analysis.
The first step of validation analysis is to see whether the measurement model is acceptable. This is proven when there are significant differences between the correlations matrix obtained from the data and the correlations matrix based on the model specification. If there is no significant difference, then it can be concluded that the measurement model is acceptable or the model is fit. The difference is tested using the statistical significance of chi-square with alpha 5%. If the p-value of the chi-square statistics is above 00:05, then it can be concluded that the measurement model is acceptable.
The second step is to see whether there are items that are not valid in measuring the construct being measured. An item can be considered valid only if it has factor loading with t-values greater than +1.96 or lesser than -1.96. However, since all items used in the questionnaire are favorable items, the range of t-values accepted are limited only to t-value above 1.96. Items that are found to be not valid will be excluded from the measurement model to obtain the measurement set that is completely valid. Researchers also see and compare the quality of items from each construct by calculating the reliability and extent of crossloading for each item.
The third step is testing the concurrent and convergent validity of the instrument by looking at the correlations between constructs and between instruments of the same construct. The instrument is considered to have good convergent validity if it has significant correlation to the measurements of other instrument that measures the same construct. While the instrument is considered to have good concurrent validity if it has significant correlation to the measurements of other instruments that measure constructs that theoretically are correlated to the constructs measured by instruments like the first.
Each step of the validity analysis will also compare the validity of items between Smartphone and Netbook purchase context. The purpose of this comparison is to determine whether the validity of each item is consistent across both product contexts. Items will only be considered valid for general use in the context of technological goods purchase if it consistently qualifies in both purchase contexts.
RESULT AND DISCUSSION
The initial test for the Unidimensional Perceived Purchase Risk construct did not yield measurement models with a good fit. Model testing for Netbook purchase yields chi-square value of 64.12, while Smartphone purchase yields chi-square value of 126.96 with degree of freedom (df) for both contexts is 14. Testing the significance of chi-square value yields p-value of under 0.05, which means that the model was rejected because significant differences exists between the correlation matrix obtained from the data with the correlation matrix specified from the model.
The initial testing also yields t-values for each item factor loading as well as modification index, a set of recommendations for additional specification for error covariances between item errors. Modifications were performed by removing non-valid items and adding several error covariances according to the modification index. Since the objective is to obtain items valid in both purchase context, two items –PRD and PRE– were eliminated from both contexts because they were considered non valid in the Netbook purchase context. Item loadings and t-values from the initial model testing are shown in Table 2, while item contents are shown in the Appendix.
Testing the modified measurement model yields chi-square value of 5.80 with degree of freedom of 4 for Netbook purchase and chi-square value of 14.57 with degree of freedom of 10 for Smartphone purchase. Thus, the model yields p-values of 0.214 and 0.148 for the context of Netbook and Smartphone purchases respectively. Therefore, the modified measurement model for both contexts was accepted.
TABLE 2: ITEM VALIDITY FOR UNIDIMENSIONAL PERCEIVED PURCHASE RISK CONSTRUCT
ITEM SMARTPHONE NETBOOK
SLF SE T-VAL SIG SLF SE T-VAL SIG
PRA 0.68 0.53 9.01 Significant 0.68 0.54 8.24 Significant PRB 0.60 0.64 7.64 Significant 0.72 0.48 8.97 Significant PRC 0.61 0.62 7.90 Significant 0.78 0.39 9.99 Significant PRD 0.59 0.65 7.49 Significant 0.28 0.92 1.60 Not Significant PRE 0.61 0.63 7.77 Significant 0.22 0.95 1.01 Not Significant PRF 0.64 0.59 8.33 Significant 0.56 0.69 6.59 Significant PRG 0.85 0.32 12.00 Significant 0.78 0.39 9.87 Significant
VOLUME NO. 2 (2012), ISSUE NO. 1 (JANUARY) ISSN2231-5756 The second measurement instrument tested was the construct validity of the Multidimensional Perceived Purchase Risk, which divided Perceived Purchase Risk into four risk dimensions. The test was conducted by using 2nd order Confirmatory Factor Analysis in order to test the construct’s multidimensionality as well as
the construct validity of the measurement.
The initial test for the Multidimensional Perceived Purchase Risk construct did not yield measurement models with a good fit. Model testing generated chi-square value of 612.63 for Netbook purchase and 733.19 for Smartphone purchase, with degree of freedom for both contexts are 320. Testing the significance of chi-square value yields p-value of under 0.05, which means that the model was rejected.
Modifications were performed by removing non-valid items and adding several error covariances according to the modification index. Testing both modified measurement models yields chi-square value of 113.78 with degree of freedom of 94 for Netbook purchase and chi-square value of 180.21 with degree of freedom of 157 for Smartphone purchase. Thus, the test obtained p-values of 0.08 and 0.09 for the context of Netbook and Smartphone purchases, respectively. Since both measurement model yields p-values greater than 0.05, therefore the modified measurement model for both contexts was accepted.
The 2nd order Confirmatory Factor Analysis for the Multidimensional Perceived Purchase Risk construct yields validity index for dimensions as well as indicators.
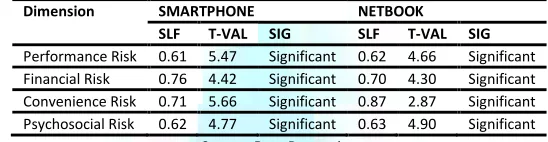
The secondary hypotheses tested from the construct of Multidimensional Perceived Purchase Risk is whether the validity of the four dimensions proposed in the model and the validity of each item of measurement is consistent in both product context. Based on this analysis, all four dimensions in the Multidimensional Perceived Purchase Risks are considered valid for both purchase contexts. Loading factors and t-values for each dimension are shown below in Table 3.
TABLE 3: DIMENSION VALIDITY FOR MULTIDIMENSIONAL PERCEIVED PURCHASE RISK CONSTRUCT
Dimension SMARTPHONE NETBOOK
SLF T-VAL SIG SLF T-VAL SIG
Performance Risk 0.61 5.47 Significant 0.62 4.66 Significant Financial Risk 0.76 4.42 Significant 0.70 4.30 Significant Convenience Risk 0.71 5.66 Significant 0.87 2.87 Significant Psychosocial Risk 0.62 4.77 Significant 0.63 4.90 Significant
Source: Data Processing
One indicator for Performance Risk dimension, PR4, was found to be not significant for both purchase contexts while three other items, PR5, PR6 and PR7, were invalidated in the Netbook purchase context. Thus, all four items must be excluded from the final measurement model. The standardized loading factor, standard error and t-values for Performance Risk measurements are shown in Table 4 while the content for each item are shown in the Appendix.
TABLE 4: ITEM VALIDITY FOR PERFORMANCE RISK DIMENSION
ITEM SMARTPHONE NETBOOK
SLF SE T-VAL SIG SLF SE T-VAL SIG
PR1 0.71 0.49 8.76 Significant 0.78 0.39 7.42 Significant PR2 0.78 0.39 9.67 Significant 0.70 0.51 7.06 Significant PR3 0.78 0.39 9.59 Significant 0.56 0.69 5.86 Significant PR4 0.22 0.95 1.19 Not Significant 0.25 0.94 1.36 Not Significant PR5 0.53 0.72 6.39 Significant 0.29 0.91 1.89 Not Significant PR6 0.59 0.65 7.12 Significant 0.28 0.92 1.73 Not Significant PR7 0.59 0.65 7.18 Significant 0.19 0.96 1.01 Not Significant
Source: Data Processing
Three indicators for Financial Risk dimension, FR1, FR2 and FR6, were invalidated in both purchase contexts. Thus, all three items must be excluded from the final measurement model. The standardized loading factor, standard error and t-values for Financial Risk measurements are shown in Table 5 while the content for each item are shown in the Appendix.
TABLE 5: ITEM VALIDITY FOR FINANCIAL RISK DIMENSION
ITEM SMARTPHONE NETBOOK
SLF SE T-VAL SIG SLF SE T-VAL SIG
FR1 0.25 0.94 1.75 Not Significant 0.14 0.98 1.01 Not Significant FR2 0.12 0.99 0.98 Not Significant 0.20 0.96 1.60 Not Significant FR3 0.69 0.52 6.42 Significant 0.72 0.48 6.54 Significant FR4 0.95 0.10 6.51 Significant 0.64 0.59 6.04 Significant FR5 0.58 0.66 5.74 Significant 0.78 0.39 6.75 Significant FR6 -0.15 0.98 -1.02 Not Significant -0.18 0.97 -1.06 Not Significant
Source: Data Processing
One indicator for Convenience Risk dimension, CR6, was found to be not significant for both purchase contexts while one other item, CR5, was invalidated in the Netbook purchase context. Thus, both items must be excluded from the final measurement model. The standardized loading factor, standard error and t-values for Convenience Risk measurements are shown in Table 6 while the content for each item are shown in the Appendix.
TABLE 6: ITEM VALIDITY FOR CONVENIENCE RISK DIMENSION
ITEM SMARTPHONE NETBOOK
SLF SE T-VAL SIG SLF SE T-VAL SIG
CR1 0.86 0.26 8.65 Significant 0.78 0.39 3.57 Significant CR2 0.82 0.33 9.77 Significant 0.82 0.33 3.76 Significant CR3 0.78 0.39 9.22 Significant 0.88 0.23 3.81 Significant CR4 0.90 0.19 10.09 Significant 0.95 0.10 3.69 Significant CR5 0.92 0.15 10.14 Significant 0.15 0.98 0.48 Not Significant CR6 -0.35 0.88 -4.03 Not Significant -0.21 0.96 -1.43 Not Significant
Source: Data Processing
VOLUME NO. 2 (2012), ISSUE NO. 1 (JANUARY) ISSN2231-5756
INTERNATIONAL JOURNAL OF RESEARCH IN COMMERCE, IT & MANAGEMENT
TABLE 7: ITEM VALIDITY FOR PSYCHOSOCIAL RISK DIMENSION
ITEM SMARTPHONE NETBOOK
SLF SE T-VAL SIG SLF SE T-VAL SIG
SR1 -0.24 0.94 -2.65 Not Significant -0.35 0.88 -2.95 Not Significant SR2 0.11 0.99 1.82 Not Significant 0.16 0.97 1.91 Not Significant SR3 0.88 0.23 10.15 Significant 0.89 0.21 10.20 Significant SR4 0.86 0.26 10.17 Significant 0.91 0.17 10.48 Significant SR5 0.86 0.26 10.16 Significant 0.90 0.19 10.43 Significant SR6 0.90 0.19 10.31 Significant 0.75 0.44 8.64 Significant SR7 0.80 0.36 9.44 Significant 0.77 0.41 8.87 Significant SR8 0.69 0.52 8.27 Significant 0.64 0.59 7.38 Significant
Source: Data Processing
The third measurement model tested was the Purchase Intention construct. The initial model test did not produce good fit. Model testing generated chi-square value of 33.46 for Netbook purchase and 19.84 for Smartphone purchase, while degree of freedom obtained for both contexts is 5. Testing the significance of chi-square value yields p-value of under 0.05, which means that the model was rejected.
Modifications were conducted by removing non-valid items and adding several error covariances according to the modification index. Testing both modified measurement models yields chi-square value of 6.32 with degree of freedom of 3 for Netbook purchase and chi-square value of 5.04 with degree of freedom of 4 for Smartphone purchase. Thus, the test obtained p-values of 0.096 and 0.283 for the context of Netbook and Smartphone purchases, respectively. Since both measurement model yields p-values greater than 0.05, therefore the modified measurement model for both contexts was accepted. None of the indicators for Purchase Intention have t-values lower than 1.96 in either contexts, thus all indicators for Purchase Intention were confirmed to be valid. The standardized loading factor, standard error and t-values for Purchase Intention measurements are shown in Table 8 while the content for each item are shown in the Appendix.
TABLE 8: ITEM VALIDITY FOR PURCHASE INTENTION
ITEM SMARTPHONE NETBOOK
SLF SE T-VAL SIG SLF SE T-VAL SIG
PI1 0.82 0.28 12.11 Significant 0.83 0.3 11.76 Significant PI2 0.81 0.34 11.85 Significant 0.88 0.23 12.26 Significant PI3 0.83 0.3 12.44 Significant 0.84 0.29 11.46 Significant PI4 0.74 0.45 10.47 Significant 0.67 0.55 8.70 Significant PI5 0.85 0.28 12.71 Significant 0.77 0.41 10.49 Significant
Source: Data Processing
The last two measurement validity examined is the convergent and concurrent validity of the instrument. Convergent validity was measured by examining the correlation between scores from the newly developed instrument with scores from existing instrument that measures the same construct, while concurrent validity was measured by looking at the correlation between scores from the newly developed instrument with scores from existing instrument that measured a theoretically-related construct.
The correlations between the measurements scores was obtained from the standardized path coefficient between two constructs when processed in pairs while correlation significance was obtained from the t-value of the path between each pair (Hair et al., 2009). Result from correlating both Unidimensional and Multidimensional Perceived Purchase Risk measurement scores indicated that both measurement have significant positive correlation for both purchase contexts (r=0.75, t=5.50 for Smartphone; r=0.74, t=5.63 for Netbook). This means that the newly developed measurement instrument has good convergent validity.
Result from correlating Multidimensional Perceived Purchase Risk with Purchase Intention measurement scores indicate that both measurement have significant negative correlation for both purchase contexts (r=-0.28, t=-2.83 for Smartphone; r=-0.19, t=-2.02 for Netbook). In contrast, result from correlating Unidimensional Perceived Purchase Risk with Purchase Intention measurement scores indicate that both measurement have stronger significant negative correlation for both purchase contexts (r=-0.33, t=-3.53 for Smartphone; r=-0.40, t=-4.12 for Netbook).
Both construct have significant negative correlations, which is consistent with existing theories that greater perceived risk increases the likelihood of a prospective buyer to postpone or cancel the purchase (Simonson, 1992; Anderson, 2003). This means that the newly developed measurement instrument also has good concurrent validity. However, it seems that the existing Unidimensional measurement still has greater concurrent validity than the newly developed measurement. Then again, this shortcoming is offset by more detailed information provided by the newly developed instrument. The complete score correlations results for both purchase contexts are shown in Table 9 below.
TABLE 9: STANDARDIZED CORRELATION COEFFICIENT
Correlations SMARTPHONE NETBOOK
UPPR MPPR PI UPPR MPPR PI
UPPR r t-value
1.00 n.a
1.00 n.a MPPR r
t-value 0.75 5.50 1.00 n.a 0.74 5.63 1.00 n.a
PI r
t-value -0.33 -3.53 -0.28 -2.83 1.00 n.a -0.40 -4.12 -0.19 -2.02 1.00 n.a Source: Data Processing
Notes:
UPPR: Unidimensional Perceived Purchase Risk MPPR: Multidimensional Perceived Purchase Risk PI: Purchase Intention
CONCLUSIONS
VOLUME NO. 2 (2012), ISSUE NO. 1 (JANUARY) ISSN2231-5756
TABLE 10: RECAPITULATION FOR GOODNESS OF FIT MEASUREMENTS
Fitness Measure SMARTPHONE NETBOOK
UPPR MPPR PI UPPR MPPR UPPR Target Value
χ2
(df)
14.57 (10)
180.21 (157)
5.04 (4)
5.80 (4)
113.78 (94)
6.32 (3)
n.a
p-value 0.148 0.098 0.283 0.214 0.080 0.096 ≥0.05
RMSEA 0.054 0.031 0.041 0.057 0.039 0.089 ≤0.08
Source: Data Processing
Second, some items in both the Unidimensional and Multidimensional Perceived Purchase Risk measurement were invalidated in one or both purchase context. Invalidated items can not be used in the measurement and must be removed from the instrument. Only significant items can be included in the measurement for future use.
Third, the newly developed Multidimensional Perceived Purchase Risk measurement has good convergent and concurrent validity. Thus, the measurement can be considered to be ready for practical use within the purchase context of technological gadgets such as Smartphones and Netbooks. The instrument can be utilized by manufacturers and marketers of technology products in market surveys to map psychographic consumer segments of potential markets. This instrument can be used to measure the risk perceptions of consumers towards the purchase of existing products on the market and also new products about to be launched by the manufacturers.
Fourth, although the newly developed Multidimensional Perceived Purchase Risk instrument has weaker concurrent validity than the Unidimensional Perceived Purchase Risk instrument developed by Corbitt et al. (2003), the new instrument provide more comprehensive information. Apart from the level of risk perceived by the consumer purchases, the new instrument may also provide more detailed information to identify aspects which are considered high risk by a segment of consumers targeted by the marketer.
Identifying risk factor as perceived as high risk by consumer is important since the likelihood of a prospective purchaser to seek additional information will be higher when faced with purchasing decisions perceived to have a higher risk (Cox, 1967; Capon and Burke, 1977; Locander and Hermann, 1979; Lutz and Reilly, 1973). Information sought by prospective buyers will be the information that may alleviate the risk they perceive. Meanwhile, the likelihood of a prospective buyer to postpone or cancel the purchase will be even greater if he can not find the information he sought. Therefore, marketers can use the information obtained from this instrument to develop the best communication strategies to reduce the perceived purchase risk by prospective buyers.
ACKNOWLEDGMENTS
The author expresses utmost gratitude to his supervisor, Dr. Jahja Umar, for his guidance in completing the thesis from which this paper is born.
REFERENCES
Anastasi, A. and Urbina, S. (1997) “Psychological Testing 7th Edition”. Upper Saddle River, N.J: Pearson Prentice Hall.
Anderson, C.J. (2003). “The Psychology of Doing Nothing: Forms of Decision Avoidance Result from Reason and Emotion”. Psychological Bulletin, 129 (1): 139– 167.
Chadha, N.K (2009) “Applied Psychometrics”. New Delhi, India: SAGE Publications India Pvt Ltd
Chang, H.H., and Chen, S.W. (2008). “The impact of online store environment cues on purchase intention: Trust and perceived risk as a mediator”. Emerald Insight, 32(6): 818-841.
Chuang, S-C. and Lin, H-M. (2007). “The Effect of Induced Positive and Negative Emotion and Openness-to-Feeling in Student’s Consumer Decision Making”.
Journal of Business Psychology, 22: 65–78
Corbitt, B. J., Thanasankit, T., and Yi, H., (2003). “Trust and E-commerce: a Study of Consumer Perceptions”, Electronic Commerce Research and Applications, 2(3): 203-215
Domino, G. and Domino, M.L. (2006). “Psychological Testing: an Introduction 2nd Edition”, Cambridge, U.K: Cambridge University Press.
Dowling, G.R. (1985). “The Effectiveness of Advertising Explicit Warranties”, Journal of Public Policy and Marketing, Vol. 4: 142-152.
Dube-Rioux, L. (1990), “The Power of Affective Reports in Predicting Satisfaction Judgments, in Advances in Consumer Research” Volume 17, ed.s Marvin E. Goldberg, Gerald Gorn, and Richard W. Pollay, Provo, UT: Association for Consumer Research, Pages: 571-576.
Fuziah, A., Larasari, B., Zumaroh, F., and Adytia, M. (2010) “Focus Group Discussion Report on Consumer Purchase Decision of Smartphones and Black Berry”, Unpublished
Gewald, H., Wüllenweber, K. and Weitzel, T. (2006). “The Influence of Perceived Risks on Banking Managers' Intention to Outsource Business Processes: A Study of The German Banking And Finance Industry”. Journal of Electronic Commerce Research, 7(2): 78-96.
Ha, H.-Y. (2002), “The Effects of Consumer Risk Perception on Pre-purchase Information in Online Auctions: Brand, Word-of-Mouth, and Customized Information”. Journal of Computer-Mediated Communication, 8:0. doi: 10.1111/j.1083-6101.2002.tb00160.
Hair, J. F., Black, W. C., Babin. B. J. and Anderson, R. E. (2009). “Multivariate Data Analysis” (7th Edition). New Jersey: Prentice Hall.
Jacoby, J. and Kaplan, L.B. (1972). “The Components of Perceived Risk”. Proceedings of the Third Annual Conference of the Association for Consumer Research, 1972: Association for Consumer Research, Pages: 382-393.
Jöreskog, K.G. and Sörbom, D. (2001) “LISREL 8.51”. Scientific Software International.
Kim, Y.H., Kim, D.J., and Hwang, Y. (2009) “Exploring Online Transaction Self-Efficacy in Trust Building in B2C E-Commerce”. Journal of Organizational and End User Computing, 21(1)
Laroche, M., McDougall, G., Bergeron, J., and Yang, C., (2004) “Exploring how intangibility affects perceived risk”. Journal of Services Research, 6 (4): 373-389 Perrault, W., Cannon, J. and McCarthy, E. (2008). “Basic Marketing: A Marketing Strategy Planning Approach”. 16th Edition
Peter, J.P. and Ryan, M. J. (1976) “An Investigation of Perceived Risk at the Brand Level”, Journal of Marketing Research, 13(2): pp. 184-188
Pratama, A., Bahtera, H., Anggara, B.Z., and Yolanda, V. (2010) “Focus Group Discussion Report on Consumer Purchase Decision of Laptops and Netbooks”, Unpublished
Salehudin, I. (2010) “Pengembangan dan Validasi Instrumen Pengukuran Persepsi Risiko Pembelian dalam Konteks Pembelian Barang Teknologi” (Development and Validation for Perceived Purchase Risk Measurement Instrument in the Context of Technological Goods Purchase). Thesis, University of Indonesia, Indonesia Simonson, I. (2009) “The Influence of Anticipating Regret and Responsibility on Purchase Decisions”, Journal of Consumer Research, 19(1): 105-118
Tan, S-J. (1999) “Strategies for reducing consumers- risk aversion in Internet shopping”. The Journal of Consumer Marketing. Santa Barbara: 16(2): 163
Tiangsoongnern, L. (2007) “An Examination of Perceived Risk and Trust as Determinants of Online Purchasing Behavior: A Study within The USA Gemstone Industry”. PhD Dissertation, Murdoch University, Australia.
VOLUME NO. 2 (2012), ISSUE NO. 1 (JANUARY) ISSN2231-5756
INTERNATIONAL JOURNAL OF RESEARCH IN COMMERCE, IT & MANAGEMENT
APPENDIX
LIST OF ITEMS
Note: S for Smartphone; N for Netbook
CODE ITEM VALID
MULTIDIMENSIONAL PERCEIVED PURCHASE RISK MEASUREMENT S N
PR1 The offered product might not provide the performance that I require Yes Yes
Produk yang ditawarkan mungkin tidak dapat memberikan performa yang saya butuhkan
PR2 The operating speed of this product might rapidly decreases Yes Yes
Kecepatan operasi produk ini mungkin akan berkurang dengan cepat
PR3 This product might not support applications that I may need Yes Yes
Produk ini mungkin tidak dapat mendukung aplikasi yang akan saya butuhkan
PR4 The offered product might not have a stable / consistent performance No No
Performa produk yang ditawarkan mungkin tidak stabil/konsisten
PR5 The offered product might not deliver the benefits promised by the seller Yes No
Produk ini mungkin tidak dapat memberikan manfaat yang sudah dijanjikan penjual
PR6 The technology offered by the product might be rapidly out of date Yes No
Teknologi yang ditawarkan produk ini bisa cepat ketinggalan jaman
PR7 The feature of the product might not support my job mobility (size, weight or battery capacity) Yes No
Fitur produk ini bisa jadi tidak mendukung mobilitas kerja saya (ukuran, berat atau umur batere)
CODE ITEM VALID
MULTIDIMENSIONAL PERCEIVED PURCHASE RISK MEASUREMENT S N
FR1 The price for this product might not worth the benefits I receive No No
Harga produk ini tidak sebanding dengan manfaat yang saya dapatkan
FR2 The product offered might be bought with a cheaper price elsewhere No No
Produk yang ditawarkan ini dapat saya beli ditempat lain dengan harga yang lebih murah
FR3 Might be other additional costs to be incurred before I can use this product properly (installation, upgrades, etc.) Yes Yes
Ada biaya tambahan lain yang harus dikeluarkan sebelum produk ini dapat saya gunakan (instalasi, upgrade, dsb)
FR4 This product might require great maintenance costs in order to stay durable Yes Yes
Produk ini membutuhkan biaya perawatan yang besar agar tidak cepat rusak
FR5 If it breaks, the cost of repair that I would have to pay for this product would be greater than other products Yes Yes
Jika rusak, saya harus membayar biaya reparasi yang lebih besar untuk produk dibanding produk yang lain
FR6 The offered product might be easily damaged, so I would have to buy a new product No No
Produk ini cepat rusak sehingga saya harus membeli produk yang baru
CODE ITEM VALID
MULTIDIMENSIONAL PERCEIVED PURCHASE RISK MEASUREMENT S N
CR1 Buying this product might cause me to expend valuable time to take care of matters related to this product. Yes Yes
Membeli produk ini dapat membuat saya menghabiskan waktu yang berharga untuk mengurus hal-hal yang terkait produk ini.
CR2 Buying this product might cause interference to my daily routine Yes Yes
Membeli produk ini dapat menyebabkan terjadinya gangguan pada rutinitas harian yang saya miliki
CR3 Buying this product might interfere with the work plan I’ve arranged for myself. Yes Yes
Membeli produk ini dapat mengganggu rencana kerja yang sudah saya susun.
CR4 Buying this product might lead to problems that hinders my work or class Yes Yes
Membeli produk ini dapat menyebabkan terjadinya masalah yang menghambat pekerjaan atau perkuliahan saya
CR5 Buying this product might create problems that inconveniences me Yes No
Membeli produk ini dapat menciptakan masalah yang dapat merepotkan diri saya
CR6 This product might require a lot of services and treatments that inconveniences me No No
Produk ini akan membutuhkan banyak servis dan perawatan yang akan merepotkan saya
CODE ITEM VALID
MULTIDIMENSIONAL PERCEIVED PURCHASE RISK MEASUREMENT S N
SR1 Buying this product might harm my personal image in the eyes of my friends No No
Membeli produk ini dapat menciderai image saya dimata teman-teman saya
SR2 Buying this product might make me feel anxious No No
Membeli produk ini dapat membuat saya merasa cemas
SR3 My friends would consider this product a cheap/inferior product Yes Yes
Teman-teman saya akan menganggap produk ini produk murahan
SR4 My friends would consider this product a mass-products (not exclusive) Yes Yes
Teman-teman saya akan menganggap produk ini produk pasaran (tidak eksklusif)
SR5 My friends would consider this product outdated Yes Yes
Teman-teman saya akan menganggap produk ini ketinggalan jaman
SR6 My friends will see me as incompetent if I buy this product Yes Yes
Teman-teman saya akan menganggap saya tidak kompeten jika saya membeli produk ini
SR7 I would feel embarrassed to be seen using this product in public places Yes Yes
Saya akan merasa minder jika menggunakan produk ini di tempat umum
SR8 The shape and color of this product does not fit with my self image Yes Yes
VOLUME NO. 2 (2012), ISSUE NO. 1 (JANUARY) ISSN2231-5756
CODE ITEM VALID
SATU FAKTOR PERCEIVED RISK MEASUREMENT S N
PRA I believe that buying the product offered has a big risk because the benefits promised by the seller might not necessarily be in accordance with the reality.
Yes Yes
Saya meyakini bahwa membeli produk yang ditawarkan diatas memiliki resiko yang besar karena belum tentu manfaat yang dijanjikan oleh penjual sesuai dengan kenyataan.
PRB I believe that buying the product offered has a big risk because there is a possibility that the product offered might be of low quality. Yes Yes
Saya meyakini bahwa membeli produk yang ditawarkan diatas memiliki resiko yang besar karena ada kemungkinan bahwa produk yang ditawarkan ternyata memiliki kualitas rendah.
PRC I believe that buying the product offered has a big risk because it can make me experience financial losses. Yes Yes
Saya meyakini bahwa membeli produk yang ditawarkan diatas memiliki resiko yang besar karena dapat membuat saya mengalami kerugian finansial.
PRD I believe that buying the product offered has a big risk because it can reduce my reputation in the eyes of others. Yes No
Saya meyakini bahwa membeli produk yang ditawarkan diatas memiliki resiko yang besar karena dapat mengurangi reputasi saya dimata orang lain.
PRE I believe that buying the product offered has a big risk because it could be incompatible with the concept of self that I have. Yes No
Saya meyakini bahwa membeli produk yang ditawarkan diatas memiliki resiko yang besar karena bisa jadi tidak sesuai dengan konsep diri yang saya miliki.
PRF I believe that buying the product offered has a big risk because it can spend precious time that I have. Yes Yes
Saya meyakini bahwa membeli produk yang ditawarkan diatas memiliki resiko yang besar karena dapat menghabiskan waktu berharga yang saya miliki.
PRG Overall, I feel that buying the product offered involves a big risk. Yes Yes
Secara keseluruhan, saya merasa pembelian produk yang ditawarkan diatas memiliki resiko yang besar.
CODE ITEM VALID
PURCHASE INTENTION S N
PI1 I have the intention to buy the product offered Yes Yes
Saya memiliki niat untuk membeli produk yang ditawarkan.
PI2 I have expectations in the future to buy the product offered Yes Yes
Saya memiliki ekspektasi di masa depan untuk membeli produk yang ditawarkan.
PI3 There is a possibility for me in the near future to buy the product offered Yes Yes
Ada kemungkinan bagi saya dalam waktu dekat untuk membeli produk yang ditawarkan.
PI4 There is a possibility for me to recommend the product offered to my friends and family. Yes Yes
Ada kemungkinan bagi saya untuk merekomendasikan produk yang ditawarkan kepada teman dan keluarga saya.
PI5 If I want to buy this type of product, then I would look for the product described in the offering. Yes Yes
VOLUME NO. 2 (2012), ISSUE NO. 1 (JANUARY) ISSN2231-5756
INTERNATIONAL JOURNAL OF RESEARCH IN COMMERCE, IT & MANAGEMENT
REQUEST FOR FEEDBACK
Dear Readers
At the very outset, International Journal of Research in Commerce, IT and Management (IJRCM)
acknowledges & appreciates your efforts in showing interest in our present issue under your kind perusal.
I would like to request you to supply your critical comments and suggestions about the material published
in this issue as well as on the journal as a whole, on our E-mails i.e.
[email protected] for further improvements in the interest of research.
If you have any queries please feel free to contact us on our E-mail [email protected].
I am sure that your feedback and deliberations would make future issues better – a result of our joint
effort.
Looking forward an appropriate consideration.
With sincere regards
Thanking you profoundly
Academically yours
Sd/-