Some factors that may affect the physical-chemical properties of
blueberries
Raquel P. F. Guiné
1,2*, Christophe F. Gonçalves
1, Fernando Gonçalves
1,2and
Daniela V. T. A. Costa
4(1.Dep. Indústrias Alimentares, ESAV, Instituto Politécnico de Viseu, Portugal.
2.CI&DETS/ESAV, Instituto Politécnico de Viseu, Portugal. 3.CERNAS/ESAC, Instituto Politécnico de Coimbra, Portugal.
4.Dep. Ecologia e Agricultura Sustentável, ESAV, Instituto Politécnico de Viseu, Portugal)
Abstract: The aim of the present study was to investigate the effect of different production and conservation factors on some properties of blueberries. Among the production factors considered were cultivar (Duke, Bluecrop and Ozarkblue) and production mode (organic or conventional). Regarding the conservation factors were evaluated temperature (ambient or refrigeration) and storage time (0, 7 and 14 days). The properties under study belong to three categories: physical prop erties (color and texture); chemical properties (moisture content, sugars and acidity) and phenolic and antioxidant properties (total phenols, anthocyanins, tannins, ABTS antioxidant activity, DPPH antioxidant activity).
The results revealed that moisture content was only influenced by cultivar and that both acidity and sugar contents varied according to the production mode used. Also it was evidenced that the antioxidant activity was not statistically different between cultivars, production modes or conservation conditions. Regarding the phenolic compounds, the tannins were significantly higher for the blueberries produced in organic agriculture. Regarding color significant differences were also encountered and the most intense blue was found in blueberries from cv. Duke, produced in organic farming and stored under refrigeration. Textural attributes were also very significantly influenced by all factors at study: cultivar, production mode and conservation, and the berries from cv. Duke stored under refrigeration showed the highest firmness.
Keywords: blueberry, cultivar, conservation, production mode, statistical analysis
Citation: Guiné, R. P. F., C. F. Gonçalves, F. Gonçalves, and D.V. T. A. Costa. 2016. Some factors that may affect the physical-chemical properties of blueberries. Agricultural Engineering International: CIGR Journal, 18(3):334-342.
1 Introduction
1Blueberries (Vaccinium spp.) are very popular fruits
all over the world, being extremely appreciated due to
their nutritive components, including vitamins,
anthocyanins, mineral elements, and flavonols (Xu et al.
2016). The quality of blueberries is to a great extent
related to the levels of phenolic compounds and,
consequently, to their antioxidant activity, being among
the foods with the highest antioxidant properties (Gündüz,
Serçe, and Hancock 2015; Rodrigues et al. 2011). Their
consumption has increased in the past decades due to a
Received date: 2016-05-24 Accepted date: 2016-07-04
*Corresponding author: Professor Raquel P. F. Guiné, Quinta da Alagoa. Estrada de Nelas. Ranhados. 3500-606 Viseu. Portugal. Tel: +351-232-446641 Fax: +351-232-426536, E-mail: [email protected]
higher consumer demand originated greatly by their
perceived health benefits (Retamales et al. 2015).
Traditional or conventional agriculture uses large
amounts of fertilizers and chemical plant protection
products to intensify the production and increase the
production yields, making it possible to produce enough
food to meet global needs at relatively low costs.
However, these practices have proven harmful to the
environment and lead, eventually, to the degradation of
ecosystems, thus creating a serious threat to the quality of
life of all living beings. Contrarily, the organic farming
seeks to integrate a set of agricultural techniques aiming
at a rational use of the ecosystems (comprising the
climate, water, soil, microorganisms, plants, animals) so
as to preserve the balance and sustainability at long term.
environmental-friendly set of practices that can counter
the negative effects of agricultural intensification and the
decline of biodiversity in agricultural landscapes. This
agricultural production system excludes almost all
synthetic chemicals, such as fertilizers or pesticides.
Organic farming promotes a sustainable food production
through application of multiple types of organic fertilizers
and reduction of pesticide utilization. Long-term effects
of organic farming generally result in higher organic
matter levels, increased soil biodiversity and
aboveground pest suppression (Sandhu, Wratten, and
Cullen 2010; Chamorro, Masalles, and Sans 2016; Quist
et al. 2016).
During storage a substantial number of physical and
chemical changes happen in the agricultural products in
general and blueberries in particular. These alterations can
meaningfully influence the quality of the berries,
originating senescence and death. The transportation and
storage times are relatively limited principally because of
the fungus and the tendency of the blueberries to dehydrate.
To a large extent, the quality and storage life of blueberries
is related to the soluble solids content, acidity and ratio of
soluble solids to acidity. Usually, blueberries are stored in
freezers at temperatures between 2°C and 4°C and 85% to
90% relative humidity, for a period of up to 10 days,
depending on the cultivar (Retamales et al. 2015; Severo et
al. 2009; Galarça et al. 2012).
The aim of the present study was to evaluate the
effect of different production and conservation factors on
the properties of blueberries. The production factors
considered were cultivar (Duke, Bluecrop and Ozarkblue)
and production mode (organic or conventional). The
conservation factors studied were temperature (ambient
or refrigeration) and time (0, 7 and 14 days). The
properties under study fall into three categories: physical
properties (color and texture); some chemical components
(moisture content, sugars and acidity) and phenolic and
antioxidant properties (total phenols, anthocyanins,
tannins, ABTS antioxidant activity, DPPH antioxidant
activity).
2 Experimental procedure
2.1 Harvesting and conservation
In the resent study blueberries form three cultivars
were analyzed (Duke, Bluecrop, Ozarkblue), original
from conventional and organic production modes. The
fruits were harvested at a maturity state corresponding to
the marketing conditions, according to the producers. The
properties were evaluated in the fresh samples
(corresponding to 0 day of storage) and also after 7 and
14 d of storage under refrigeration at a temperature of 4ºC
and 85% to 90% relative humidity (RH).In addition, for
the cultivar Duke produced in conventional mode, was
also tested the storage at room temperature (around 15ºC
to 25ºC and 30% to 60% RH).
2.2 Chemical analysis
For the evaluation of moisture content a Halogen
Moisture Analyzer HG53 from Mettler Toledo was used.
Acidity was determined by titration according to the
Portuguese Standard NP-1421 and total soluble solids,
corresponding approximately to the sugar content
expressed in sucrose, were determined in ºBrix using a
refractometer Atago 3T.
To extract the phenolic compounds from the samples
at study, methanol and acetone solutions were used, so
that in each case the sample was left for 1 h in an
ultrasonic bath at room temperature to contact with the
extraction solution. The extracts obtained were then used
to quantify the phenolic composition and the antioxidant
activity. The total phenolic compounds were determined
by the Folin–Ciocalteu method. Total anthocyanins were
determined using the SO2 bleaching method. Total
tannins were estimated by modification of method
described by Ribereau-Gayon and Stonestreet. The
antioxidant activity was determined by DPPH and ABTS
methods(Guiné, Soutinho, and Gonçalves 2014).
2.3 Analysis of the physical properties
The color coordinated were determined using a
colorimeter (Chroma Meter - CR-400, Konica Minolta) in
the CIE Lab color space, measuring the Cartesian
black to 100 = white), a* is green/red (negative or
positive values, respectively), and b* is blue/yellow
(negative or positive values, respectively).
To determine the texture attributes (firmness and
elasticity) the evaluations were performed with a
texturometer TA.XT Plus (Stable Micro Systems).The
test measured the compression force using a probe of 2
mm (P/2), with the following test conditions: pre-test
speed = 1.50 mm/s, test-speed = 1.00 mm/s, post-test
speed = 1.00 mm/s, distance = 6 mm, trigger force = 0.05
mm and a load cell of 50 kg. The results were processed
using Exponent software TEE (Stable Micro Systems)
and from the obtained texture profiles were determined
the firmness (the strength at the highest peak) and
elasticity (distance at the highest point).
2.4 Statistical analysis
For the treatment of the data were performed
different tests, according to the case applicable for each
set of variables. For the comparison of all variables
according to the cultivar the Kruscal Walis test was used.
For the comparison of the properties in relation to the
production mode in some cases the t test for independent
samples was used and in others was used the U Mann
Whitney test. For the conservation conditions the U Mann
Whitney test was always used.
Also the Pearson coefficients (r) were determined
between the quantitative variables to evaluate the
intensity of the relations between the properties evaluated.
If 0.00 < r < 0.10 the association is considered very weak,
if 0.10 ≤ r < 0.30 the association is weak, if 0.30 ≤ r <
0.50 the association is moderate, if 0.50 ≤ r < 0.70 the association is strong and if 0.70 ≤ r < 1.00 the association
is very strong. For r = 0 there in no association and for r =
1 the association is perfect.
In all tests a level of significance of 95% was
considered and the software used for all tests was SPSS
version 21 (IBM Inc.).
3 Results and discussion
3.1 Effect of cultivar on the physical-chemical
properties
Table 1 shows the results obtained through the
Kruskal-Wallis tests made to the effect of cultivar on the
chemical composition. The results show that there are
significant differences (p = 0.045), at the significance
level of 5%, in moisture content, and that the moisture is
higher for the cultivar Duke, then decreasing in the order
Ozarkblue and Bluecrop. Regarding acidity and sugars,
no significant differences were observed among cultivars
(p = 0.089 and p = 0.083, respectively).The differences in
moisture content observed for some cultivars may be
attributed to the cultivar itself, or may also to some extent
be related either to different maturity stages of the fruits,
since the fruits were harvested by the producer without an
objective evaluation of the maturity stage. Other factor
that may contribute for the differences in moisture could
be the quantity of rain or the irrigation intensity of each
of the plantations.
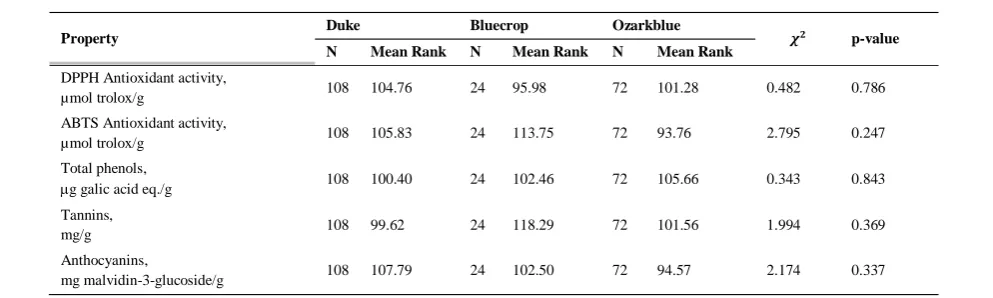
The results of the Kruskal-Wallis tests in Table 2
show that none of the phenolic properties considered
(total phenols, tannins, anthocyanins or antioxidant
activity by both methods) varied among the different
Table1 Kruskal-Wallis test between cultivar and the chemical components
Property
Duke Bluecrop Ozarkblue
𝝌𝟐 p-value
N Mean Rank N Mean Rank N Mean Rank
Moisture,
g water/100 g 36 38.69 8 19.75 24 33.13 6.188 0.045 Acidity,
mg citric acid/100 g 27 32.87 6 31.58 18 22.17 4.832 0.089 Sugars,
cultivars studied, since in all cases the p-value was higher
than 0.05, hence assuming the null hypothesis of absence
of significant differences. This results was surprising,
because studies report that there is considerable variation
in the phenolic profiles and antioxidant capacities among
cultivars and species of blueberries (Cardeñosa et al.
2016). The fact that these cultivars showed similar
phenolic compounds contents and antioxidant properties
may be due to some production factors, such as
temperature, sun incidence or hydric stress, which greatly
contribute for the development of phenolic compounds in
plant materials as a response to environmental stress
conditions(Cardeñosa et al. 2016).
Table 3 presents the results of the Kruskal-Wallis
test between cultivar and the color and textural properties.
The results indicate that in all cases, for a level of
significance of 5%, there are highly significant
differences, as indicated by the p-velues. The results
show that lightness was higher for cultivar Ozarkblue,
indicating that these berries were clearer, then Bluecrop
and finally cv. Duke, which had the lowest value of L*,
and hence was the darkest. As to the coordinate a*, its
value was higher for cv. Bluecrop, then for Ozarkblue
and lastly for Duke. On the contrary, the values of b*
varied in the inverse relation, so that b* was higher for cv.
Duke, then Ozarkblue and finally Bluecrop. Because the
values of b* are negative, indicative of the presence of
blue instead of yellow, increasing b* means that the blue
is less intense. Hence, in this case, the least intense blue
was found on cv. Duke. The blue coloration is derived
from the contents in some natural pigments, namely
anthocyanins, and therefore may vary according to its
formation intensity along the maturation of the fruits as
well as post-harvest conditions (Martynenko and Chen
2016).
In relation to texture, it was observed that both
firmness and elasticity were higher for cv. Duke and
lower for cv. Ozarkblue (Table 3). The textural
characteristics of the fruits are somewhat correlated to
their moisture content as well as fiber content, and
therefore it is expected that differences in moisture could
also be associated with differences in texture.
3.2 Effect of production mode on the
physical-chemical properties Table 2 Kruskal-Wallis test between cultivar and the phenolic properties
Property Duke Bluecrop Ozarkblue 𝝌𝟐 p-value
N Mean Rank N Mean Rank N Mean Rank
DPPH Antioxidant activity,
µmol trolox/g 108 104.76 24 95.98 72 101.28 0.482 0.786 ABTS Antioxidant activity,
µmol trolox/g 108 105.83 24 113.75 72 93.76 2.795 0.247 Total phenols,
g galic acid eq./g 108 100.40 24 102.46 72 105.66 0.343 0.843 Tannins,
mg/g 108 99.62 24 118.29 72 101.56 1.994 0.369 Anthocyanins,
mg malvidin-3-glucoside/g 108 107.79 24 102.50 72 94.57 2.174 0.337
Table 3 Kruskal-Wallis test between cultivar and the physical properties
Property Duke Bluecrop Ozarkblue 𝝌𝟐 p-value
N Mean Rank N Mean Rank N Mean Rank
Table 4 shows the results of the U Mann-Whitney
tests made between the production mode and the
chemical parameters analyzed. The results indicated that
moisture content was not significantly different among
the two production modes studied (conventional or
organic) (p = 0.077) at the level of significance of 5%.
However, both acidity and sugars content varied
significantly according to the production mode (p < 0.001
in both cases), so that organic berries had higher acidity
and lower sugar contents.
Table 4 U Mann-Whitney test between production
mode and the chemical components
The effect of production mode on the phenolic
properties was studied by means of the independent
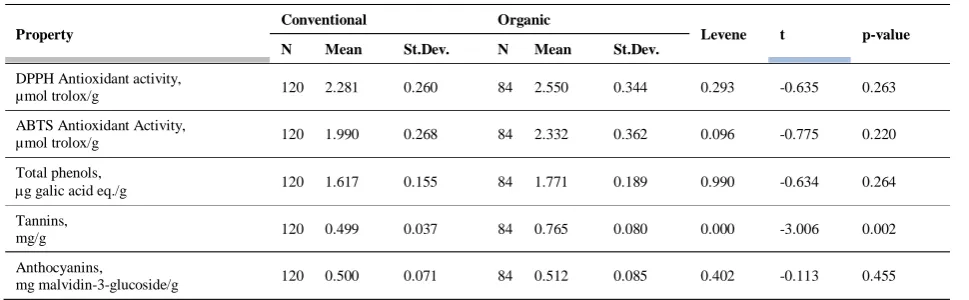
samples t-test, whose results are presented in Table 5.
The results showed that there are no significant
differences between the antioxidant activity in the berries
from conventional or organic production modes,
regardless of the method used to quantify antioxidant
activity (p > 0.05 in both cases). Also total phenols
content was not significantly different, at the level of
significance of 5%, among production modes (p = 0.264),
and the same was observed for anthocyanins (p = 0.455).
Conversely, the tannins content was significantly
different (p = 0.002), being higher in the berries from
organic farming. The stress conditions provoked by the
organic production mode lead the plant material to
produce some phenolic compounds in higher amounts,
and this could be the case with the tannins.
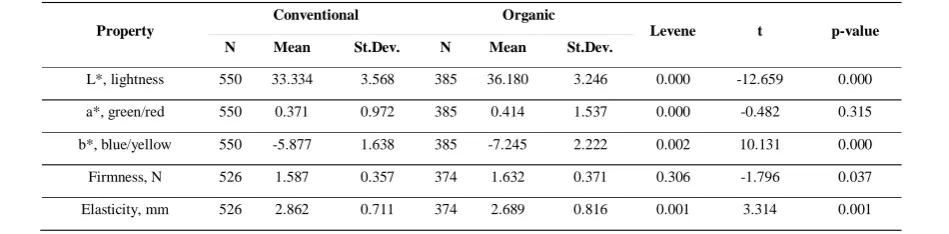
Table 6 shows the results of the independent
samples t-test between production mode and the physical
properties, namely color coordinates and textural
parameters. It was observed that lightness (L*) varied
highly significantly with production mode (p < 0.001), so
that the berries from organic farming were lighter (with
higher L*). Greenness/redness (a*) showed no significant
differences for both production modes studied (p = 0.315),
but blueness (b*) showed highly significant differences (p
< 0.001), being lower for organic berries, which therefore
presented a more intense blue, at the level of significance
of 5%.The color of the blueberries is associated with the
presence of pigments such as anthocyanins, and therefore
the differences between productions modes could be
expected.
Property
Conventional Organic
UMW p-value
N Mean
Rank N
Mean Rank
Moisture,
g water/100 g 40 37.36 8 30.41 445.50 0.077 Acidity,
mg citric acid/100 g
30 13.20 21 25.71 99.00 0.000 Sugars,
g sucrose/100 g 30 33.25 21 15.64 97.50 0.000
Table 5 Independent samples t-test between production mode and the phenolic properties
Property
Conventional Organic
Levene t p-value
N Mean St.Dev. N Mean St.Dev.
DPPH Antioxidant activity,
µmol trolox/g 120 2.281 0.260 84 2.550 0.344 0.293 -0.635 0.263 ABTS Antioxidant Activity,
µmol trolox/g 120 1.990 0.268 84 2.332 0.362 0.096 -0.775 0.220 Total phenols,
g galic acid eq./g 120 1.617 0.155 84 1.771 0.189 0.990 -0.634 0.264 Tannins,
mg/g 120 0.499 0.037 84 0.765 0.080 0.000 -3.006 0.002 Anthocyanins,
Firmness showed significant differences among
production modes (p = 0.037), being the berries from
organic farming harder than those from conventional
production mode. In regards to elasticity, very significant
differences were observed (p = 0.001) and the fruits from
conventional agriculture were the more elastic. The
higher resistance of the organic blueberries constitutes an
advantage for handling and conservation and therefore
proves some benefits of using organic farming instead of
conventional agriculture. Some identified key challenges
that could also contribute for the expansion of certified
organic blueberry production include greater production
costs and/or inputs (particularly for fertilization and weed
management), limited options for disease and insect
control associated with greater risk, and reduced yields of
organic plantings (whether perceived or real) (Strik
2016).
3.3 Effect of conservation on the physical-chemical
properties
The postharvest shelf-life of fresh blueberries is
quite short when they are kept at room temperature
because they undergo mechanical damage, microbial
growth, and nutritional and moisture loss which seriously
reduces commercial value of blueberries (Xu et al. 2016).
Hence the effect of conservation conditions on the
properties of the berries is crucial. Table 7 shows the
results of the U Mann-Whitney tests between
conservation conditions and the chemical components
evaluated. The results indicated that in all cases, at the
level of significance of 5%, neither of the properties
studied (moisture, acidity or sugar content) varied
significantly according to the conditions used for storage
(ambient temperature or refrigeration). These results are
very interesting given that blueberries are perishable and
from the moment that they are harvested they are very
susceptible to structural, nutritional and biochemical
changes (Vieira et al. 2016).
Table 7 U Mann-Whitney test between conservation
temperature and the chemical components
Table 8 shows the results of the U Mann-Whitney
tests between conservation conditions and the phenolic
composition or antioxidant activity. It was observed that,
at the level of significance of 5%, only the tannins
content showed significant differences according to the
conservation conditions (p = 0.031), being higher when
the berries were stored under refrigeration.
Property
Ambient
temp. Refrigeration
UMW p-value
N Mean
Rank N
Mean Rank
Moisture,
g water/100 g 12 41.08 56 33.09 257.00 0.102 Acidity,
mg citric acid/100 g 9 25.50 42 26.25 157.50 0.216 Sugars,
g sucrose/100 g 9 29.39 42 25.27 158.50 0.226
Table 6 Independent samples t-test between production mode and the physical properties
Property
Conventional Organic
Levene t p-value
N Mean St.Dev. N Mean St.Dev.
The results in Table 9 indicate that except for a*,
whose p-value was higher than 0.05, all other physical
properties revealed highly significant differences
according to the conservation conditions (p < 0.001). In
this way it was confirmed that the berries stored under
refrigeration had higher L* and lower b*, and hence were
clearer and with more intense blue. Also the refrigerated
blueberries had higher firmness and were less elastic. The
alteration of the physical characteristics of blueberries are
strictly related to their susceptibility to spring frosts and
degree of winter freezing tolerance, which have been
identified as two of the most important genetic limitations
of current blueberry cultivars (Die, Arora, and Rowland
2016).
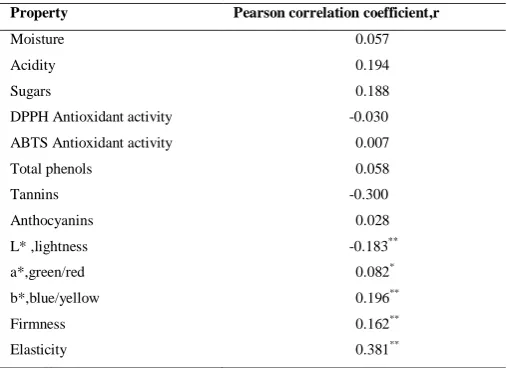
Table 10 shows the Pearson correlation coefficients
between storage time and the physical-chemical
properties studied. The results indicate that no meaningful
associations were found between storage time and these
properties, with the highest value being 0.381, which
reflects a moderate positive association between storage
time and elasticity, so that as time increases elastic also
increases.
Table 10 Pearson correlations between storage time
and the physical-chemical properties
Note: **Correlation is significant at the 0.01 level.
*
Correlation is significant at the 0.05 level
Property Pearson correlation coefficient,r
Moisture 0.057
Acidity 0.194
Sugars 0.188
DPPH Antioxidant activity -0.030 ABTS Antioxidant activity 0.007 Total phenols 0.058 Tannins -0.300 Anthocyanins 0.028 L* ,lightness -0.183** a*,green/red 0.082*
b*,blue/yellow 0.196** Firmness 0.162**
Elasticity 0.381** Table 8 U Mann-Whitney test between conservation temperature and the phenolic properties
Property
Ambient temp. Refrigeration
UMW p-value
N Mean
Rank N Mean Rank
DPPH Antioxidant activity,
µmol trolox/g 36 99.36 168 103.17 2911.00 0.363 ABTS Antioxidant activity,
µmol trolox/g 36 94.92 168 104.13 2751.00 0.198 Total phenols,
g galic acid eq./g 36 89.81 168 105.22 2567.00 0.078 Tannins,
mg/g 36 85.76 168 106.09 2421.50 0.031 Anthocyanins,
mg malvidin-3-glucoside/g 36 103.82 168 102.22 2976.50 0.441
Table 9 U Mann-Whitney test between conservation temperature and the physical properties
Property Ambient temp. Refrigeration UMW p-value
N Mean Rank N Mean Rank
3.4 Correlations between the physical-chemical
properties
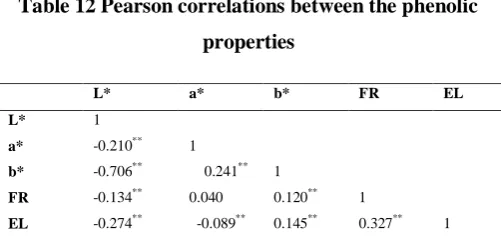
Table 11 shows the Pearson correlation coefficients
between the physical properties, color and texture.
Although in most cases the correlations found are
significant at the level of 5%, they are very weak, with
just the exception of the correlation between b* and L*,
which is strongly negative (r = -0.706), indicating that the
blueness and the darkness are strongly inversely
correlated.
Table 11 Pearson correlations between the physical
properties
Note: L*: Lightness, a*: Green/red, b*: blue/yellow, FR: Firmness, EL: Elasticity.
**Correlation is significant at the 0.01 level.
The data in Table 12 shows that in all cases the
Pearson correlation coefficients between the phenolic
composition and the antioxidant activity were significant
al the level of significance of 5%. Furthermore, it was
observed that ABTS and DPPH antioxidant activities are
very strongly positively correlated (r = 0.958). Also the
antioxidant activity is very strongly correlated with total
phenols: r = 0.871 for DPPH method and r = 0.920 for
ABTS method. This shows that the presence of phenolic
compounds strongly contributes for the antioxidant
activity of the blueberries. The tannins content are
moderately positively associated with antioxidant activity
(r = 0.579 and r = 0.586, respectively for DPPH and ATS
methods), also moderately correlated with total phenols (r
= 0.616) and moderately correlated with anthocyanins (r
= 0.500). On the other hand, anthocyanins are very
strongly correlated with antioxidant activity (r = 0.865
and r = 0.917, respectively for DPPH and ATS methods)
and with total phenols (r = 0.947), indicating that
anthocyanins are important constituents of the blueberries
analyzed and that they contribute decisively for their
antioxidant activity.
Table 12 Pearson correlations between the phenolic
properties
Note: DPPH: DPPH Antioxidant activity, ABTS: ABTS Antioxidant Activity, TP: Total phenols, TAN: Tannins, ANT: Anthocyanins.
**
Correlation is significant at the 0.01 level.
4 Conclusions
This work allowed concluding that moisture content
in blueberries was only influenced by cultivar, whereas
acidity and sugar contents were influenced by production
mode.
Regarding the antioxidant activity no statistically
significant differences were found according to cultivar,
or production mode, or even conservation conditions. As
to the phenolics, only tannins showed significant
differences according to production mode, being higher
for organic farming.
Color parameters lightness and blueness were found
to vary significantly according to cultivar, production
mode and conservation conditions. The most intense blue
was found in blueberries from cv. Duke, for production in
biological mode and for storage under refrigeration.
Texture was also very significantly influenced by the
three factors at study, cultivar, production mode and
conservation, being the berries with higher firmness those
from cultivar Duke and stored under refrigeration.
References
Cardeñosa, V., G,Amadeo, L. M. José, A. M.Diego, and M. M. José. 2016. Influence of Genotype, Cultivation System and Irrigation Regime on Antioxidant Capacity and Selected Phenolics of Blueberries (Vaccinium Corymbosum L.) Food Chemistry, 202: 276–283.
DPPH ABTS TP TAN ANT
DPPH 1
ABTS 0.958** 1
TP 0.871** 0.920** 1
TAN 0.579** 0.586** 0.616** 1
ANT 0.865** 0.917** 0.947** 0.500** 1
L* a* b* FR EL
L* 1
a* -0.210** 1
b* -0.706** 0.241** 1
FR -0.134** 0.040 0.120** 1
Chamorro, L., R. M. Masalles, and F. X Sans. 2016. Arable Weed Decline in Northeast Spain: Does Organic Farming Recover Functional Biodiversity? Agriculture, Ecosystems & Environment, 223: 1–9.
Die, J. V., R. Arora, and L. J. Rowland. 2016. Global Patterns of Protein Abundance during the Development of Cold Hardiness in Blueberry. Environmental and Experimental Botany, 124: 11–21..
Galarça, S. P., R. F. F. Cantillano, A. P. P. Schunemamn, and C. S. M. Lima. 2012. Efeito Do Armazenamento Em Atmosfera Controlada Na Qualidade Pós-Colheita De Mirtilos ‘bluegem’ Produzidos No Brasil. Revista Iberoamericana de Tecnología Postcosecha, 13 (2): 165–170.
Guiné, R. P. F., S. M. A. Soutinho, and F. J. Gonçalves. 2014. Phenolic Compounds and Antioxidant Activity in Red Fruits Produced in Organic Farming. Croatian Journal of Food Science and Technology, 6 (1): 15–26.
Gündüz, K., S. Serçe, and J. F. Hancock. 2015. Variation among Highbush and Rabbiteye Cultivars of Blueberry for Fruit Quality and Phytochemical Characteristics. Journal of Food Composition and Analysis, 38: 69–79..
Martynenko, A., and Y. Chen. 2016. Degradation Kinetics of Total Anthocyanins and Formation of Polymeric Color in Blueberry Hydrothermodynamic (HTD) Processing. Journal of Food Engineering, 171: 44–51..
Quist, C. W., M. Schrama, J. J. de Haan, G. Smant, J. Bakker, W.H. van der Putten, and J. Helder. 2016. Organic Farming Practices Result in Compositional Shifts in Nematode Communities That Exceed Crop-Related Changes. Applied Soil Ecology, 98: 254–260..
Retamales, J. B., C. Mena, G. Lobos, and Y. Morales. 2015. A Regression Analysis on Factors Affecting Yield of Highbush Blueberries. Scientia Horticulturae, 186: 7–14. Rodrigues, E., N. Poerner, I. Ivan Rockenbach, L. V.Gonzaga, C. R.
Mendes, and R. Fett. 2011. Phenolic Compounds and Antioxidant Activity of Blueberry Cultivars Grown in Brazil. Food Science and Technology (Campinas), 31(4): 911–917.
Sandhu, H. S., S. D. Wratten, and R. Cullen. 2010. Organic Agriculture and Ecosystem Services. Environmental Science & Policy, 13(1): 1–7.
Severo, J., S. P. Galarça, R. F. Aires, R. F. F. Cantillano, C. V. Rombaldi, and J. A. Silva. 2009. Phenolic Compounds, Anthocyanins, Antioxidant Capacity and Vitamin C in Blueberries Stored under Controlled Atmosphere. Brazilian Journal of Food Technology, 12(1): 65–70.
Strik, B. C. 2016. A Review of Optimal Systems for Organic Production of Blueberry and Blackberry for Fresh and Processed Markets in the Northwestern United States. Scientia Horticulturae, 208: 92–103.
Vieira, J.M., M. L. Flores-López, D. J. de Rodríguez, M. C. Sousa, A. A. Vicente, and J.T. Martins. 2016. Effect of chitosan– Aloe Vera Coating on Postharvest Quality of Blueberry (Vaccinium Corymbosum) Fruit. Postharvest Biology and Technology, 116: 88–97.