International PhD Program in Biomolecular Sciences
Centre for Integrative Biology
XXVII Cycle
Modulation of Murine Intestinal Gene Expression by
Dietary Fat: Spatial Variation and Saturation Effect
Tutor
Dr. Marco Scotti
GEOMAR Helmholtz Centre for Ocean Research Kiel
Germany
Advisor
Dr. Melissa J. Morine
The Microsoft Research – University of Trento Centre for Computational Systems Biology
Ph.D. Thesis of
Tenzin Nyima
The Microsoft Research – University of Trento Centre for Computational Systems Biology
Academic Year 2014-2015
Declaration
I hereby confirm that this is my own work and the use of all material from other sources
has been properly and fully acknowledged.
Tenzin Nyima Date: 31 January 2016
Acknowledgements
I had a remarkable research experience during my PhD journey. I am deeply indebted to my Tutor Dr. Marco Scotti and thesis Advisor Dr. Melissa J. Morine for their invaluable guidance, and for giving me this wonderful opportunity to work on this project. This PhD would not have been possible without their expertise, dedication and enthusiasm. Also, I am very thankful to Dr. Marco Scotti for his patience, support and for being an excellent supervisor. This thesis has been thoroughly reviewed and proofread by him, for which I am very grateful.
I am thankful to our collaborators Dr. Guido J. E. J. Hooiveld from Wageningen University (The Netherlands) and Prof. Michael Müller from University of East Anglia in Norwich (UK) for allowing us to analyze their data. And, I would like to thank them for hosting me at their lab (Division of Human Nutrition, Wageningen University) during my period abroad. I had a gratifying time working under their guidance, which helped me gain new perspective on my research.
Research on this thesis was made possible by the fellowship provided by COSBI, for which I am truly grateful. Also, I would like to extend my thanks to COSBI for providing me the resources necessary to complete this project. I had an enjoyable time working with my brilliant colleagues at COSBI and I would like to thank them for their support.
I am very thankful to our PhD school for providing the academic support. I would like to thank Prof. Paolo Macchi and Betty Balduin for their patience and advice throughout the academic years.
6
Table of Contents
Acknowledgements ... 4
List of Figures ... 9
List of Tables ... 10
List of Abbreviations ... 12
Chapter 1 Introduction ... 14
1.1 Effects of dietary fat in the small intestine ... 14
1.2 Small intestine morphology and physiology ... 18
1.3 Lipid absorption and digestion in small intestine ... 20
1.3.1 Intraluminal lipid absorption ... 21
1.3.2 Intracellular lipid absorption ... 24
1.4 High-fat diet and microbiome in intestine ... 25
1.5 Dietary fat intake and diseases in intestine ... 27
1.6 Nonlinear transcriptomic response to dietary fat intake ... 29
1.7 Thesis objective ... 30
1.8 Thesis overview ... 32
Chapter 2 Materials and methods ... 35
2.1 Transcriptome microarray ... 35
2.1.1 Affymetrix GeneChip technology ... 35
2.1.2 Microarray data ... 36
2.2 Background correction and quality assessment ... 38
2.2.1 Background adjustment ... 39
2.2.2 Variability adjustment and quality assessment ... 40
2.3 Regression models ... 42
2.4 Analysis of differentially expressed genes ... 43
2.5 Correlation network analysis... 45
2.6 Functional annotation of the differentially expressed genes ... 46
2.7 Biological process trend analysis ... 47
Chapter 3 Nonlinear transcriptomic response to dietary fat intake in the small intestine of C57BL/6J mice ... 49
3.1 Background ... 49
Contents
3.2.1 Ethics statement ... 54
3.2.2 Dietary intervention ... 54
3.2.3 Microarray data ... 54
3.2.4 Data pre-processing and quality assessment ... 55
3.2.5 Statistical analysis to identify differentially expressed genes ... 56
3.2.6 Functional analysis ... 58
3.3 Results ... 59
3.3.1 Linear and nonlinear gene expression ... 59
3.3.2 Functional annotation ... 63
3.4 Discussion ... 77
3.4.1 Gene- and section-specific transcriptomic response to dietary fat intake ... 77
3.5 Conclusions ... 83
Chapter 4 High fat perturbed pathways along the gut axis of C57BL/6J mice ... 86
4.1 Introduction ... 86
4.2 Materials and methods ... 87
4.2.1 Microarray data ... 87
4.2.2 Data pre-processing ... 88
4.2.3 Differential gene expression analysis ... 88
4.2.4 Weighted co-expression network analysis ... 90
4.2.5 Gene set enrichment test ... 90
4.2.6 KEGG disease pathway enrichment test ... 91
4.2.7 Dominant response-type and intestinal section ... 92
4.3 Results ... 92
4.3.1 Diet responsive DEG ... 92
4.3.2 Significant modules ... 93
4.3.3 Enriched GOBP ... 97
4.3.4 KEGG disease pathways ... 107
4.3.5 Dominant response types ... 108
4.3.6 Dominant intestinal sections ... 108
4.4 Discussion ... 109
4.5 Conclusions ... 114
Chapter 5 Conclusions ... 115
Contents 5.1.1 Consequences of fat intake on the transcriptomic response along the
longitudinal axis of small intestine ... 116
5.2 Applicability beyond intestinal system ... 119
5.3 Outlook ... 120
9
List of Figures
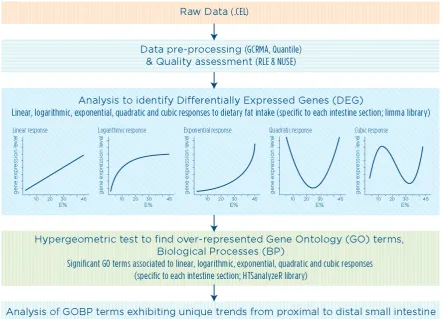
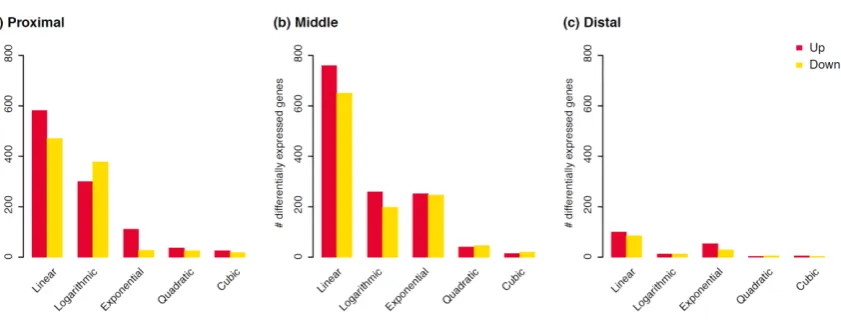
Figure 1.1 Consequences of high-fat overconsumption on small intestine. ... 17 Figure 3.1: Comparison between classical and novel approach for identifying differentially expressed genes. ... 53 Figure 3.2 Schematic representation of workflow adopted for the analysis of microarray data. ... 59 Figure 3.3: Percentages of differentially expressed genes that respond in a linear,
logarithmic and exponential way to fat intake. ... 62 Figure 3.4: Differentially expressed genes that are up- or down-regulated in response to increasing fat intake.. ... 62 Figure 4.1: Theoretical response types. ... 90 Figure 4.2: Up- and down-regulated DEG. ... 93 Figure 4.3: Hierarchical clustering of transcriptomic data of ten samples per dietary
10
List of Tables
Table 2.1: Diet composition of the intervention used for the case study discussed in
Chapter 3.. ... 37
Table 2.2: Dietary intervention used for the case study presented in Chapter 4 ... 38
Table 2.3 R syntax for testing linear and nonlinear responses.. ... 43
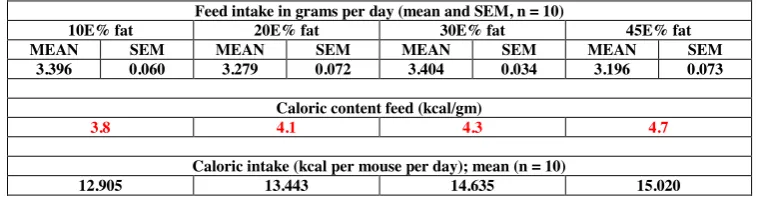
Table 3.1 Food and caloric intake in week 4 ... 57
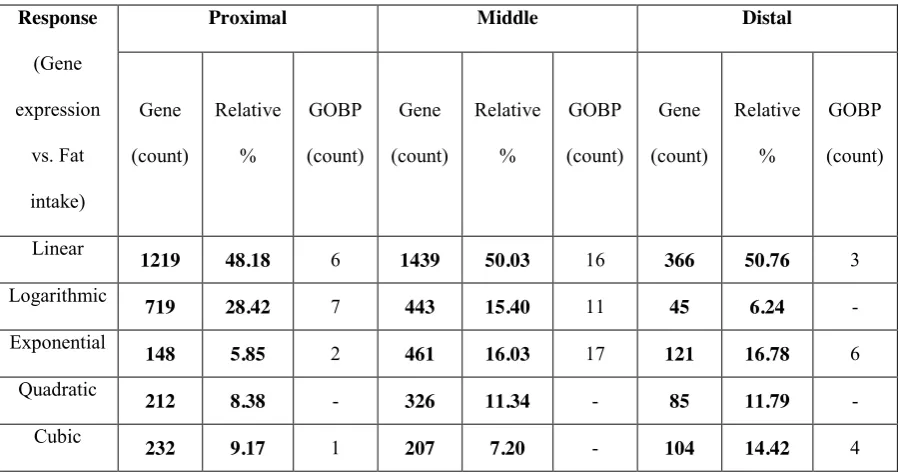
Table 3.2: Count of genes that respond in a significant, dose-dependent way to fat intake. ... 60
Table 3.3 Count of genes that responded in a significant, dose-dependent way to fat intake (model selection based on AIC). ... 63
Table 3.4: Over-represented Gene Ontology Biological Process (GOBP) terms that can be found in various intestinal sections. ... 67
Table 3.5: Over-represented Gene Ontology Biological Process (GOBP) terms associated to differentially expressed genes in the three intestinal sections. ... 70
Table 3.6: Over-represented Gene Ontology Biological Process (GOBP) terms that can be found in various intestinal sections. ... 72
Table 3.7: Over-represented Gene Ontology Biological Process (GOBP) terms completely up-regulated and found in various intestinal sections. ... 73
Contents Table 3.9: Over-represented Gene Ontology Biological Process (GOBP) terms with
down-regulated genes only. ... 75
Table 3.10: Over-represented down-regulated Gene Ontology Biological Process (GOBP) terms that can be found in various intestinal sections. ... 76
Table 3.11: Fat-responsive differentially expressed genes and the associated Gene Ontology Biological Process (GOBP) terms ... 84
Table 4.1: DEG counts per module. ... 97
Table 4.2: Count of significant GOBP terms per module.. ... 98
Table 4.3 Count of significant GOBP terms and the corresponding DEG per module. ... 99
Table 4.4: Diet responsive GOBP terms. ... 107
Table 4.5 HF responsive KEGG disease pathway in the green module. ... 107
Table 4.6 Dominant response types and intestinal sections. ... 108
Table 4.7: Response specific DEG counts. ... 111
12
List of Abbreviations
ABC ATP-binding cassette ACAT acyl-CoA cholesterol
acyltransferase
ADA Adenosine deaminase APR Acute-phase response Birc5 Baculoviral IAP
repeat-containing
BMI Body mass index CCK Cholecystokinin ChEt Cholesterol esterase
DEG Differentially expressed genes FAT Fatty acid transport protein FATP4 Fatty acid transport protein FXR Farnesoid X receptor
GO Gene Ontology
GOBP Gene Ontology Biological Processes
GPCR G protein-coupled receptors GPX Glutathione peroxidase
HD5 Alpha defensin HF High-fat
IAP Intestinal alkaline phosphatase I-FABP Intestinal fatty acid binding
protein
KEGG Kyoto Encyclopedia of Genes and Genomes
LDLs Low-density lipoproteins LF Low-fat
L-FABP liver fatty acid binding protein
LPL Lipoprotein lipase LPS Lipopolysaccharide MM Mismatch
MTP Microsomal triglyceride transport protein
13 NUSE Normalized Unscaled Standard
Error
PLA2 Phospholipase A2 PLM Probe Level Model PM perfect match
Reg3A Regenerating islet-derived 3 alpha
RLE Relative Log Expression RMA Robust multi-array average
Serpina1b Serine protease inhibitor SR-B1 class B Scavenger receptor SREBP Sterol regulatory element
binding protein
14
Chapter 1
Introduction
1.1
Effects of dietary fat in the small intestine
Effects of dietary fat in the small intestine
15 et al. 2010). An obese individual is characterized by lower bacterial diversity with
increased proportion of harmful (Firmicutes) in contrast with health-promoting
(Bacteroidetes) gut microbiota; this condition is termed as dysbiosis (Bäckhed et al. 2004; Clemente et al. 2012; Fleissner et al. 2010; de La Serre et al. 2010; Turnbaugh et al. 2008, 2009). Such reduced bacterial diversity and the presence of dysbiotic conditions were also observed in individuals consuming western style diet (De Filippo et al. 2010; Yatsunenko et al. 2012). A typical western diet consists of approximately 40% of calories from fat although the recommended range is 20-30% (Institute of Medicine 2005; Niot et al. 2009; Werner et al. 2000). Individuals that experience weight loss or follow non-western style diets (i.e., rich in fiber content) exhibit an opposite pattern of bacterial diversity if compared to obese individuals (Bäckhed et al. 2004; De Filippo et al. 2010; Ley et al. 2006; Turnbaugh et al. 2008; Yatsunenko et al. 2012). Obesity and related metabolic complications cause chronic or low-grade inflammation (Hotamisligil 2006). Chronic inflammation is triggered by the increased proportion of lipopolysaccharide containing gut microbiota, also known as metabolic endotoxemia (Cani et al. 2007). Increased
endotoxemia is observed during excessive high-fat intake, which dysregulates
inflammatory signal and leads to weight gain and diabetes (Cani et al. 2007). Dysregulated inflammatory signal is responsible for the high-fat mediated hyperphagia and obesity (Hotamisligil 2006; de La Serre et al. 2010).
The small intestine functions as a mediator between the internal and the external
Effects of dietary fat in the small intestine
16 consists of maximal absorptive surface and the size of lumen decreases from the duodenum to the ileum (DeSesso & Jacobson 2001). When mice are fed with dietary fat gradient (i.e., 10%, 20%, 30%, or 45% kcal from fat), the small intestine displays a buffer capacity in fat handling up to an intake of fat that represents 20% of energy demand (de Wit et al. 2011). Beyond such a 20% threshold, a shift towards an obese phenotype is observed (i.e., significant increase of body weight). The most striking effect in fat-induced differential gene expression is detected when the relative contribution of fat (compared to total energy demand) is between 30% and 45% (de Wit et al. 2011).The small intestine displays
adaptability to the lipid content by enhancing cell proliferation and up-regulating the genes involved in its uptake (Niot et al. 2009; Petit et al. 2007). For example, the up-regulation of fatty acid transport protein (FAT)-4 promotes the uptake of long-chain fatty-acids across intestinal enterocytes (Herrmann et al. 2001). Permeability across intestine occurs either through the enterocytes (i.e., transcellular) or via the intraepithelial tight junctions (i.e., paracellular; Balzan et al. 2007). Enhanced paracellular permeability is observed during excessive high-fat intake, obesity and diabetes (Balzan et al. 2007; Cani et al. 2008; de La Serre et al. 2010). This is due to the modulation of gut microbiota during high-fat
Effects of dietary fat in the small intestine
17 complex interplay that characterizes dietary fat overconsumption, gene expression,
microbiota, and disease onset in the small intestine.
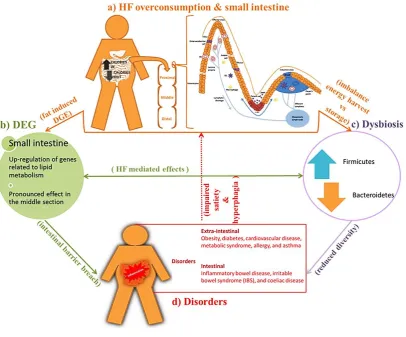
Figure 1.1 Consequences of high-fat overconsumption on small intestine. (a) Excessive consumption of
high-fat diet with minimal physical activity represents a major contributing factor to the global obesity
epidemic. High-fat diet exhibits section-specific impacts on the small intestine. The intestinal epithelial cells
consist of absorptive enterocytes, goblet cells, Paneth cells, enteroendocrine cells and microfold cell. The
maximum absorption and digestion occurs in the small intestine due to the presence of folds (plicae),
depressions (crypts) and fingers like projections (villi). The magnified diagram of the structure of intestinal
barrier in (a) is adapted from (Garrett et al. 2010; Mowat & Agace 2014; Mowat 2003; Peterson & Artis
2014). (b) In the small intestine of mice, a high-fat diet overexpresses genes involved in the lipid metabolism
(de Wit et al. 2011). However, these genes exhibit limited change in other metabolic organs such as the liver,
muscle, and white adipose tissue (Kondo et al. 2006). (c) High-fat overconsumption also impacts the
microbiota; this promotes the dysbiotic condition during which Firmicutes increase at the cost of
Bacteroidetes (Bäckhed et al. 2004; Turnbaugh et al. 2008, 2009). Such condition reportedly increases energy
Small intestine morphology and physiology
18 et al. 2004, 2007). Both modulation of fat metabolism (b) and disruption of microbiota homeostasis (c) are
characterized by intestinal barrier breach and reduced bacterial diversity (whilst supporting the dysbiotic
condition). (d) Such condition (i.e., dietary fat mediated breach in intestinal barrier and dysbiosis) triggers
inflammatory cascade, which promotes extra-intestinal and intestinal disorders (Carding et al. 2015; Fasano
& Shea-Donohue 2005).
1.2
Small intestine morphology and physiology
The small intestine displays spatial differences in morphology and physiology. Its absorptive surface is greatly maximized by the presence of folds (plicae), depressions (crypts) and fingers like projections (villi; DeSesso & Jacobson 2001). Intestinal epithelial cells are lined by a single layer of columnar epithelium (they mainly refer to absorptive enterocytes, but also include goblet cells, Paneth cells, enteroendocrine cells and microfold cells) while intraepithelial cells are sealed together by tight junctions (Figure 1.1a). The intestinal epithelium renews every 4 days in human and 3 days in mice (Kaminsky & Zhang 2003; Petit et al. 2007). Among the three sections of the intestinal epithelium (i.e., duodenum, jejunum and ileum), jejunum displays the maximal surface area; the height of villi decreases from jejunum to the ileum, and lumen size decreases from proximal duodenum to distal ileum (DeSesso & Jacobson 2001). The small intestine displays high variability in gene-expression and this is due to three factors: (1) cell-type differences; (2) changes along the longitudinal axis; (3) differences in developmental stages. George et al. (2008) found high expression levels of innate antimicrobials (alpha defensin 5 - Hd5, and
Small intestine morphology and physiology
19 Among the macronutrients, gastric emptying is faster for carbohydrates and slower for fats. The transit time for chyme (a partially digested food from the stomach) in the small
intestine takes about 3-4 hours. An increase in transit time enhances absorption, especially for poorly absorbed substances (except anticholinergic; DeSesso & Jacobson 2001). The intestinal morphology shows adaptability to the nutritional status. Along with the decline in cell proliferation, fasting leads to gradual atrophy of rat intestinal epithelium (Dunel-Erb et al. 2001). Refeeding activates cellular proliferation and dietary lipids are the strongest stimulators (Buts et al. 1990). In mice, dietary fat-content mediated intestinal adaptation occurs through two complementary events: (1) fatty-diet enhances the height of the villi and shows strongest effect on the intestinal trophism (i.e., crypt-to-villus migration, during epithelial cell renewal); (2) high-fat diet leads to up-regulation of dietary-fat responsive genes that play a significant role in the intestinal fatty acid uptake (i.e., fatty acid transport protein 4 - FATP4, fatty acid transport protein - FAT/CD36, intestinal fatty acid binding protein - I-FABP, and liver fatty acid binding protein - L-FABP) and lipoprotein secretion (i.e., microsomal triglyceride transport protein - MTP, and apolipoprotein - apoA-IV; (Petit et al. 2007). For example, FATP4 up-regulation promotes long-chain fatty acid uptake by the enterocytes (Herrmann et al. 2001).
Lipid absorption and digestion in small intestine
20 increase caloric intake rapidly and, after three days, acquire defects in brain’s lipid sensing mechanism (defects in glucose production; Pocai et al. 2006; Wang et al. 2008). Wang et al. (2008) have proposed that the lipid-sensing mechanism of the intestine provides one of the first lines of metabolic defense against nutrient excess by inhibiting food intake and maintaining energy balance. Furthermore, reduced satiety during high-fat feeding can be due to: (1) oral sensory input (this is because rats on high-fat diet reduce oral fat sensitivity with decreased expression of oral CD36 transporter; Newman et al. 2013); (2) malfunction in gut nutrient sensors like G protein-coupled receptors (GPCR, expressed in
enteroendocrine cells; Janssen & Depoortere 2013)(Janssen & Depoortere 2013). On a high-fat diet, lipid metabolism related genes are prominently over-expressed in the small intestine while a limited change can be detected in the liver, muscle, and white adipose tissues (Kondo et al. 2006; see Figure 1.1b).
1.3
Lipid absorption and digestion in small intestine
Lipid absorption and digestion in small intestine
21 and only a small amount from plants (mainly beta-sitosterol). Beta-sitosterol is efficiently released from the enterocytes into the intestinal lumen, due to intestinal half-transporters ATP-binding cassette (ABC) transporters G5 (ABCG5) and G8 (ABCG8; see Berge et al. 2000). Mammalian cells cannot synthesize a specific group of lipids called essential fatty acids, which must be obtained from the diet. The fat-soluble vitamins (A, D, E and K) are essential for the normal functioning of cells and organs. The absorption rates are higher for vitamins A, D and K compared to vitamin E. It has been suggested that competition
between these fat-soluble vitamins can exist for what concerns intestinal absorption and transport (Phan & Tso 2001; Werner et al. 2000). The intestinal lipid absorption occurs via two successive events: intraluminal and intracellular processes (Werner et al. 2000).
1.3.1 Intraluminal lipid absorption
Multiple physico-chemical changes involve dietary lipids before the uptake from the intestinal lumen to the enterocytes (Werner et al. 2000). Intraluminal lipid absorption includes: (1) emulsification and lipolysis; (2) solubilization; (3) uptake of lipolytic products by enterocytes (Phan & Tso 2001; Werner et al. 2000).
(1) Emulsification and lipolysis. Dietary fat digestion begins in the stomach with
mechanical emulsification and partial triacylglycerols hydrolysis by the acid lipases (lingual and gastric lipases; Phan & Tso 2001; Werner et al. 2000). Most of the
triacylglycerols digestion occurs in the duodenum and the first part of the jejunum by the combined action of bile and pancreatic lipase (Borgström 1977; Werner et al. 2000). Pancreatic lipase hydrolyzes triacylglycerols into monoglycerides and fatty acids (Nassir et al. 2007). When triacylglycerols droplets are covered with bile salts, pancreatic lipase requires the cofactor pancreatic co-lipase for adequate triacylglycerols hydrolysis (Werner et al. 2000). The digestion of phospholipids occurs mainly in the duodenum by the
lyso-Lipid absorption and digestion in small intestine
22 phosphatidylcholine (Iqbal & Hussain 2009; Werner et al. 2000). Dietary cholesterol is mostly available in the form of free sterol, with only 10-15% cholesterol ester. Before absorption, cholesterol esters must be hydrolyzed in the duodenum by pancreatic cholesterol esterase (ChEt; see Iqbal & Hussain 2009; Phan & Tso 2001; Werner et al. 2000). Pancreatic ChEt in humans shows wide specificity (it acts on triacylglycerols, cholesterol esters and phosphoglycerides) and its activity is considerably amplified by the presence of bile salts (Lombardo et al. 1980; Phan & Tso 2001; Werner et al. 2000).
(2) Solubilization. The luminal content (nutrients and bacteria) of small intestine is separated from the intestinal epithelial cells by the unstirred water layer, which is secreted by the mucin producing cells (e.g., goblet cells; Turner 2009). In order to pass through the unstirred layer, dietary fats need to be solubilized into mixed micelles by the bile acids (Wang et al. 2013). Mixed micelles act as transporters by delivering emulsified dietary fat to the apical enterocytes for the uptake (Iqbal & Hussain 2009; Schwenk et al. 2010; Wang et al. 2013).
Lipid absorption and digestion in small intestine
23 exhibits a clear positive relationship with dietary-lipid content, with significant
up-regulation in rats fed with high-fat diet (Iqbal & Hussain 2009).CD36 is also up-regulated in case of genetic obesity and diabetes mellitus (Greenwalt et al. 1995; Iqbal & Hussain 2009). CD36-null mice show abnormal lipid processing with the accumulation of lipids in the proximal small intestine; thus, CD36 plays a vital role in both secretion and clearance of intestinal lipoproteins (Drover et al. 2005). The activity of CD36 is enhanced by the plasma membrane-associated FABP (FABPpm) that facilitates medium- and long-chain fatty acid uptake across the apical membrane of the enterocytes (Wang et al. 2013). After uptake, fatty acids are bound by the cytoplasmic FABP (FABPc) and enter various
metabolic pathways (e.g., oxidation in mitochondria; Georgiadi & Kersten 2012; Wang et al. 2013). FATP4 transports medium- and long-chain fatty acids (Wang et al. 2013). FATP4 is more expressed in mature apical enterocytes than in crypts cells (where its expression is low or almost negligible); higher expression levels are usually found in jejunum than duodenum (Stahl et al. 1999). Its relevance in the in vivo fat absorption
remains unclear but a role in the triacylglycerols processing is suggested. This is because FATP4-null mice show increased accumulation of triacylglycerols in the enterocytes (Shim et al. 2009). Intestinal cholesterol can also be maintained by the combined effects of
NPC1L1 and ABC half-transporters (ABCG5 and ABCG8; Iqbal & Hussain 2009; Wang et al. 2013). NPC1L1 facilitates sterol influx at the apical enterocytes, whereas cholesterol and plant sterol efflux into the intestinal lumen is actively promoted by ABC
half-transporters (Wang et al. 2013). NPC1L1 deficient mice show reduced cholesterol absorption (Altmann et al. 2004). Moreover, the deletion of Cd36 in mice results in
up-regulation of NPC1L1 in the middle and distal sections of small intestine (Nassir et al. 2007). Cholesterol absorption is minimally affected in Abcg5 and Abcg8 deficient mice
Lipid absorption and digestion in small intestine
24
1.3.2 Intracellular lipid absorption
After crossing the apical enterocytes, dietary lipids are directed into the endoplasmic reticulum where they are converted into the bio-inert triacylglycerols. Conversion into triacylglycerols is needed since lipolytic products (especially free fatty acids present in high concentrations) are toxic to the intestinal cells that are thus exposed to be damaged (Mansbach & Nevin 1998). As a countermeasure to toxic damages, FABP aids in the transport of absorbed fatty acids (FABP is more available in the villi than in the crypts and more expressed in the jejunum than in the ileum; Ockner et al. 1972; Ockner & Manning 1974). In the proximal section, FABP is expressed in two forms: L-FABP and I-FABP. The fate of unbound fatty acids from the intestinal cytosol mainly follows two ways: (1) L-FABP activates a storage mechanism for the free fatty acids and monoacylglycerol; (2) when L-FABP is overwhelmed by excess free fatty acids fluxing into the enterocyte, then free fatty acids and monoacylglycerol are rapidly esterified into triacylglycerols (Mansbach & Dowell 2000). However, Vassileva et al. demonstrated that I-FABP is not essential for the dietary fat absorption but rather maintains energy homeostasis; I-FABP performs such function by acting as a lipid-sensing component that alters body weight gain in a gender-specific manner (Vassileva et al. 2000).
High-fat diet and microbiome in intestine
25 are packaged into a lipoprotein particle called chylomicron (Werner et al. 2000). These nascent chylomicrons are covered with phospholipids, cholesterol and apolipoproteins (apoA-I, apoA-IV and apoB-48). The gradual rise of fat absorption and triacylglycerols resynthesis increases the size and number of lipoprotein particles, which are packaged in vesicles filled with pre-chylomicrons. After modification of the pre-chylomicrons into mature chylomicrons in the Golgi apparatus, these vesicles translocate to the lateral enterocytes to be exocytosed into the interstitium and the lymph. Then, they enter the thoracic duct via the mesenteric lymph duct and finally reach the systemic circulation (Werner et al. 2000). During postprandial period, an increase in circulating chylomicrons induces the peak of triglycerides. This peak in plasma triacylglycerol is highest in obese and diabetic individuals (Georgiadi & Kersten 2012). Circulating chylomicrons are further hydrolyzed by the endothelial lipoprotein lipase (LPL) and then fatty acids are distributed to the peripheral tissues (muscles and adipose tissues; Georgiadi & Kersten 2012; Iqbal & Hussain 2009; Niot et al. 2009).
1.4
High-fat diet and microbiome in intestine
In the human body, most of the interactions between host and microbial cells occur along the mucosal surface, and gut is densely populated by commensal and symbiotic bacteria (O’Hara & Shanahan 2006; Shen et al. 2013). The ensemble of microbial cells that are harbored by the human body constitutes the microbiota and all genes encoded by them are the microbiome. In the gut, the microbiome includes 3.3 million non-redundant genes (i.e., they represent an amount of genes that is 150 times larger than the human gene
High-fat diet and microbiome in intestine
26 al. 2010), but its plasticity (i.e., adaptability) in response to diet is also affected by the genome of the host (Parks et al. 2013). When the balanced activity of health-promoting and deleterious/neutral gut microbiome is disrupted, a condition called dysbiosis emerges (Figure 1.1c). This promotes the development of obesity, inflammatory bowel disease, diabetes and other metabolic complications (Clemente et al. 2012; Shen et al. 2013). The microbiota of a healthy human gut is composed of six main bacterial phyla: Firmicutes, Bacteroidetes, Proteobacteria, Actinobacteria, Fusobacteria and
Verrucomicrobia (Eckburg et al. 2005; Shen et al. 2013; Zhang et al. 2009). However, more than 90% of the total gut microbiota comprises Firmicutes and Bacteroidetes (Clemente et al. 2012; Garrett et al. 2010; Shen et al. 2013; Velagapudi et al. 2010).The composition (species/strains members and their abundance) of gut microbiota is unique for each individual (Lozupone et al. 2012; Shen et al. 2013; Zoetendal et al. 1998). Bacterial diversity is lower in obese individuals, with higher abundance of Firmicutes compared to Bacteroidetes (Bäckhed et al. 2007; Clemente et al. 2012; Fleissner et al. 2010; de La Serre et al. 2010; Turnbaugh et al. 2008, 2009). In presence of weight loss there is an increased proportion of Bacteroidetes with a reduction in Firmicutes (Bäckhed et al. 2007; Ley et al. 2006; Turnbaugh et al. 2008). Dietary habits play an essential role in shaping the gut microbiota community. For example, the fecal microbiome of western populations (i.e., from US metropolitan areas) shows less bacterial diversity than the one of populations from non-western areas, and even the phylogenetic composition varies significantly according to the geographical location (when this well approximates different feeding behaviors; Yatsunenko et al. 2012). The gut microbial composition of African children (consuming fiber rich, non-western diet) is enriched in Bacteroidetes and depleted in Firmicutes if compared to European children (consuming western-style diet; De Filippo et al. 2010). In general, western style diet is associated with the reduction of bacterial
Dietary fat intake and diseases in intestine
27
1.5
Dietary fat intake and diseases in intestine
Obesity and other metabolic disorders such as diabetes are characterized by a chronic or low-grade inflammation (Hotamisligil 2006). A condition called metabolic endotoxemia, during which there is an increased proportion of lipopolysaccharides containing gut microbiota, is the causative factor for the associated inflammatory state (Cani et al. 2007). Excess high-fat intake increases the proportion of lipopolysaccharides, which trigger body weight gain and diabetes by dysregulating the inflammatory signal (Cani et al. 2007). Lipopolysaccharides regulate the insulin sensitivity and the onset of diabetes and obesity by binding to the CD14-dependent TLR4 complex of the innate cells (Cani et al. 2007; Wright et al. 1990). Moreover, TLR4 seems to be the molecular link among nutrition, lipids and inflammation such that its deletion partially protects mice from high-fat diet-induced insulin resistance (Shi et al. 2006).Gut microbiota has influence over both sides of the energy balance (i.e., energy harvest from the diet and energy storage into the host) and high-fat diet induced microbiota composition exhibited enhanced energy harvest from the diet (Bäckhed et al. 2004, 2007). Mice fed with high-fat diet show increased intestinal permeability with the down-regulation of the epithelial tight junction proteins ZO-1 and occludin, a condition that leads to liver inflammatory damages by increasing
Dietary fat intake and diseases in intestine
28 the brain (Fasano & Shea-Donohue 2005). Moreover, dysbiotic gut microbiota has
consequences on both (1) extra-intestinal disorders (e.g., obesity, cardiovascular diseases, metabolic syndrome, asthma, and allergy) and (2) intestinal disorders (e.g., inflammatory bowel diseases like Crohn’s disease, irritable bowel syndrome and coeliac disease (Carding et al. 2015; see Figure 1.1d). Many disorders display regionalized distribution along the longitudinal axis of small intestine. Microarray transcriptomic data analysis has revealed that, during dietary fat-induced development of obesity and insulin resistance, the most pronounced effects are in the middle small intestine (with most of the differentially expressed genes that are related to lipid metabolism; de Wit et al. 2008). Among the intestinal inflammatory disorders, Crohn’s disease tends to be restricted to distal small intestine and colon, while coeliac disease is more characteristic of duodenum and upper small intestine (Knights et al. 2013; Meresse et al. 2012). Crohn’s disease displays aberrant inflammatory response to commensal bacteria whereas coeliac disease is triggered by dietary gluten (Knights et al. 2013; Meresse et al. 2012).In patients with ileal Crohn’s disease, the function of Paneth cells is compromised and results in a decrease of
antimicrobial peptide production (i.e., NOD2, ATG16L1 and immunity-related GTPase family M protein 1 - IRGM-1; see Knights et al. 2013; Mowat & Agace 2014; Peterson & Artis 2014; Vaishnava et al. 2008). In patients with coeliac disease, dietary gluten
Nonlinear transcriptomic response to dietary fat intake
29 Prebiotic treatment enhanced the production of GLP-1 and GLP-2 from the
enteroendocrine L cells, which play a vital role in the regulation of gut barrier function and glucose homeostasis (Delzenne & Cani 2011). Oligofructose increased the abundance of
Akkermansia muciniphila, which reversed metabolic disorders induced by high-fat diet
(such as metabolic endotoxemia and insulin resistance; Everard et al. 2013). Malt
counteracted the fat mediated increase in the mRNA expression of tight junction proteins and TLR in the small intestine and distal colon (Zhong et al. 2015).
1.6
Nonlinear transcriptomic response to dietary fat intake
Dietary fatty acids act as signaling molecules and influence metabolic processes by stimulation/inhibition of DNA transcription (Georgiadi & Kersten 2012). The
Thesis objective
30 mice suggests the presence of genetic mechanisms that are activated when a certain limit is attained (Bäckhed et al. 2004; Parks et al. 2013). However, in presence of continual
feeding there are some mice strains that display a disrupted set-point mechanism (i.e., fat accumulation is not constrained and continues throughout the whole feeding period; Parks et al. 2013). These studies suggest that the genetic mechanism regulating fat mass gain reacts to the continual feeding with both saturated (logarithm) and unsaturated
(exponential) responses. Therefore, the exclusive focus on linear response patterns can represent a limit for the understanding of different biological processes that link food intake to gene expression. An alternative approach that seems particularly suitable for studying gene expression in the small-intestine is to model transcriptomic response to varying concentrations of dietary fat intake using linear and nonlinear fitting, by considering fat intake as the independent variable and gene expression intensity as the dependent one. Nonlinear response types can be used to assess the presence of dose-dependent thresholds (e.g., upper limits to gene expression that can be modelled with the logarithmic function). The presence of upper limit thresholds can be related to excessive fat intake and used to quantify small intestine metabolic capacity.
1.7
Thesis objective
Thesis objective
31 digestive processes. In particular, the linear and exponential responses are associated to processes that are not constrained by any saturation (with the latter referring to an increase of the biological efficiency in presence of high-fat concentration), while the logarithmic response implies a limited capacity of the small intestine to withstand excessive fat intake. This idea is further corroborated by the presence of physiological and anatomical
differences from the proximal to the distal section of the small intestine (DeSesso & Jacobson 2001). Such differences are reflected by changes in gene expression and can be related to the following biological mechanisms:
(1) Lipid absorption. Clear differences can be observed for what concerns the absorption
capabilities of small intestine, with the middle part known to be particularly active (de Wit et al. 2008). These differences suggest that the efficiency of the most responsive part (i.e., the middle small intestine, in case of absorptive processes) can be saturated by excessive amounts of fat (i.e., logarithmic response).
(2) Lipid transportation. A high-fat diet leads to excess of cholesterol and phospholipids.
In the small intestine, this excess concomitantly increases the demand for bile acids that are essential for chylomicron assembly and for a proper fat digestion and absorption. The chylomicron is required for lipid transportation and is accompanied by changes in the transcriptomic levels of genes related to its formation (Desmarchelier et al. 2012). Therefore, modelling gene expression as continuous function of dietary fat intake is relevant to understand whether chylomicron formation can be saturated by excessive fat intake (i.e., logarithmic response) or can promptly respond to it (i.e., either with a linear or exponential response).
Thesis overview
32 behavior could be due to the fact that fat absorption and transportation are particularly responsive to increasing levels of fat intake (i.e., exponential response), without being associated to comparable changes for what concerns digestive mechanisms (i.e., saturation patterns with logarithmic response).
1.8
Thesis overview
The thesis is organized into five Chapters. Chapter 1 introduces the morphology and physiology of small intestine, and explains how gene expression responses are modulated by dietary fat intake along its axis. It mainly discusses the reasons and motivations behind the approach utilized for the analysis of two different microarray datasets that measure gene expression along the longitudinal axis of small intestine in C57BL/6J mice. This Chapter also explains why the nonlinear modelling of intestinal transcriptomic response to dietary fat intake is particularly relevant for understanding the consequences of high-fat intake.
Chapter 2 describes the methods used for the analysis of the microarray datasets. Two different gene expression datasets were analyzed and are detailed separately in Chapters 3 and 4. Both datasets measured the genome-wide regulation of mRNA abundance in response to dietary lipid and the samples were collected from the intestinal mucosa of C57BL/6J mice.
Chapter 3 reports the results of the analysis performed on the dietary fat responsive gene expression in three sections of the small intestine of C57BL/6J mice. Intestinal
Thesis overview
33 transcriptomic responses to dietary fat intake were tested along the longitudinal axis of the small intestine. The objective was investigating the presence of: (1) gene-specific response types for which a particular gene exhibits the same response type regardless of the
intestinal section; (2) section-specific response types, meaning that a particular gene
displays unique response types in different intestine sections. We found that: (1) the middle section was the most responsive to dietary fat intake; (2) the relative importance of
logarithmic and exponential response was highest in the proximal and distal section, respectively; (3) the majority of the genes were linearly responsive to the fat intake; (4) there was gene-specific, linear response of inflammation related processes in the whole intestine, while the processes related to cholesterol transport and efflux were regulated with exponential response in the middle section.
Chapter 4 is about the analysis of transcriptomic data collected from ten sections of the small intestine of C57BL/6J mice. These mice were fed with three kinds of diet (i.e., high-fat, low-fat or chow) and the dietary intervention lasted 2 weeks. The consumption of dietary fat is essential as it represents a metabolic fuel and plays a key role in the structure of cell membranes. However, when fat is consumed in excess the intestine can adapt to it and increase its absorption (i.e., by increasing the secretion of bile acid for fat digestion). Therefore, three main kinds of transcriptomic response (i.e., linear, logarithmic or
Thesis overview
35
Chapter 2
Materials and methods
2.1
Transcriptome microarray
This section briefly introduces the fundamentals of genomic expression and the Affymetrix GeneChip technology. The main aim is to describe the transcriptomic datasets that were used to investigate the patterns of gene expression response types (i.e., linear and
nonlinear: logarithmic, exponential, quadratic or cubic) as a function of dietary fat gradient along the longitudinal axis of the murine small intestine.
2.1.1 Affymetrix GeneChip technology
Gene expression quantification is mainly performed using Affymetrix GeneChip oligonucleotide microarray and cDNA microarray. The datasets analyzed in this thesis were produced using Affymetrix GeneChip microarrays. These GeneChip arrays were manufactured using spatially patterned, light-directed combinatorial chemical synthesis (Lipshutz et al. 1999). Each array contains up to hundreds of thousands different
Transcriptome microarray
36 single base in the middle of the later shows a mismatch (i.e., the MM probe differs from the PM by a change in the central nucleotide). The benefit for having MM probes and probesets is that they reduce the effects of non-specific hybridization/binding and background signal (Murphy 2002). The intensity of the hybridization between the target sample and the probe array is computed for each probe cell (location for each probe). The image of this probe array is stored as .DAT file. The pixel values per probe cell are calculated and used to produce another (.CEL) file containing the probe intensity. This thesis is based on the analysis of data stored in .CEL files.
2.1.2 Microarray data
This thesis investigates the genome wide effects of dietary lipids in the small-intestine using two distinct microarray transcriptomic datasets. The data were collected from the intestinal mucosa of male C57BL/6J mice. Two experiments were carried out; they were based on two types of dietary intervention. For the first dataset, different doses of dietary fat (i.e., 10%, 20%, 30% or 45% kcal from fat) were supplied. For the second dataset, three kinds of diets (i.e., high-fat, low-fat or chow) were used.
Transcriptome microarray
37 GSE26300) and are MIAME (Minimum Information About a Microarray Experiment) complaint. Chapter 3 presents the results obtained by analyzing this dataset.
10E% fat 20E% fat 30E% fat 45E% fat
gm% kcal% gm% kcal% gm% kcal% gm% kcal%
Protein 19 20 20 20 22 20 24 20
Carbohydrate 67 69 60 60 53 50 40 35
Fat 4 10 9 20 14 30 24 45
Other 10 1 11 1 11 1 12 1
Total 100 100 100 100 100 100 100 100
kcal/gm 3.8 4.1 4.3 4.7
Ingredient gm kcal gm kcal gm kcal gm kcal
Casein, lactic 200 800 200 800 200 800 200 800
L-Cystine 3 12 3 12 3 12 3 12
Corn Starch 427.2 1709 325.8 1303 224.3 897 72.8 291
Maltodextrin 100 400 100 400 100 400 100 400
Sucrose 172.8 691 172.8 691 172.8 691 172.8 691
Cellulose, BW200 50 0 50 0 50 0 50 0
Soybean Oil 25 225 25 225 25 225 25 225
Palm oil 20 180 65.2 586 110.2 992 177.5 1598
Mineral Mix S10026* 10 0 10 0 10 0 10 0
DiCalcium Phosphate 13 0 13 0 13 0 13 0
Calcium Carbonate 5.5 0 5.5 0 5.5 0 5.5 0
Potassium Citrate, 1 H2O
16.5 0 16.5 0 16.5 0 16.5 0
Vitamin Mix V10001* 10 40 10 40 10 40 10 40
Choline Bitartrate 2 0 2 0 2 0 2 0
Total 1055 4057 999 4057 942 4057 858 4057
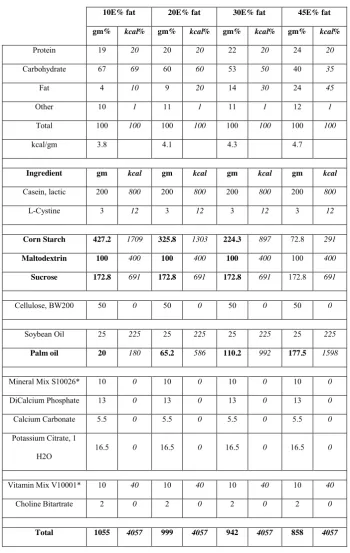
Table 2.1: Diet composition of the intervention used for the case study discussed in Chapter 3. Main
ingredients are in bold (e.g., palm oil is the main source of saturated fats whereas corn starch is the main
Background correction and quality assessment
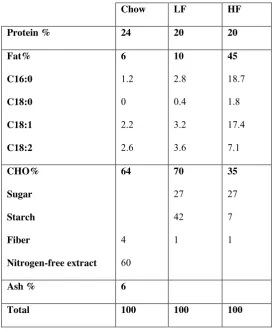
38 In the second case study, transcriptomic data were collected from ten sections of the small intestine of male C57BL/6J mice. The microarray platform used for this study was
customized Affymetrix mogene11stmmentrezg arrays. Mice received diets containing high-fat (HF), low-fat (LF) or chow. The detailed composition of diet is summarized in Table 2.2. Each diet group contained four biological replicates in the ten sections of the small intestine. Altogether we analyzed 120 arrays and each array consisted of 21,266 probesets. Chapter 4 presents the results of this analysis.
Chow LF HF
Protein % 24 20 20
Fat%
C16:0
C18:0
C18:1
C18:2
6
1.2
0
2.2
2.6
10
2.8
0.4
3.2
3.6
45
18.7
1.8
17.4
7.1
CHO%
Sugar
Starch
Fiber
Nitrogen-free extract
64
4
60
70
27
42
1
35
27
7
1
Ash % 6
Total 100 100 100
Table 2.2: Dietary intervention used for the case study presented in Chapter 4. Three types of diet were
used: chow, low-fat (LF) and high-fat (HF).
2.2
Background correction and quality assessment
Background correction and quality assessment
39 by variations from sources such as technical (non-specific hybridization or optical noise) or manual handling. Therefore, it is necessary to perform preprocessing before obtaining significant biological information. Data preprocessing and quality assessment was performed using the interactive environment provided by the affyPLM package (Bolstad 2004). This package is an updated version of the affy package and is part of BioConductor software project (Gentleman et al. 2004) that is based primarily on the R Statistical
Environment (R Core Team 2015).The fitPLM function of the affyPLM package was used to fit probe level linear model to Affymetrix data. This function fits robust Probe Level Linear Models to each probeset and converts Affymetrix GeneChip probe level data (AffyBatch) into a PLMset (Probe Level Linear Models fitted to Affymetrix GeneChip probe level data). The standard series of steps adopted for the preprocessing of raw data are: (1) background adjustment and normalization (to reduce variability within or between arrays), and (2) summarization (a probeset consists of multiple probes and summarization combines these intensities to an expression value). In GeneChip arrays, multiple probes in a probeset represent a given transcript and intensity values are summarized into an
expression value.
2.2.1 Background adjustment
Affymetrix introduced MM probe sequences in order to reduce non-specific binding. The default background noise correction involves subtracting MM from PM intensity.
However, Irizarry et al. found that this strategy can lead to over-estimation of the
expression variance (Irizarry et al. 2003). Therefore, they proposed a new procedure called robust multi-array average (RMA) that corrects the PM intensities whilst neglecting MM. This preprocessing algorithm (RMA) is widely used for Affymetrix microarrays. It includes background correction and also performs quantile normalization and
Background correction and quality assessment
40 Chapter 4 was implemented using RMA (i.e., it is based on global background
adjustment). Using the normalization and the summarization methods of RMA, Wu et al. (2012) proposed another background adjustment algorithm called GCRMA. GCRMA adjusts the intensities via estimators derived from a statistical model that relies on probe sequence information. The dataset analyzed in Chapter 3 was preprocessed using GCRMA. Both RMA and GCRMA produce output data with expression values measured in log 2 base scales. The affyPLM package provides multiple quality assessment tools such as Relative Log Expression (RLE) and Normalized Unscaled Standard Error (NUSE) plots. The Relative Log Expression tool computes RLE values for each probeset in each array by comparing the expression value of a probeset against the median expression value of the probeset across all arrays (Brettschneider et al. 2008). This approach assumes that, in a given array, only a few genes are differentially expressed and therefore RLE values are centered near 0. The Normalized Unscaled Standard Error considers the differences in variability; the standard error estimates for each gene in the PLMset are normalized such that the median standard error for a probeset across all arrays equals 1 (Brettschneider et al. 2008). The quality of the datasets of Chapter 3 was assessed using RLE and NUSE plots.
2.2.2 Variability adjustment and quality assessment
Variations in expression between multiple arrays are categorized into interesting variations and obscuring variations. Interesting variations are contributed by biological differences (e.g., differences between disease and normal tissues), while obscuring variations depend on other factors that are of no biological interest but exist in almost all microarray data (i.e., they can be due to sample preparation, hybridization condition and scanner differences; see Bolstad et al. 2003). Therefore, in order to compare measurements
Background correction and quality assessment
41 performed with several methods. There are methods which use information from all arrays; these methods are called complete data methods and include cyclic loess, contrast based method and quantile normalization. Other approaches use baseline arrays such as scaling and non-linear methods (Bolstad et al. 2003). Bolstad et al. (2003) compared the
performance of these normalization methods for Affymetrix GeneChip. The comparison showed that the quantile method performs better than the others in terms of speed, variance and bias criteria (Bolstad et al. 2003). Quantile normalization transforms the probe
intensities of arrays to have the same distribution. This approach can impose problems to the signals in the tail. However, empirical evidence does not suggest any drawback with this normalization method in practice (Bolstad et al. 2003; Irizarry et al. 2003). Therefore, the usage of this method is preferred over the other methods. This normalization method was applied to the datasets analyzed in in Chapters 3 and 4. Additionally, another normalization technique called UPC (Universal exPression Code) was applied to the
Regression models
42
2.3
Regression models
Linear regression model was applied to describe the relationship between the
dependent/response variable (i.e., gene expression) and the independent/predictor variable (i.e., dietary intervention). The linear relation could also be expressed as:
𝑦 = 𝛽 + 𝛽 𝑥 + 𝜀
Or
𝐺𝑒𝑛𝑒 𝑒𝑥𝑝𝑟𝑒𝑠𝑠𝑖𝑜𝑛 𝑟𝑒𝑠𝑝𝑜𝑛𝑠𝑒 = 𝛽 + 𝛽 𝐷𝑖𝑒𝑡𝑎𝑟𝑦 𝑖𝑛𝑡𝑒𝑟𝑣𝑒𝑛𝑡𝑖𝑜𝑛 + 𝜀
Where 𝑦: The predicted value of the response variable
𝛽 : The intercept or response value when the predictor variable equals zero 𝛽 : The slope that quantifies the relation between the predictor variable and the
response variable
𝑥: The independent or predictor variable 𝜀: The residual error
Analysis of differentially expressed genes
43 nonlinear gene expression in response to dietary fat intake was modelled in the R
Statistical Environment (R Core Team 2015) by using the syntax summarized in Table 2.3.
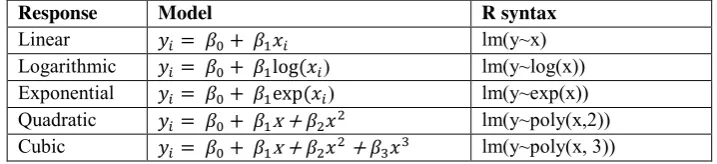
Response Model R syntax
Linear 𝑦 = 𝛽 + 𝛽 𝑥 lm(y~x) Logarithmic 𝑦 = 𝛽 + 𝛽 log (𝑥) lm(y~log(x)) Exponential 𝑦 = 𝛽 + 𝛽 exp (𝑥) lm(y~exp(x)) Quadratic 𝑦 = 𝛽 + 𝛽x + 𝛽 𝑥 lm(y~poly(x,2)) Cubic 𝑦 = 𝛽 + 𝛽x + 𝛽 𝑥 + 𝛽 𝑥 lm(y~poly(x, 3))
Table 2.3 R syntax for testing linear and nonlinear responses. Biological interpretations of these models
is that the consumption of excessive fat may result in the saturation (i.e., logarithmic) of some biological
processes (i.e., absorption or digestion). However, some processes that are not constrained by any saturation
may be measured by linear and exponential responses, which describe increased efficiency in presence of
highest fat concentration. Quadratic and cubic functions measure processes that follow hyperbolic and
oscillating responses, respectively.
2.4
Analysis of differentially expressed genes
In this thesis, the relationship linking gene expression to dietary fat intake along the longitudinal axis of the small intestine was investigated. The transcriptomic data presented in Chapter 3 was fitted with linear and nonlinear (logarithmic, exponential, quadratic and cubic) responses by using dietary fat doses (10%, 20%, 30% and 45% of energy intake) as a continuous predictor of gene expression (i.e., gene expression levels were analyzed as a continuous function of fat intake). Gene expression intensity and fat doses were considered as the dependent and independent variable, respectively. Linear regression was performed on the processed data (i.e., log 2 transformed gene expression); data were
Analysis of differentially expressed genes
44 threshold for the adjusted p-values was at 0.1. When a gene was significant in more than one response type, the one with the lowest adjusted p-value was selected. In Chapter 4, the transcriptomic data was fitted with linear and nonlinear (logarithmic and quadratic)
responses as a function of the interaction between diet and intestinal sections (i.e., both diet and intestinal section are the independent variables; gene expression is the dependent variable). This analysis investigated the transcriptomic response to distinct diets (i.e., high-fat, low-high-fat, or chow) along the small intestinal axis. The reasons behind the fitting of logarithmic and quadratic responses are: (1) when the amount of fat reaching the intestine is highest, the metabolic processes may display saturated (i.e., logarithmic) response; (2) the digestion process and the microbiota effects are expected to be highest in the most proximal and distal sections, respectively; as such these activities could be effectively modelled with a quadratic response that describes the highest expression in the proximal and distal sections (and lowest in the middle). Diet was represented as ordered categorical values (i.e., chow < low-fat diet < high-fat diet) to illustrate the increasing energy content of fat. The intestinal sections were considered as continuous numerical values (i.e., values from 1 to 10 refer to the longitudinal axis of the small intestine, moving from most
proximal to the most distal section). The limma library was used to perform linear regression on the pre-processed data (i.e., log 2 transformed gene expression; see Smyth 2005). For the nonlinear responses, gene expression was modelled as a function of the interaction between diet, and logarithmic or quadratic transformed intestinal sections. Lists of dietary fat responsive (differentially expressed) genes were obtained by making
Correlation network analysis
45 and have different biological explanations: (1) the logarithmic response reports the
presence of saturation mechanisms; (2) the exponential response corresponds to extremely efficient processes in the presence of high-fat intake; (3) the quadratic response refers to enzyme kinetics; (4) the cubic response is expected to be associated to circadian rhythms with oscillating trends. The limma library computes moderated t-statistics for each probe (and for each contrast). It differs from the ordinary t-statistics because: (1) the standard errors across genes are moderated to a common value by using the simple Bayesian model (i.e., the standard error measured from the estimated log-fold changes are moderated towards a common value by borrowing information across genes); (2) the degrees of freedom are increased to be consistent with the smoothened standard errors (Smyth 2005).
2.5
Correlation network analysis
Functional annotation of the differentially expressed genes
46 Langfelder & Horvath 2008). Most biologically interesting clusters (i.e., clusters that showed significant correlation with the ten intestinal sections) were obtained by finding the most significant association between the eigengene profiles of each cluster with the ten intestinal sections (Langfelder & Horvath 2008).
2.6
Functional annotation of the differentially expressed genes
The functional annotation of the differentially expressed genes found with both datasets (i.e., in Chapters 3 and 4) were performed with two different libraries in R. The over-represented Gene Ontology Biological Processes (GOBP) relative to each section (and for each response type) in the first dataset (i.e., Chapter 3) were investigated using the
Biological process trend analysis
47 cluster, the enriched GOBP terms were grouped based upon GO similarities (i.e., by
considering information content measure of GO terms within a specific ontology - biological process in our case) as implemented in GOSim library (Fröhlich et al. 2007). The information content values for each GO term are precomputed. These values are based on the number of times a specific GO and its gene products or neighboring (i.e., direct or indirect) offspring are annotated into the GO. In order to test the nonlinear responses in each network cluster the over-represented GO terms that refer to metabolic and transport processes were selected for further analysis. Also, the clusters that showed the highest significance to diet-responsive GOBP and that displayed the highest correlation with the ten intestinal sections (i.e., as computed using WGCNA library) were considered for the subsequent analysis (i.e., to find the predominant transcriptomic responses for each
enriched process and examine which intestinal segments are most responsive to diet). Each of these clusters was characterized by the GO term with the highest information content value. This selection was made by identifying more specific GOBP terms (e.g., lipid metabolic process prevails over general terms like metabolic process).
2.7
Biological process trend analysis
In order to check if specific response types (i.e., linear, logarithmic, exponential, quadratic or cubic) are representative of certain biological processes or change their relative
Biological process trend analysis
48 exponential). Two additional analyses were performed in Chapter 4 to identify dietary mediated predominant response types in each of the ten sections. First, the most
49
Chapter 3
Nonlinear transcriptomic response
to dietary fat intake in the small
intestine of C57BL/6J mice
1
3.1
Background
Overconsumption of food that are rich in saturated fats leads to excessive energy intake and is strongly linked to metabolic disorders such as obesity, diabetes, cardiovascular diseases and some forms of cancer (Balwierz et al. 2009; Cheung & Mao 2012;
Desmarchelier et al. 2012; Walley et al. 2006; Zhang et al. 2009). As the primary source of dietary fat uptake, the small intestine plays a key role in governing nutritional health (Kaminsky & Zhang 2003; Kondo et al. 2006; Petit et al. 2007; Thomson et al. 1986; de Wit et al. 2008). The intestinal absorptive capacity is enhanced by numerous fingers like projections of the mucosal membrane called villi, and there exist regionalized anatomic and physiological differences from proximal duodenum to distal ileum (Figure 1.1). The middle section has longer villi in comparison with the proximal and distal sections. It covers nearly half of the intestinal length and is characterized by the highest absorptive
1 Chapter 3 includes the findings of the following manuscript: Nyima, T. et al., Nonlinear transcriptomic
Background
50 capacity. The distal section contains shorter villi and less absorptive capacity
(Desmarchelier et al. 2012; Goncalves et al. 2015).
The small intestine acts as a gatekeeper between the diet and the body and can directly metabolize or block the uptake. Recent studies have demonstrated a strong intestinal transcriptomic response to dietary fat intake. Kondo et al. (2006) found high fat-induced up-regulation of lipid metabolism-related genes (e.g., Mod1, Cyp4a10, Acot1 and Acot2) in
the small intestine of C57BL/6J mice, with negligible effects observed in the liver, muscle and white adipose tissue. Fat intake triggers the down-regulation of ABC half-transporters
(Abcg5 and Abcg8) in liver and intestine thus leading to increased levels of sterols in
diabetic rats (Bloks et al. 2004). Biological processes like inflammatory response and cell cycle were highly up-regulated in the small intestine of C57BL/6J mice during dietary fat induced development of obesity and insulin resistance (de Wit et al. 2008). The absorption capacity of intestine displays adaptability in response to dietary fat composition such as enhanced intestinal cell proliferation, synchronization of fatty acid uptake and lipoprotein secretion, and altered transport processes (Petit et al. 2007; Thomson et al. 1986).Section-wise studies focused on gene-specific responses: (I) Simon et al. (2011) found increased distal gut hormone response to a high fat diet in apoA-IV knockout mice; (II) Nassir et al. (2007) observed sharp decreasing gradient in CD36 levels from proximal to distal
intestine. de Wit et al. (2011) showed prominent effect of dietary-fat doses on gene
Background
Background
52 section where they occur). For example, such an approach can be used to illustrate whether an obese phenotype (I) corresponds to a 'tipping point' of the system (i.e., exponential response vs. linear and logarithmic responses) or (II) is limited by the metabolic capacity of the system (i.e., logarithmic response vs. linear and exponential responses). Moreover, distinguishing among the shape of the response types in differentially expressed genes adds a further qualitative level to the description of the biological processes (i.e., in addition to the magnitude and direction of the regulation). The broadest goal of our study was
Background
53
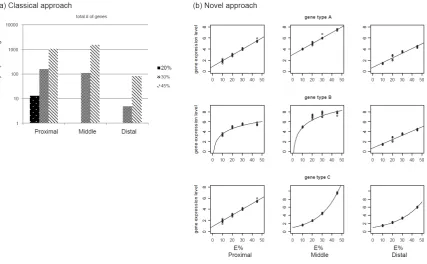
Figure 3.1: Comparison between classical and novel approach for identifying differentially expressed
genes. We use as a reference the case study of mice fed with four levels of fat representing 10%, 20%, 30%
and 45% of total energy intake; gene expression is measured in three sections of small intestine: (a) in the
classical approach, the total number of differentially expressed genes is determined by comparing the control
diet (10 E%) with treatments (20 E%, 30 E% and 45 E%); (b) in the novel approach, all expression levels of
each gene (in the three sections) are considered to fit linear or nonlinear (i.e., logarithmic and exponential, in
this case) response types. Three hypothetical patterns are described in (b): (I) gene type A preserves a linear
response in the three sections of small intestine; (II) gene type B displays saturation (i.e., logarithmic
response) in the proximal and middle sections; (III) gene type C shows exponential responses in most
downstream sections (i.e., middle and distal parts of small intestine). Transcriptomic response of gene type A
Materials and methods
54
3.2
Materials and methods
3.2.1 Ethics statement
The institutional and national guidelines for the care and use of animals were followed. The experiment was approved by the Local Committee for Care and Use of Laboratory Animals at Wageningen University.
3.2.2 Dietary intervention
At twelve weeks of age, mice were fed for an initial period of four weeks with a control diet containing 10% of energy intake from fat. The main reason for this relatively long run-in period was that we wanted to be sure that the effects of chow diet were highly
diluted/not present when starting the dietary intervention. In addition, since we wanted to investigate the effect of diet-induced obesity in adults, we choose to start the experiment when the mice were 16 weeks old (mice aged 12 weeks are considered young adults that are still growing). After the initial period, mice were divided into four groups that received 10%, 20%, 30% or 45% kcal from fat (see Table 2.1 for dietary composition). The dietary intervention lasted four weeks and then mice were killed by cervical dislocation after five hours fasting and anesthesia with 1.5% isoflurane. The isoflurane was evaporated in a vaporizer using a mixture consisting of 70% nitrous oxide and 30% oxygen. Ten biological replicates were carried out for each diet group in the three sections of the small intestine (i.e., altogether we analyzed 120 samples).
3.2.3 Microarray data
Materials and methods
55 sections. These three parts were chosen because of practical reasons; when dissecting the small intestine one has to process the tissue quickly to avoid RNA degradation. The 1st part (i.e., proximal section) consists of the duodenum plus proximal jejunum, the 2nd part (i.e., middle section) corresponds to jejunum, and the 3rd part (i.e., distal section) includes the distal jejunum and ileum. Detailed protocols on dietary intervention and RNA
extraction are described by de Wit et al (de Wit et al. 2011). The microarray platform used for this study is nugomm1a520177mmentrezg, a custom Affymetrix mouse array
containing 16,269 probesets. The NuGO arrays are custom designed Affymetrix GeneChip arrays, designed by the European Nutrigenomics Organisation (NuGO) and manufactured by Affymetrix. These arrays contain in part common probe sets that are also present on standard Affymetrix arrays and in part newly designed probe sets (GEO platform
GPL7440). The microarray data used for our analyses are MIAME compliant, available at GEO (accession number GSE26300). Data pre-processing and quality assessment,
statistical analysis to identify differentially expressed genes and pathway analysis have been carried out in the R Statistical Environment (R Core Team 2015).
3.2.4 Data pre-processing and quality assessment
We used the affyPLM (PLM = Probe Level Model) library for data preprocessing and quality assessment. We applied the fitPLM function that fits iterative reweighted least square M-estimation regression to the probe intensity (Bolstad 2004). Background
intensities (optical noise and non-specific binding) were adjusted with the GCRMA library (Wu et al. 2007). Such adjustment is obtained via estimators derived from a statistical model that uses probe sequence information. The GCRMA library has been shown to perform particularly well in adjusting background intensity in Affymetrix Genechips (Kroll et al. 2008). After background adjustment, technical variability between arrays was
Materials and methods
56 assessed by plotting Relative Log Expression (RLE) and Normalized Unscaled Standard Error (NUSE; Brettschneider et al. 2008). Genes with low variability across samples are usually considered as not expressed. This is motivated by the observation that, in general, unexpressed genes are detected most reliably through low variability of their features across samples. Non-specific filtering of the genes was made with the genefilter library (Bourgon et al. 2010; Gentleman et al. 2012). The pOverA R function was used for variance-based filtering; genes with unlogged intensity above five, in at least five arrays, were chosen for the subsequent analysis. Genes without Entrez Gene ID and Affymetrix quality control probe-sets were excluded. After data pre-processing and quality assessment we selected 14,952 genes in the proximal section, 14,933 in the middle and 14,925 in the distal.
3.2.5 Statistical analysis to identify differentially expressed genes
We investigated the statistical relationship between gene expression and dietary fat intake. We fitted linear and nonlinear (i.e., logarithmic, exponential, quadratic and cubic)
responses describing gene expression levels (dependent variable) as a function of dietary fat intake (independent variable). We considered nonlinear responses that reflect: (I) blunted differential expression at higher fat intake, which may indicate overloading of the relevant biological process (logarithmic curve); (II) progressively stronger differential expression with increasing fat intake (exponential curve); (III) parabola-like differential expression (quadratic function); (IV) oscillating trends (cubic function). The array data were log2 transformed (GCRMA normalized data). All responses (i.e., linear and
Materials and methods
57 percentage (and a linear relationship existed between the % of kcal from fat intake and the actual grams of fat intake - i.e., soybean oil and palm oil). Fat intake (the independent variable) is considered as continuous predictor of log2 transformed gene expression. We used the limma library (Smyth 2005) to pe